You are not logged in.
This means you
CAN ONLY VIEW reports that were published prior to Thursday, March 20, 2025.
You
MUST UPGRADE YOUR MEMBERSHIP if you want to see any current reports.
AFTER MARKET UPDATE - THURSDAY, SEPTEMBER 14TH, 2023
Previous After Market Report Next After Market Report >>>
|
|
|
|
DOW |
+331.58 |
34,907.11 |
+0.96% |
|
Volume |
918,375,877 |
+4% |
|
Volume |
4,862,442,800 |
-1% |
|
NASDAQ |
+112.47 |
13,926.05 |
+0.81% |
|
Advancers |
2,242 |
78% |
|
Advancers |
2,888 |
67% |
|
S&P 500 |
+37.66 |
4,505.10 |
+0.84% |
|
Decliners |
629 |
22% |
|
Decliners |
1,424 |
33% |
|
Russell 2000 |
+25.79 |
1,866.63 |
+1.40% |
|
52 Wk Highs |
59 |
|
|
52 Wk Highs |
52 |
|
|
S&P 600 |
+19.36 |
1,197.88 |
+1.64% |
|
52 Wk Lows |
60 |
|
|
52 Wk Lows |
183 |
|
|
 |
Breadth Positive as Major Indices Posted Solid Gains
Kenneth J. Gruneisen - Passed the CAN SLIM® Master's Exam
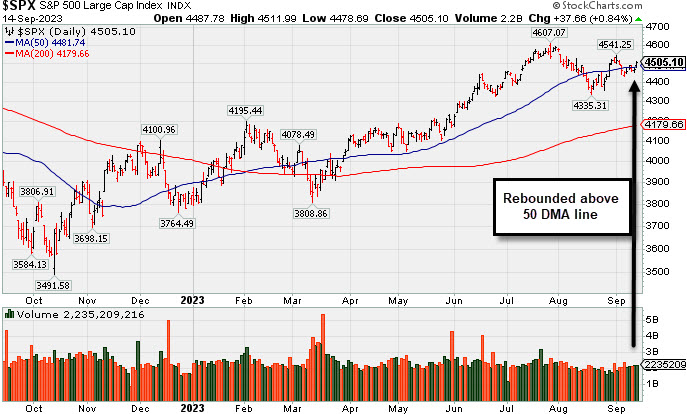
The major indices all closed near their best levels of the session with decent gains. The S&P 500 and the Nasdaq Composite climbed past their 50-day moving averages. Volume totals reported were mixed, slightly higher than the prior session on the NYSE and lighter on the Nasdaq exchange. Breadth was positive as advancers led decliners by more than a 3-1 margin on the NYSE and by a 2-1 margin on the Nasdaq exchange. There were 17 high-ranked companies from the Leaders List that hit a new 52-week high and were listed on the BreakOuts Page versus the total of 16 on the prior session. New 52-week lows and new 52-week highs totals were nearly even on the NYSE while new lows still solidly outnumbered new highs on the Nasdaq exchange. The major indices are in a confirmed uptrend (M criteria).
PICTURED: The S&P 500 Index rebounded above its 50-day moving average (DMA) line with Thursday's gain helping its technical stance improve.
Gains were fairly broad in nature. 28 of the 30 Dow components logged a gain and all 11 S&P 500 sectors were positive. The real estate sector (+1.7%) saw the biggest gain. Energy (+1.3%) was another top performer, climbing alongside oil prices ($90.26/bbl, +1.69, +1.9%). The health care (+0.3%) and information technology (+0.7%) sectors closed at the bottom of the lineup. Delta Air Lines (DAL -0.6%) was the latest airline to warn for Q3 due in part to rising fuel costs.
The positive bias was driven by a couple of factors. There was a speculative buzz in the air surrounding the Arm Holdings (ARM +24.7%) IPO. There was also some central bank news and economic data that comported with a more hopeful economic outlook. The 2-yr note yield rose two basis points to 5.01% and the 10-yr note yield rose four basis points to 4.29%.
The ECB raised its three, key interest rates by another 25 basis points, but hinted that it might be done raising rates, thereby opening the door to claims that today's move was a "dovish hike." The PBOC said the required reserve ratio will be cut by 25 basis points, effective September 15, for all banks that don't currently have a 5% reserve ratio. August retail sales (+0.6%) were stronger than expected. The August PPI report produced an in-line core reading and some palatable year-over-year increases of 1.6% for total PPI and 2.2% for core-PPI, respectively. Initial jobless claims for the week ending September 9 were just 220,000, which is a level associated with a tight labor market that is supportive of continued consumer spending.
|
 Kenneth J. Gruneisen started out as a licensed stockbroker in August 1987, a couple of months prior to the historic stock market crash that took the Dow Jones Industrial Average down -22.6% in a single day. He has published daily fact-based fundamental and technical analysis on high-ranked stocks online for two decades. Through FACTBASEDINVESTING.COM, Kenneth provides educational articles, news, market commentary, and other information regarding proven investment systems that work in good times and bad.
Comments contained in the body of this report are technical opinions only and are not necessarily those of Gruneisen Growth Corp. The material herein has been obtained from sources believed to be reliable and accurate, however, its accuracy and completeness cannot be guaranteed. Our firm, employees, and customers may effect transactions, including transactions contrary to any recommendation herein, or have positions in the securities mentioned herein or options with respect thereto. Any recommendation contained in this report may not be suitable for all investors and it is not to be deemed an offer or solicitation on our part with respect to the purchase or sale of any securities. |
|
 |
Commodity-Linked Groups and Financials Led Gainers
Kenneth J. Gruneisen - Passed the CAN SLIM® Master's Exam
The financial indexes posted solid gains as the Bank Index ($BKX +1.88%) and the Broker/Dealer Index ($XBD +1.58%) both outpaced the Retail Index ($RLX +0.41%). The tech sector was led by the Networking Index ($NWX +1.36%) while the Semiconductor Index ($SOX +0.67%) posted a smaller gain and the Biotech Index ($BTK +0.03%) finished flat. Commodity-linked groups had a positive bias as the Oil Services Index ($OSX +1.88%), Integrated Oil Index ($XOI +1.21%) and Gold & Silver Index ($XAU +1.48%) posted unanimous gains.
PICTURED: The Bank Index ($BKX +1.88%) has been rebounding toward its 50-day moving average (DMA) line. It has been living below its 200 DMA line since an abrupt downturn in March 2023.
| Oil Services |
$OSX |
98.36 |
+1.81 |
+1.88% |
+17.29% |
| Integrated Oil |
$XOI |
1,987.97 |
+23.85 |
+1.21% |
+11.23% |
| Semiconductor |
$SOX |
3,584.23 |
+23.78 |
+0.67% |
+41.55% |
| Networking |
$NWX |
788.20 |
+10.54 |
+1.36% |
+0.62% |
| Broker/Dealer |
$XBD |
510.31 |
+7.92 |
+1.58% |
+13.62% |
| Retail |
$RLX |
3,732.74 |
+15.09 |
+0.41% |
+35.54% |
| Gold & Silver |
$XAU |
116.38 |
+1.70 |
+1.48% |
-3.70% |
| Bank |
$BKX |
82.81 |
+1.53 |
+1.88% |
-17.89% |
| Biotech |
$BTK |
5,237.10 |
+1.77 |
+0.03% |
-0.83% |
|
|
|
 |
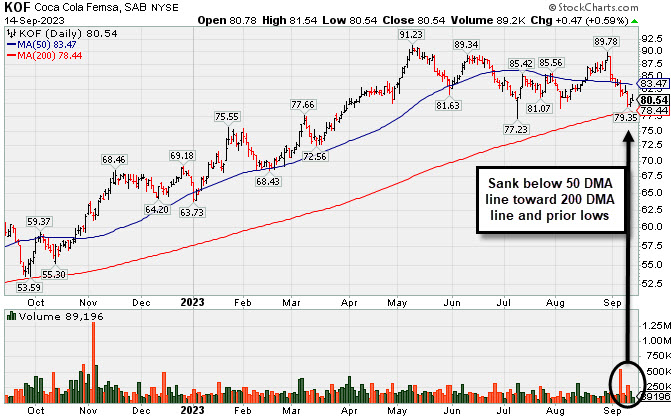
Lingering Below 50 DMA Line and Relative Strength Rating Slumped
Kenneth J. Gruneisen - Passed the CAN SLIM® Master's Exam
Coca Cola Femsa Sab Ads (KOF +$0.47 or +0.59% to $80.54) is still below its 50-day moving average (DMA) line ($83.47) and recently found support near its 200 DMA line ($79.18). More damaging losses would raise serious concerns and trigger a mor worrisome technical sell signal. It faces near-term resistance due to overhead supply up to the $91 area. Its Relative Strength Rating is currently 75, well below the 80+ minimum guideline for buy candidates.
KOF has a 96 Earnings Per Share Rating but it reported Jun '23 quarterly earnings +23% on +26% sales revenues versus the year-ago period, breaking a streak of 4 quarterly comparisons above the +25% minimum guideline (C criteria). It was highlighted in yellow with pivot point cited based on its 1/24/23 high plus 10 cents in the 3/07/23 mid-day report (read here). It was last shown in great detail on 8/10/23 with an annotated graph under the headline "50-Day Moving Average Line has Acted as Resistance". Annal earnings had a downturn in FY '20 like many companies during the pandemic.
It hails from the Beverages - Non-Alcoholic group which is currently ranked 13th on the 197 Industry Groups list. There are 857.1 million shares in the public float (S criteria). The number of top-rated funds owning its shares rose from 120 in Mar '22 to 176 in Jun '23, a reassuring sign concerning the I criteria. However, its current Up/Down Volume Ratio of 1.0 is an unbiased indication its shares have been neutral concerning accumulation/distribution over the past 50 days.
|
|
|
Color Codes Explained :
Y - Better candidates highlighted by our
staff of experts.
G - Previously featured
in past reports as yellow but may no longer be buyable under the
guidelines.
***Last / Change / Volume data in this table is the closing quote data***
Symbol/Exchange
Company Name
Industry Group |
PRICE |
CHANGE
(%Change) |
Day High |
Volume
(% DAV)
(% 50 day avg vol) |
52 Wk Hi
% From Hi |
Featured
Date |
Price
Featured |
Pivot Featured |
|
Max Buy |
 STRL
-
NASDAQ
STRL
-
NASDAQ
Sterling Infrastructure
Bldg-Heavy Construction
|
$74.73
|
+1.04
1.41% |
$75.76
|
302,579
72.56% of 50 DAV
50 DAV is 417,000
|
$84.00
-11.04%
|
12/14/2022
|
$32.41
|
PP = $33.72
|
|
MB = $35.41
|
Most Recent Note - 9/13/2023 6:44:29 PM
G - Retreating from its all-time high with near-average volume behind today's 7th consecutive loss. It is extended from any sound base. Near-term support is its 50 DMA line ($69.43). Fundamentals remain strong. See the latest FSU analysis for more details and a new annotated graph.
>>> FEATURED STOCK ARTICLE : 7th Straight Loss Off High for Sterling Infrastructure - 9/13/2023 |
View all notes |
Set NEW NOTE alert |
Company Profile |
SEC
News |
Chart |
Request a new note
C
A
S
I |
FIX
-
NYSE
Comfort Systems USA
Bldg-A/C and Heating Prds
|
$188.65
|
+0.16
0.08% |
$192.33
|
209,512
95.23% of 50 DAV
50 DAV is 220,000
|
$192.33
-1.91%
|
4/27/2023
|
$148.85
|
PP = $152.23
|
|
MB = $159.84
|
Most Recent Note - 9/13/2023 12:24:18 PM
G - Perched near its all-time high, extended from any sound base. Its 50 DMA line ($175) defines important near-term support to watch on pullbacks. Fundamentals remain strong.
>>> FEATURED STOCK ARTICLE : FIX Still Stubbornly Hovering Near High - 8/21/2023 |
View all notes |
Set NEW NOTE alert |
Company Profile |
SEC
News |
Chart |
Request a new note
C
A
S
I |
KOF
-
NYSE
Coca Cola Femsa Sab Ads
FOOD and BEVERAGE - Beverages - Soft Drinks
|
$80.54
|
+0.47
0.59% |
$81.54
|
89,196
58.18% of 50 DAV
50 DAV is 153,300
|
$91.23
-11.72%
|
6/9/2023
|
$88.61
|
PP = $91.33
|
|
MB = $95.90
|
 Most Recent Note - 9/14/2023 6:59:26 PM
G - Perched -11.7% off its 52-week high but its Relative Strength Rating is currently 75. Reported Jun '23 quarterly earnings +23% on +26% sales revenues versus the year-ago period, below the +25% minimum guideline (C criteria). See the latest FSU analysis for more details and a new annotated graph.
>>> FEATURED STOCK ARTICLE : Lingering Below 50 DMA Line and Relative Strength Rating Slumped - 9/14/2023 |
View all notes |
Set NEW NOTE alert |
Company Profile |
SEC
News |
Chart |
Request a new note
C
A
S
I |
CLH
-
NYSE
Clean Harbors
Pollution Control
|
$169.54
|
+3.30
1.99% |
$169.75
|
202,601
62.34% of 50 DAV
50 DAV is 325,000
|
$178.33
-4.93%
|
3/10/2023
|
$136.89
|
PP = $136.74
|
|
MB = $143.58
|
Most Recent Note - 9/14/2023 7:04:31 PM
G - Posted a gain today with below-average volume and closed just above its 50 DMA line ($168.95). Reported earnings for the Jun '23 quarter -13% on +3% sales revenues versus the year-ago period, below the +25% minimum earnings guideline (C criteria), raising fundamental concerns.
>>> FEATURED STOCK ARTICLE : Volume Totals Have Been Cooling While Hovering Near High - 8/18/2023 |
View all notes |
Set NEW NOTE alert |
Company Profile |
SEC
News |
Chart |
Request a new note
C
A
S
I |
HUBB
-
NYSE
Hubbell
Electrical-Power/Equipmt
|
$319.57
|
+4.03
1.28% |
$320.43
|
422,090
96.59% of 50 DAV
50 DAV is 437,000
|
$340.06
-6.03%
|
4/25/2023
|
$262.85
|
PP = $257.51
|
|
MB = $270.39
|
Most Recent Note - 9/14/2023 7:05:48 PM
G - Posted a gain with near-average volume and closed just above its 50 DMA line ($319.30). Fundamentals remain strong after Jun '23 earnings rose +45% on +9% sales revenues versus the year-ago period.
>>> FEATURED STOCK ARTICLE : Rebounded Near 50-Day Moving Average Line - 8/24/2023 |
View all notes |
Set NEW NOTE alert |
Company Profile |
SEC
News |
Chart |
Request a new note
C
A
S
I |
Symbol/Exchange
Company Name
Industry Group |
PRICE |
CHANGE
(%Change) |
Day High |
Volume
(% DAV)
(% 50 day avg vol) |
52 Wk Hi
% From Hi |
Featured
Date |
Price
Featured |
Pivot Featured |
|
Max Buy |
ANET
-
NYSE
Arista Networks
Computer-Networking
|
$187.56
|
-0.53
-0.28% |
$190.99
|
1,547,699
57.17% of 50 DAV
50 DAV is 2,707,000
|
$198.70
-5.61%
|
8/1/2023
|
$188.84
|
PP = $178.46
|
|
MB = $187.38
|
Most Recent Note - 9/11/2023 6:33:54 PM
G - Pulled back today with light volume. Remains perched near its all-time high. Fundamentals remain strong.
>>> FEATURED STOCK ARTICLE : Hovering Near High with Volume Totals Cooling - 8/14/2023 |
View all notes |
Set NEW NOTE alert |
Company Profile |
SEC
News |
Chart |
Request a new note
C
A
S
I |
LSCC
-
NASDAQ
Lattice Semiconductor
Elec-Semicondctor Fablss
|
$92.14
|
+2.27
2.53% |
$92.23
|
1,380,742
85.71% of 50 DAV
50 DAV is 1,611,000
|
$98.30
-6.27%
|
6/13/2023
|
$91.73
|
PP = $96.92
|
|
MB = $101.77
|
Most Recent Note - 9/14/2023 7:01:14 PM
G - Posted a gain today with higher but below-average volume and closed above its 50 DMA line ($91.34). Reported Jun '23 quarterly earnings +24% on +18% sales revenues versus the year-ago period, just below the +25% minimum earnings guideline (C criteria).
>>> FEATURED STOCK ARTICLE : Rebound Needed Above 50-Day Moving Average for Lattice - 8/17/2023 |
View all notes |
Set NEW NOTE alert |
Company Profile |
SEC
News |
Chart |
Request a new note
C
A
S
I |
ESQ
-
NASDAQ
Esquire Finl Hldgs
Finance-Commercial Loans
|
$47.32
|
+0.43
0.92% |
$47.44
|
12,725
57.84% of 50 DAV
50 DAV is 22,000
|
$54.03
-12.42%
|
7/14/2023
|
$45.80
|
PP = $48.23
|
|
MB = $50.64
|
Most Recent Note - 9/12/2023 5:34:37 PM
G - Its 50 DMA line ($47.99) has acted as resistance while still consolidating near prior highs in the $47 area. A rebound above the 50 DMA line is needed for its outlook to improve.
>>> FEATURED STOCK ARTICLE : Pullback with Light Volume Testing Important Support Level - 8/15/2023 |
View all notes |
Set NEW NOTE alert |
Company Profile |
SEC
News |
Chart |
Request a new note
C
A
S
I |
MEDP
-
NASDAQ
Medpace Holdings
Medical-Research Eqp/Svc
|
$280.03
|
-1.64
-0.58% |
$282.73
|
278,056
104.14% of 50 DAV
50 DAV is 267,000
|
$282.73
-0.95%
|
7/25/2023
|
$196.32
|
PP = $241.57
|
|
MB = $253.65
|
Most Recent Note - 9/11/2023 6:32:24 PM
G - Posted a solid gain today for a new all-time high. Prior high ($269) defines initial support to watch above its 50 DMA line ($255). Fundamentals remain strong.
>>> FEATURED STOCK ARTICLE : Consolidating Above 50-Day Moving Average - 8/23/2023 |
View all notes |
Set NEW NOTE alert |
Company Profile |
SEC
News |
Chart |
Request a new note
C
A
S
I |
COKE
-
NASDAQ
Coca-Cola Consolidated
Beverages-Non-Alcoholic
|
$660.00
|
-3.00
-0.45% |
$666.43
|
44,608
108.80% of 50 DAV
50 DAV is 41,000
|
$745.53
-11.47%
|
8/3/2023
|
$718.56
|
PP = $694.30
|
|
MB = $729.02
|
Most Recent Note - 9/11/2023 6:29:57 PM
G - Posted a gain today, rebounding above its 50 DMA line ($667) helping its outlook to improve. See the latest FSU analysis for more details and a new annotated graph.
>>> FEATURED STOCK ARTICLE : Rebounded Above 50-Day Moving Average - 9/11/2023 |
View all notes |
Set NEW NOTE alert |
Company Profile |
SEC
News |
Chart |
Request a new note
C
A
S
I |
Symbol/Exchange
Company Name
Industry Group |
PRICE |
CHANGE
(%Change) |
Day High |
Volume
(% DAV)
(% 50 day avg vol) |
52 Wk Hi
% From Hi |
Featured
Date |
Price
Featured |
Pivot Featured |
|
Max Buy |
PLUS
-
NASDAQ
ePlus
Computer-Tech Services
|
$63.43
|
+0.04
0.06% |
$64.30
|
63,906
62.65% of 50 DAV
50 DAV is 102,000
|
$75.90
-16.43%
|
8/8/2023
|
$67.60
|
PP = $62.92
|
|
MB = $66.07
|
Most Recent Note - 9/12/2023 5:31:07 PM
Y - Still consolidating since a noted "breakaway gap" on 8/08/23. Fundamentals remain strong. The recent low and 50 DMA line define important near-term support in the $61 area.See the latest FSU analysis for more details and a new annotated graph.
>>> FEATURED STOCK ARTICLE : Still Consolidating Above 50 DMA Line - 9/12/2023 |
View all notes |
Set NEW NOTE alert |
Company Profile |
SEC
News |
Chart |
Request a new note
C
A
S
I |
|
|
|
THESE ARE NOT BUY RECOMMENDATIONS!
Comments contained in the body of this report are technical
opinions only. The material herein has been obtained
from sources believed to be reliable and accurate, however,
its accuracy and completeness cannot be guaranteed.
This site is not an investment advisor, hence it does
not endorse or recommend any securities or other investments.
Any recommendation contained in this report may not
be suitable for all investors and it is not to be deemed
an offer or solicitation on our part with respect to
the purchase or sale of any securities. All trademarks,
service marks and trade names appearing in this report
are the property of their respective owners, and are
likewise used for identification purposes only.
This report is a service available
only to active Paid Premium Members.
You may opt-out of receiving report notifications
at any time. Questions or comments may be submitted
by writing to Premium Membership Services 665 S.E. 10 Street, Suite 201 Deerfield Beach, FL 33441-5634 or by calling 1-800-965-8307
or 954-785-1121.
|
|
|