You are not logged in.
This means you
CAN ONLY VIEW reports that were published prior to Saturday, April 19, 2025.
You
MUST UPGRADE YOUR MEMBERSHIP if you want to see any current reports.
AFTER MARKET UPDATE - WEDNESDAY, JANUARY 5TH, 2022
Previous After Market Report Next After Market Report >>>
|
|
|
|
DOW |
-392.54 |
36,407.11 |
-1.07% |
|
Volume |
1,031,390,102 |
+9% |
|
Volume |
5,033,240,600 |
-1% |
|
NASDAQ |
-522.54 |
15,100.17 |
-3.34% |
|
Advancers |
583 |
18% |
|
Advancers |
994 |
22% |
|
S&P 500 |
-92.96 |
4,700.58 |
-1.94% |
|
Decliners |
2,682 |
82% |
|
Decliners |
3,448 |
78% |
|
Russell 2000 |
-74.87 |
2,194.00 |
-3.30% |
|
52 Wk Highs |
132 |
|
|
52 Wk Highs |
123 |
|
|
S&P 600 |
-35.22 |
1,390.91 |
-2.47% |
|
52 Wk Lows |
118 |
|
|
52 Wk Lows |
406 |
|
|
 |
Breadth Negative as Major Indices Faced Pressure
Kenneth J. Gruneisen - Passed the CAN SLIM® Master's Exam
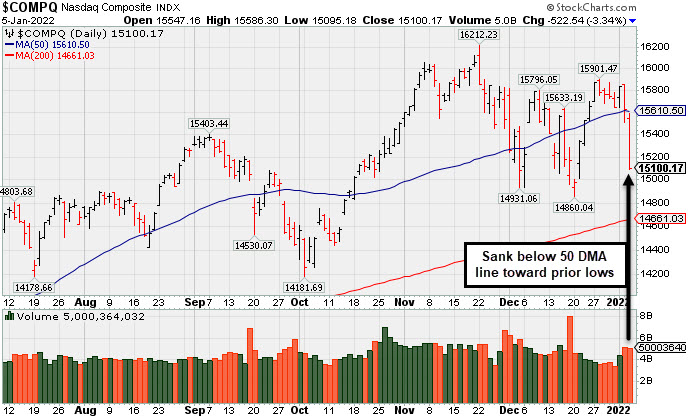
The Dow reversed an earlier gain to slump 392 points from Tuesday’s record closing high, while the S&P 500 retreated 1.9%. The tech-heavy Nasdaq Composite experienced its worst day since February, tumbling 3.3% as a continued backup in Treasury yields dented demand for growth-related shares. The volume totals reported were mixed, higher than the prior session on the NYSE and lighter on the Nasdaq exchange. Breadth was clearly negative as decliners led advancers by more than a 4-1 margin on the NYSE, and by more than 3-1 on the Nasdaq exchange. There were 55 high-ranked companies from the Leaders List that hit new 52-week highs and were listed on the BreakOuts Page, versus the total of 70 on the prior session. New 52-week highs outnumbered new 52-week lows on the NYSE and on the Nasdaq exchange. The market averages (M criteria) have an uptrend that is currently under pressure. New buying efforts are to be carefully made under the fact-based investment system's strict criteria.
 PICTURED: The Nasdaq Composite Index slumped below its 50-day moving average (DMA) line toward prior lows.
U.S. equities finished firmly lower on Wednesday as investors assessed the minutes from the December Federal Reserve (Fed) meeting. The release had perceived hawkish takeaways, with policymakers starting to discuss policy normalization and weighing a rate hike “sooner or at a faster pace” than originally anticipated.
Treasuries weakened, with the yield on the 10-year note jumping four basis points (0.04%) to 1.69%, its highest level since October. The benchmark yield has spiked 18 basis points (0.18%) so far this week. Meanwhile, the more Fed-sensitive two-year note yield breached 0.80% for the first time since March 2020. A robust update on the labor market underscored the growing expectation that the Fed could tighten monetary policy sooner than previously forecasted. A report from ADP showed 807,000 jobs were added in the private sector in December, the most in seven months and nearly double estimates of a 410,000 increase. Investors will now look ahead to the more comprehensive “first Friday” jobs report, which is anticipated to show the U.S. economy added 425,000 nonfarm payrolls.
All 11 S&P 500 sectors closed in negative territory, with Real Estate leading laggards. Information Technology also underperformed, with Microsoft (MSFT -3.84%) falling. Other software makers came under pressure, with salesforce.com Inc. (CRM -8.28%) and Adobe Inc. (ADBE -7.14%) both subjected to Wall Street downgrades. |
 Kenneth J. Gruneisen started out as a licensed stockbroker in August 1987, a couple of months prior to the historic stock market crash that took the Dow Jones Industrial Average down -22.6% in a single day. He has published daily fact-based fundamental and technical analysis on high-ranked stocks online for two decades. Through FACTBASEDINVESTING.COM, Kenneth provides educational articles, news, market commentary, and other information regarding proven investment systems that work in good times and bad.
Comments contained in the body of this report are technical opinions only and are not necessarily those of Gruneisen Growth Corp. The material herein has been obtained from sources believed to be reliable and accurate, however, its accuracy and completeness cannot be guaranteed. Our firm, employees, and customers may effect transactions, including transactions contrary to any recommendation herein, or have positions in the securities mentioned herein or options with respect thereto. Any recommendation contained in this report may not be suitable for all investors and it is not to be deemed an offer or solicitation on our part with respect to the purchase or sale of any securities. |
|
 |
Tech, Financial, Retail, and Commodity-Linked Groups Fell
Kenneth J. Gruneisen - Passed the CAN SLIM® Master's Exam
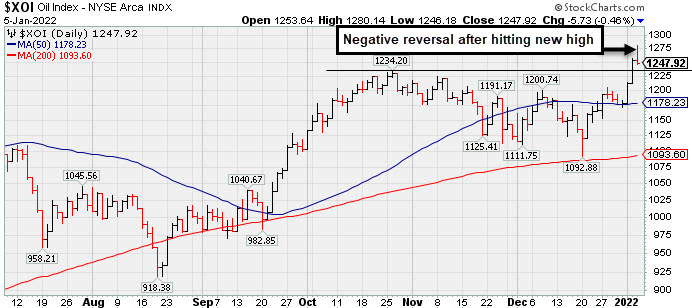
The Broker/Dealer Index ($XBD -2.08%), Bank Index ($BKX -1.08%), and Retail Index ($RLX -1.88%) lost ground. The tech sector saw unanimous losses as the Semiconductor Index ($SOX -3.22%), Biotech Index ($BTK -3.09%), and Networking Index ($NWX -2.52%) each fell. Commodity-linked groups also had a negative bias as the Gold & Silver Index ($XAU -1.92%) outpaced the Oil Services Index ($OSX -1.33%) and Integrated Oil Index ($XOI -0.46%) to the downside.
PICTURED: The Integrated Oil Index ($XOI -0.46%) had a "negative reversal" after hitting a new high. It found support at its 200-day moving average (DMA) line in recent weeks and rallied.
| Oil Services |
$OSX |
57.99 |
-0.78 |
-1.33% |
+9.99% |
| Integrated Oil |
$XOI |
1,247.92 |
-5.73 |
-0.46% |
+5.92% |
| Semiconductor |
$SOX |
3,879.87 |
-129.13 |
-3.22% |
-1.68% |
| Networking |
$NWX |
940.45 |
-24.35 |
-2.52% |
-3.15% |
| Broker/Dealer |
$XBD |
489.16 |
-10.38 |
-2.08% |
+0.47% |
| Retail |
$RLX |
4,150.45 |
-79.64 |
-1.88% |
-1.80% |
| Gold & Silver |
$XAU |
127.66 |
-2.50 |
-1.92% |
-3.61% |
| Bank |
$BKX |
138.77 |
-1.52 |
-1.08% |
+4.95% |
| Biotech |
$BTK |
5,253.77 |
-167.38 |
-3.09% |
-4.80% |
|
|
|
 |
Violation of 50-Day Moving Average Triggered Technical Sell Signal
Kenneth J. Gruneisen - Passed the CAN SLIM® Master's Exam
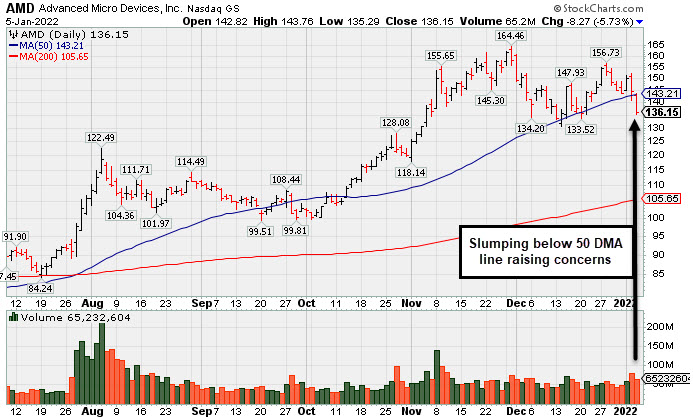
Advanced Micro Devices (AMD -$8.27 or -5.73% to $136.15) suffered a 2nd consecutive big loss today while slumping below its 50-day moving average (DMA) line ($143.21) which recently acted as support. The damaging violation triggered a technical sell signal. Only a prompt rebound above the 50 DMA line would help its outlook improve. The prior low ($130.60 on 12/14/21) defines the next important chart support level to watch. Its current Relative Strength rating of 97 is still well above the 80+ minimum guideline for buy candidates.
Fundamentals remain strong after it reported Sep '21 quarterly earnings +78% on +54% sales revenues versus the year ago period, extending its impressive streak of quarterly comparisons with very strong earnings increases well above the +25% minimum guideline (C criteria) with strong underlying sales revenues growth. Annual earnings growth (A criteria) has been very strong after losses in FY '15 and '16. it has a 99 Earnings Per Share Rating.
AMD was highlighted in yellow with pivot point cited based on its 8/04/21 high plus 10 cents in the 10/27/21 mid-day report (read here). It was last shown in this FSU section on 12/01/21 with an annotated graph under the headline, "AMD Pulling Back After Considerable Rally". AMD traded up +196.8% since highlighted in yellow in the 6/09/20 mid-day report (read here).
AMD hails from the Electronics - Semiconductor Fabless industry which has a Group Relative Strength Rating of 99 (L criteria). It has a large supply of 1.21 billion shares outstanding (S criteria), which makes it less likely to be a quick sprinter. However, the number of top-rated funds owning its shares rose from 1,669 in Jun '19 to 2,920 in Sep '21, a reassuring sign concerning the I criteria. Its current Up/Down Volume Ratio of 0.9 is an unbiased indication its shares have been under slight distributional pressure over the past 50 days. It has a Timeliness Rating of A, a Sponsorship Rating of B, and an Accumulation/Distribution rating of C+. |
|
|
Color Codes Explained :
Y - Better candidates highlighted by our
staff of experts.
G - Previously featured
in past reports as yellow but may no longer be buyable under the
guidelines.
***Last / Change / Volume data in this table is the closing quote data***
Symbol/Exchange
Company Name
Industry Group |
PRICE |
CHANGE
(%Change) |
Day High |
Volume
(% DAV)
(% 50 day avg vol) |
52 Wk Hi
% From Hi |
Featured
Date |
Price
Featured |
Pivot Featured |
|
Max Buy |
 BLDR
-
NYSE
BLDR
-
NYSE
Builders Firstsource Inc
Bldg-Constr Prds/Misc
|
$82.40
|
-3.02
-3.54% |
$86.45
|
3,458,522
131.20% of 50 DAV
50 DAV is 2,636,000
|
$86.48
-4.72%
|
8/12/2021
|
$52.38
|
PP = $54.09
|
|
MB = $56.79
|
Most Recent Note - 1/3/2022 5:23:16 PM
G - Pulled back from its all-time high with today's loss. It is very extended from any sound base. Reported Sep '21 quarterly earnings +308% on +140% sales revenues versus the year ago period. Its 50 DMA line ($71.69) defines near-term support to watch.
>>> FEATURED STOCK ARTICLE : Perched at Record High After +52% Rally in 4 Months - 12/10/2021 |
View all notes |
Set NEW NOTE alert |
Company Profile |
SEC
News |
Chart |
Request a new note
C
A
S
I |
KFRC
-
NASDAQ
Kforce Inc
Comml Svcs-Staffing
|
$74.67
|
-1.07
-1.41% |
$76.17
|
76,152
66.22% of 50 DAV
50 DAV is 115,000
|
$81.47
-8.35%
|
9/10/2021
|
$59.53
|
PP = $64.48
|
|
MB = $67.70
|
 Most Recent Note - 1/5/2022 8:24:56 PM
G - Still consolidating just above its 50 DMA line ($74.30) and above the prior low ($71.05 on 12/14/21) which defines important near-term support to watch. Recently reported Sep '21 quarterly earnings +8% on +10% sales revenues versus the year ago period, below the +25% minimum earnings guideline (C criteria), raising fundamental concerns.
>>> FEATURED STOCK ARTICLE : Consolidating Above its 50-Day Moving Average Line - 12/29/2021 |
View all notes |
Set NEW NOTE alert |
Company Profile |
SEC
News |
Chart |
Request a new note
C
A
S
I |
REGN
-
NASDAQ
Regeneron Pharmaceutical
DRUGS - Biotechnology
|
$595.12
|
-21.70
-3.52% |
$613.65
|
1,100,777
146.97% of 50 DAV
50 DAV is 749,000
|
$686.62
-13.33%
|
12/13/2021
|
$647.95
|
PP = $686.72
|
|
MB = $721.06
|
Most Recent Note - 1/5/2022 8:30:57 PM
G - Color code is changed to green after slumping below its 50 DMA line ($635) and below the prior low with today's loss on higher volume triggering a technical sell signal. A prompt rebound above the 50 DMA line is needed for its outlook to improve.
>>> FEATURED STOCK ARTICLE : Consolidating Near All-Time High With Little Resistance Remaining - 12/13/2021 |
View all notes |
Set NEW NOTE alert |
Company Profile |
SEC
News |
Chart |
Request a new note
C
A
S
I |
LLY
-
NYSE
Eli Lilly & Co
Medical-Diversified
|
$260.65
|
-6.16
-2.31% |
$268.77
|
3,004,081
95.22% of 50 DAV
50 DAV is 3,155,000
|
$283.91
-8.19%
|
12/16/2021
|
$279.28
|
PP = $275.97
|
|
MB = $289.77
|
Most Recent Note - 1/5/2022 8:26:21 PM
Y - Suffered a 5th consecutive loss today testing the recent low ($260) and its 50 DMA line ($260.21). More damaging losses would raise greater concerns and trigger a technical sell signal.
>>> FEATURED STOCK ARTICLE : Eli Lilly & Co Powered to New Highs With Volume - 12/16/2021 |
View all notes |
Set NEW NOTE alert |
Company Profile |
SEC
News |
Chart |
Request a new note
C
A
S
I |
CAMT
-
NASDAQ
Camtek Ltd
ELECTRONICS - Scientific and Technical Instrum
|
$42.74
|
-2.61
-5.76% |
$45.33
|
290,973
107.37% of 50 DAV
50 DAV is 271,000
|
$49.60
-13.83%
|
11/9/2021
|
$45.43
|
PP = $46.11
|
|
MB = $48.42
|
Most Recent Note - 1/5/2022 8:34:59 PM
G - Violated its 50 DMA line ($43.93) with today's 2nd consecutive loss raising concerns. Only a prompt rebound above the 50 DMA line would help its outlook improve.
>>> FEATURED STOCK ARTICLE : Closed Above 50-Day Average After Big Gain With Light Volume - 12/15/2021 |
View all notes |
Set NEW NOTE alert |
Company Profile |
SEC
News |
Chart |
Request a new note
C
A
S
I |
Symbol/Exchange
Company Name
Industry Group |
PRICE |
CHANGE
(%Change) |
Day High |
Volume
(% DAV)
(% 50 day avg vol) |
52 Wk Hi
% From Hi |
Featured
Date |
Price
Featured |
Pivot Featured |
|
Max Buy |
AMD
-
NASDAQ
Advanced Micro Devices
ELECTRONICS - Semiconductor - Broad Line
|
$136.15
|
-8.27
-5.73% |
$143.76
|
65,368,131
109.10% of 50 DAV
50 DAV is 59,916,000
|
$164.46
-17.21%
|
10/27/2021
|
$124.91
|
PP = $122.59
|
|
MB = $128.72
|
Most Recent Note - 1/5/2022 8:14:28 PM
G - Today's 2nd consecutive big loss violated its 50 DMA line ($143.21) triggering a technical sell signal. Prior low ($130.60) defines the next important chart support level to watch. Fundamentals remain strong after it reported Sep '21 quarterly earnings +78% on +54% sales revenues versus the year ago period. See the latest FSU analysis for more details and a new annotated graph.
>>> FEATURED STOCK ARTICLE : Violation of 50-Day Moving Average Triggered Technical Sell Signal - 1/5/2022 |
View all notes |
Set NEW NOTE alert |
Company Profile |
SEC
News |
Chart |
Request a new note
C
A
S
I |
UMC
-
NYSE
United Microelectrnc Adr
ELECTRONICS - Semiconductor - Integrated Cir
|
$11.14
|
-0.37
-3.21% |
$11.58
|
6,647,450
86.75% of 50 DAV
50 DAV is 7,663,000
|
$12.68
-12.15%
|
12/1/2021
|
$12.60
|
PP = $12.72
|
|
MB = $13.36
|
Most Recent Note - 1/4/2022 5:44:47 PM
Y - Recent losses are retesting support near its 50 DMA line ($11.32). More damaging losses would raise concerns. A gain and solid close above the pivot point may help clinch a proper new (or add-on) technical buy signal. Reported Sep '21 quarterly earnings +100% on +30% sales revenues versus the year ago period. See the latest FSU analysis for more details and a new annotated graph.
>>> FEATURED STOCK ARTICLE : Testing Support and Perched Not Far From Prior Highs - 1/4/2022 |
View all notes |
Set NEW NOTE alert |
Company Profile |
SEC
News |
Chart |
Request a new note
C
A
S
I |
ENTG
-
NASDAQ
Entegris Inc
ELECTRONICS - Semiconductor Equipment and Mate
|
$132.09
|
-7.13
-5.12% |
$138.58
|
1,593,954
135.31% of 50 DAV
50 DAV is 1,178,000
|
$158.00
-16.40%
|
8/4/2021
|
$125.33
|
PP = $126.51
|
|
MB = $132.84
|
Most Recent Note - 1/5/2022 8:23:51 PM
G - Slumped further below its 50 DMA line ($144.21) with a big loss today on higher volume. A rebound above the 50 DMA line is needed for its outlook to improve. Fundamentals remain strong after it recently reported Sep '21 quarterly earnings +37% on +20% sales revenues versus the year ago period.
>>> FEATURED STOCK ARTICLE : Still Below 50-Day Moving Average - 1/3/2022 |
View all notes |
Set NEW NOTE alert |
Company Profile |
SEC
News |
Chart |
Request a new note
C
A
S
I |
DHR
-
NYSE
Danaher Corp
Medical-Diversified
|
$305.30
|
-1.96
-0.64% |
$310.96
|
3,722,697
141.98% of 50 DAV
50 DAV is 2,622,000
|
$333.96
-8.58%
|
12/16/2021
|
$321.36
|
PP = $334.06
|
|
MB = $350.76
|
Most Recent Note - 1/3/2022 5:28:12 PM
Y - Volume was higher as it pulled back today testing its 50 DMA line ($313.29) after it was perched within striking distance of its 52-week high. Highlighted in yellow with pivot point cited base on its 9/10/21 high plus 10 cents in the 12/16/21 mid-day report. Subsequent gains above the pivot point with at least +40% above average volume may trigger a technical buy signal. Fundamentals remain strong.
>>> FEATURED STOCK ARTICLE : Consolidating Near Prior Highs Above 50-Day Moving Average - 12/17/2021 |
View all notes |
Set NEW NOTE alert |
Company Profile |
SEC
News |
Chart |
Request a new note
C
A
S
I |
SKY
-
NYSE
Skyline Champion Corp
Bldg-Mobile/Mfg andamp; RV
|
$73.58
|
-5.65
-7.13% |
$80.26
|
543,954
107.71% of 50 DAV
50 DAV is 505,000
|
$85.92
-14.36%
|
11/3/2021
|
$72.19
|
PP = $66.92
|
|
MB = $70.27
|
Most Recent Note - 1/5/2022 8:17:57 PM
G - Big loss today on higher (near average) volume violated its 50 DMA line ($76) again raising concerns. Prior low ($68.54) defines the next important support level. Fundamentals remain strong.
>>> FEATURED STOCK ARTICLE : Pulling Back From All-Time High After Recent Rally - 12/14/2021 |
View all notes |
Set NEW NOTE alert |
Company Profile |
SEC
News |
Chart |
Request a new note
C
A
S
I |
Symbol/Exchange
Company Name
Industry Group |
PRICE |
CHANGE
(%Change) |
Day High |
Volume
(% DAV)
(% 50 day avg vol) |
52 Wk Hi
% From Hi |
Featured
Date |
Price
Featured |
Pivot Featured |
|
Max Buy |
DHI
-
NYSE
D R Horton Inc
MATERIALS and CONSTRUCTION - Residential Construction
|
$103.07
|
-2.65
-2.51% |
$108.10
|
3,506,072
123.37% of 50 DAV
50 DAV is 2,842,000
|
$110.45
-6.68%
|
12/6/2021
|
$104.40
|
PP = $106.99
|
|
MB = $112.34
|
Most Recent Note - 1/3/2022 5:24:46 PM
Y - Volume was higher (near average) behind today's loss while perched near its all-time high. Showed stalling action since highlighted in yellow with pivot point cited based on its 5/10/21 high plus 10 cents in the 12/06/21 mid-day report. Reported Sep '21 earnings +68% on +27% sales revenues versus the year-ago period, its 8th strong quarterly comparison above the +25% minimum guideline (C criteria). Annual earnings growth (A criteria) has been strong.
>>> FEATURED STOCK ARTICLE : Builder Built a Solid Base And Challenged Prior High - 12/6/2021 |
View all notes |
Set NEW NOTE alert |
Company Profile |
SEC
News |
Chart |
Request a new note
C
A
S
I |
TITN
-
NASDAQ
Titan Machinery Inc
SPECIALTY RETAIL
|
$33.90
|
-1.49
-4.21% |
$35.80
|
118,198
66.03% of 50 DAV
50 DAV is 179,000
|
$38.58
-12.13%
|
11/23/2021
|
$36.22
|
PP = $35.34
|
|
MB = $37.11
|
Most Recent Note - 1/5/2022 8:21:37 PM
G - Pulled back today with lighter volume, consolidating above its 50 DMA line ($32.52). It has not formed a sound base and faces resistance due to overhead supply up to the $38 level. Reported Oct '21 quarterly earnings +81% on +26% sales revenues over the year ago period, its 4th strong quarterly comparison.
>>> FEATURED STOCK ARTICLE : Recently Found Support at 50-Day Moving Average Line - 12/31/2021 |
View all notes |
Set NEW NOTE alert |
Company Profile |
SEC
News |
Chart |
Request a new note
C
A
S
I |
CLFD
-
NASDAQ
Clearfield Inc
TELECOMMUNICATIONS - Cables / Satalite Equipment
|
$77.61
|
-3.39
-4.19% |
$81.15
|
267,171
169.10% of 50 DAV
50 DAV is 158,000
|
$86.71
-10.49%
|
12/16/2021
|
$72.76
|
PP = $72.10
|
|
MB = $75.71
|
Most Recent Note - 1/5/2022 8:32:45 PM
G - Suffered another volume-driven loss today. Very extended from the prior base, and the prior high ($72) defines initial support to watch above its 50 DMA line ($67.85). Reported Sep '21 quarterly earnings +141% on +66% sales revenues above the year ago period.
>>> FEATURED STOCK ARTICLE : Negative Reversal After Hitting a New All Time High - 12/30/2021 |
View all notes |
Set NEW NOTE alert |
Company Profile |
SEC
News |
Chart |
Request a new note
C
A
S
I |
ODFL
-
NASDAQ
Old Dominion Fght Line
TRANSPORTATION - Trucking
|
$342.28
|
-12.70
-3.58% |
$354.94
|
891,585
145.21% of 50 DAV
50 DAV is 614,000
|
$373.58
-8.38%
|
12/7/2021
|
$365.61
|
PP = $364.17
|
|
MB = $382.38
|
Most Recent Note - 1/5/2022 8:28:24 PM
G - Color code is changed to green after slumping below its 50 DMA line ($351) with another volume-driven loss. A prompt rebound above the 50 DMA line is needed for its outlook to improve. Faces very little near term resistance up to the $373 level..
>>> FEATURED STOCK ARTICLE : Perched at All Time High After Tight Consolidation Several Weeks - 12/7/2021 |
View all notes |
Set NEW NOTE alert |
Company Profile |
SEC
News |
Chart |
Request a new note
C
A
S
I |
POOL
-
NASDAQ
Pool Corp
WHOLESALE - Basic Materials Wholesale
|
$529.38
|
-20.51
-3.73% |
$551.76
|
278,504
115.08% of 50 DAV
50 DAV is 242,000
|
$582.27
-9.08%
|
12/27/2021
|
$555.44
|
PP = $582.37
|
|
MB = $611.49
|
Most Recent Note - 1/3/2022 5:32:06 PM
Y - Suffered a loss today testing its 50 DMA line ($546.49). Color code was changed to yellow with new pivot point cited based on its 11/19/21 high plus 10 cents. Subsequent gains above the pivot point backed by at least +40% above average volume may trigger a new technical buy signal. Reported strong Sep '21 quarterly results.
>>> FEATURED STOCK ARTICLE : Forming New Base After Finding Prompt Support at 50 DMA - 12/27/2021 |
View all notes |
Set NEW NOTE alert |
Company Profile |
SEC
News |
Chart |
Request a new note
C
A
S
I |
Symbol/Exchange
Company Name
Industry Group |
PRICE |
CHANGE
(%Change) |
Day High |
Volume
(% DAV)
(% 50 day avg vol) |
52 Wk Hi
% From Hi |
Featured
Date |
Price
Featured |
Pivot Featured |
|
Max Buy |
SMPL
-
NASDAQ
Simply Good Foods Co
Food-Confectionery
|
$38.89
|
-3.46
-8.17% |
$42.98
|
1,621,488
364.38% of 50 DAV
50 DAV is 445,000
|
$43.17
-9.91%
|
12/22/2021
|
$40.04
|
PP = $41.45
|
|
MB = $43.52
|
Most Recent Note - 1/5/2022 8:20:16 PM
G - Color code is changed to green after its abrupt retreat today with above average volume violated its 50 DMA line triggering a technical sell signal. Reported Nov '21 quarterly earnings +48% on +22% sales revenues versus the year ago period. A prompt rebound above its 50 DMA line ($39.28) is needed for its outlook to improve.
>>> FEATURED STOCK ARTICLE : Formed New 5-Week Base and Perched Near Pivot Point - 12/22/2021 |
View all notes |
Set NEW NOTE alert |
Company Profile |
SEC
News |
Chart |
Request a new note
C
A
S
I |
AVTR
-
NYSE
Avantor Inc
Medical-Research Eqp/Svc
|
$37.88
|
-1.29
-3.29% |
$39.24
|
3,919,768
103.36% of 50 DAV
50 DAV is 3,792,400
|
$44.37
-14.63%
|
12/27/2021
|
$41.96
|
PP = $44.47
|
|
MB = $46.69
|
Most Recent Note - 1/3/2022 5:21:37 PM
Y - Pulled back today with higher volume, consolidating above its 50 DMA line ($39.47), and it faces overhead supply up to the $44 level. Subsequent gains above the pivot point backed by at least +40% above average volume may trigger a new technical buy signal. Prior lows in the high $36 area define important near-term support. Reported Sep '21 quarterly earnings +46% above the year ago period.
>>> FEATURED STOCK ARTICLE : Rebounding With Volume-Driven Gains - 12/21/2021 |
View all notes |
Set NEW NOTE alert |
Company Profile |
SEC
News |
Chart |
Request a new note
C
A
S
I |
|
|
|
THESE ARE NOT BUY RECOMMENDATIONS!
Comments contained in the body of this report are technical
opinions only. The material herein has been obtained
from sources believed to be reliable and accurate, however,
its accuracy and completeness cannot be guaranteed.
This site is not an investment advisor, hence it does
not endorse or recommend any securities or other investments.
Any recommendation contained in this report may not
be suitable for all investors and it is not to be deemed
an offer or solicitation on our part with respect to
the purchase or sale of any securities. All trademarks,
service marks and trade names appearing in this report
are the property of their respective owners, and are
likewise used for identification purposes only.
This report is a service available
only to active Paid Premium Members.
You may opt-out of receiving report notifications
at any time. Questions or comments may be submitted
by writing to Premium Membership Services 665 S.E. 10 Street, Suite 201 Deerfield Beach, FL 33441-5634 or by calling 1-800-965-8307
or 954-785-1121.
|
|
|