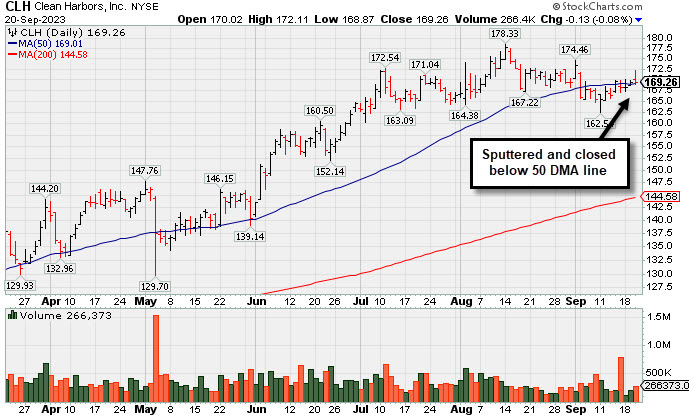
Enduring Distributional Pressure Near 50-Day Moving Average - Wednesday, September 20, 2023
Clean Harbors Inc (CLH -$0.13 or -0.08% to $169.26) erased an early gain today and closed near the session low and near its 50-day moving average (DMA) line ($169). Recently it reported earnings for the Jun '23 quarter -13% on +3% sales revenues versus the year-ago period, below the +25% minimum earnings guideline (C criteria), raising fundamental concerns while well below the +25% minimum earnings guideline (C criteria). CLH has seen its Earnings Per Share Rating slump to 94 from 99. Prior quarters showed a strong earnings track record with earnings above the +25% minimum guideline (C criteria). Annual earnings (A criteria) growth has been strong and steady.
CLH was last shown in this FSU section on 8/18/23 with an annotated graph under the headline, "Volume Totals Have Been Cooling While Hovering Near High". It was highlighted in yellow in the 3/10/23 mid-day report (read here).
There are only 54.1 million shares outstanding (S criteria), which can contribute to greater price volatility in the event of institutional buying or selling. The number of top-rated funds owning its shares rose from 590 in Sep '21 to 781 in Jun '23, a reassuring sign concerning the I criteria. The current Up/Down Volume Ratio of 0.8 is an unbiased indication its shares have been under distributional pressure over the past 50 days. It has a Timeliness Rating of B , a Sponsorship Rating of C, and an Accumulation Distribution Rating of D.
Chart courtesy of www.stockcharts.com
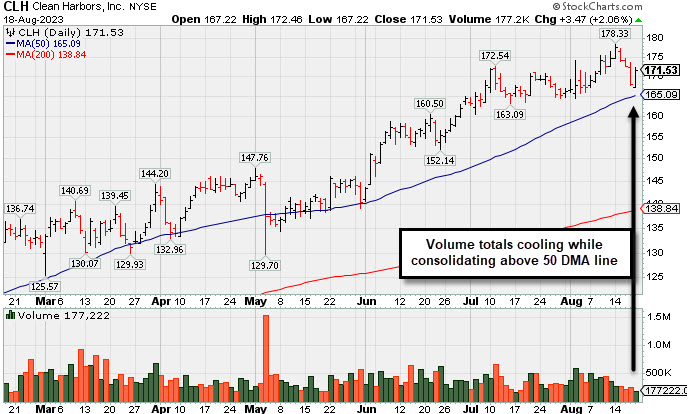
Volume Totals Have Been Cooling While Hovering Near High - Friday, August 18, 2023
Clean Harbors Inc (CLH +$3.47 or +2.06% to $171.53) has seen volume totals cooling while consolidating near its all-time high. Its 50-day moving average (DMA) line ($165) defines important near-term support to watch on pullbacks. Recentlyu reported earnings for the Jun '23 quarter -13% on +3% sales revenues versus the year-ago period, below the +25% minimum earnings guideline (C criteria), raising fundamental concerns. CLH has seen its Earnings Per Share Rating slump to 94 from 99. Prior quarters showed a strong earnings track record with earnings above the +25% minimum guideline (C criteria). Annual earnings (A criteria) growth has been strong and steady.
CLH was last shown in this FSU section on 7/18/23 with an annotated graph under the headline, "Negative Reversal at High After +26% Rally in 4 Months". It was highlighted in yellow in the 3/10/23 mid-day report (read here).
There are only 54.1 million shares outstanding (S criteria), which can contribute to greater price volatility in the event of institutional buying or selling. The number of top-rated funds owning its shares rose from 590 in Sep '21 to 774 in Jun '23, a reassuring sign concerning the I criteria. The current Up/Down Volume Ratio of 1.3 is an unbiased indication its shares have been under accumulation over the past 50 days. It has a Timeliness Rating of B , a Sponsorship Rating of C, and an Accumulation Distribution Rating of B.
Chart courtesy of www.stockcharts.com
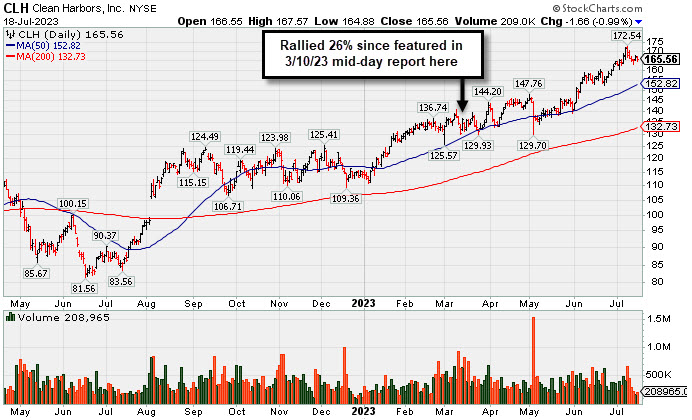
Negative Reversal at High After +26% Rally in 4 Months - Tuesday, July 18, 2023
Clean Harbors Inc (CLH -$1.66 or -0.99% to $165.56) has seen volume totals cooling while consolidating after a noted "negative reversal" on 7/11/23 after touching a new all-time high. It is extended from any sound base. Its 50-day moving average (DMA) line ($152.82) defines important near-term support to watch on pullbacks. Fundamentals remain strong. It is due to report Jun '23 quarterly results on 8/02/23.
CLH was last shown in this FSU section on 6/15/23 with an annotated graph under the headline, "Extended From Any Sound Base and Hovering Near High". It has rallied as much as +26% since highlighted in yellow in the 3/10/23 mid-day report (read here).
CLH has an Earnings Per Share Rating of 99. It reported Mar '23 quarterly earnings +64% on +12% sales revenues versus the year-ago period. Prior quarters showed a strong earnings track record with earnings above the +25% minimum guideline (C criteria). Annual earnings (A criteria) growth has been strong and steady.
There are only 54.1 million shares outstanding (S criteria), which can contribute to greater price volatility in the event of institutional buying or selling. The number of top-rated funds owning its shares rose from 590 in Sep '21 to 773 in Jun '23, a reassuring sign concerning the I criteria. The current Up/Down Volume Ratio of 1.5 is an unbiased indication its shares have been under accumulation over the past 50 days. It has a Timeliness Rating of A , a Sponsorship Rating of C, and an Accumulation Distribution Rating of C+.
Chart courtesy of www.stockcharts.com
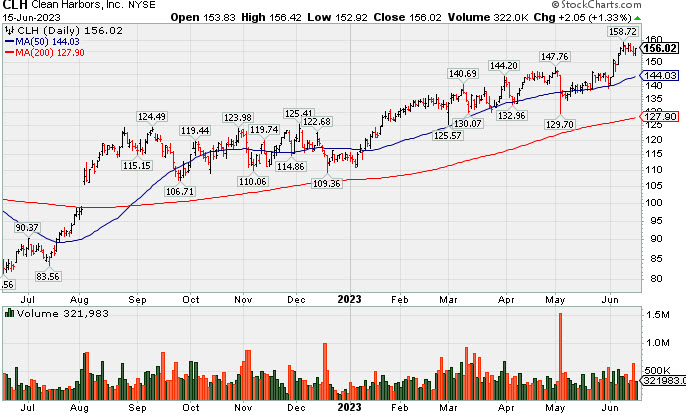
Extended From Any Sound Base and Hovering Near High - Thursday, June 15, 2023
Clean Harbors Inc (CLH +$2.05 or +1.33% to $156.02) is hovering near its all-time high, extended from any sound base. Its 50-day moving average (DMA) line ($144) defines near-term support to watch on pullbacks.
CLH was highlighted in yellow in the 3/10/23 mid-day report (read here). It was last shown in this FSU section on 5/10/23 with an annotated graph under the headline, "Showed Resilience Near 50-Day Moving Average Following Sell-Off".
CLH has an Earnings Per Share Rating of 99. It reported Mar '23 quarterly earnings +64% on +12% sales revenues versus the year-ago period. Prior quarters showed a strong earnings track record with earnings above the +25% minimum guideline (C criteria). Annual earnings (A criteria) growth has been strong and steady.
There are only 54.1 million shares outstanding (S criteria), which can contribute to greater price volatility in the event of institutional buying or selling. The number of top-rated funds owning its shares rose from 590 in Sep '21 to 749 in Mar '23, a reassuring sign concerning the I criteria. The current Up/Down Volume Ratio of 1.0 is an unbiased indication its shares have been neutral concerning accumulation/distribution over the past 50 days. It has a Timeliness Rating of A , a Sponsorship Rating of C, abd an Accumulation Distribution Rating of B-.
Chart courtesy of www.stockcharts.com
| Symbol/Exchange Company Name Industry Group | PRICE | CHANGE | Day High | Volume (% DAV) (% 50 day avg vol) | 52 Wk Hi | Featured Date | Price Featured | Pivot Featured |
| Max Buy | ||||||||
Graphic Packaging Paper and Paper Products | $26.17 | +0.35 1.36% | $26.22 | 4,413,517 50 DAV is 3,056,000 | $27.56 -5.04% | 10/25/2022 | $22.75 | PP = $24.17 |
| MB = $25.38 | ||||||||
| Most Recent Note - 6/14/2023 12:00:16 PM G - Slumping below its prior high in the $26 area with today's loss. There was a "negative reversal" on the prior session for a loss with heavy volume after hitting new all-time highs with 8 consecutive gains. It did not form a sound new base of sufficient length but quickly recovered after testing its 4/27/23 low. Reported Mar '23 quarterly earnings +60% on +9% sales revenues versus the year-ago period. >>> FEATURED STOCK ARTICLE : Graphic Packaging Hits New High With 6th Consecutive Gain - 6/8/2023 | View all notes | Set NEW NOTE alert | Company Profile | SEC News | Chart | Request a new note | ||||||||
Sterling Infrastructure Bldg-Heavy Construction | $52.97 | +0.72 1.38% | $52.97 | 174,387 50 DAV is 262,000 | $54.44 -2.70% | 12/14/2022 | $32.41 | PP = $33.72 |
| MB = $35.41 | ||||||||
| Most Recent Note - 6/13/2023 5:17:30 PM G - Hit yet another new all-time high today but ended near the session low. It is very extended from any sound base. Mar ''23 quarterly earnings were below the +25% minimum guideline (C criteria) raising fundamental concerns. >>> FEATURED STOCK ARTICLE : Impressive Streak of Gains for New Highs - 6/7/2023 | View all notes | Set NEW NOTE alert | Company Profile | SEC News | Chart | Request a new note | ||||||||
Comfort Systems USA Bldg-A/C and Heating Prds | $162.65 | +2.27 1.42% | $163.61 | 353,919 50 DAV is 276,000 | $162.75 -0.06% | 4/27/2023 | $148.85 | PP = $152.23 |
| MB = $159.84 | ||||||||
| Most Recent Note - 6/12/2023 6:08:15 PM G - Color code is changed to green after hitting a new all-time high and closing above its "max buy" level with today''s big gain backed by +19% above average volume. No resistance remains due to overhead supply. >>> FEATURED STOCK ARTICLE : Churning Action While Recently Hovering Near All-Time High - 5/12/2023 | View all notes | Set NEW NOTE alert | Company Profile | SEC News | Chart | Request a new note | ||||||||
Coca-Cola Femsa ADR Beverages-Non-Alcoholic | $88.34 | -0.26 -0.29% | $88.93 | 141,013 50 DAV is 184,000 | $91.23 -3.17% | 6/9/2023 | $88.61 | PP = $91.33 |
| MB = $95.90 | ||||||||
| Most Recent Note - 6/14/2023 4:26:42 PM Y - Perched within striking distance of its 52-week high. Found support near its 50 DMA line ($85.63) during its recent consolidation. Subsequent gains above the pivot point backed by at least +40% above average volume may trigger a technical buy signal. Fundamentals remain strong. >>> FEATURED STOCK ARTICLE : Coca-Cola Femsa Posts 7th Consecutive Gain - 6/9/2023 | View all notes | Set NEW NOTE alert | Company Profile | SEC News | Chart | Request a new note | ||||||||
Clean Harbors Pollution Control | $156.02 | +2.05 1.33% | $156.42 | 322,045 50 DAV is 377,000 | $158.72 -1.70% | 3/10/2023 | $136.89 | PP = $136.74 |
| MB = $143.58 | ||||||||
G - Hovering near its all-time high, extended from any sound base. Its 50 DMA line ($144) defines near-term support to watch on pullbacks. Fundamentals remain strong. See the latest FSU analysis for more details and a new annotated graph. >>> FEATURED STOCK ARTICLE : Extended From Any Sound Base and Hovering Near High - 6/15/2023 | View all notes | Set NEW NOTE alert | Company Profile | SEC News | Chart | Request a new note | ||||||||
| Symbol/Exchange Company Name Industry Group | PRICE | CHANGE | Day High | Volume (% DAV) (% 50 day avg vol) | 52 Wk Hi | Featured Date | Price Featured | Pivot Featured |
| Max Buy | ||||||||
SPS Commerce Comp Sftwr-Spec Enterprs | $182.02 | +2.60 1.45% | $182.22 | 350,333 50 DAV is 151,000 | $180.50 0.84% | 4/24/2023 | $150.01 | PP = $157.56 |
| MB = $165.44 | ||||||||
G - Inching to yet another new 52-week high with today's 11th gain in the span of 12 sessions, getting very extended from any sound base. Reported Mar '23 quarterly earnings +22% on +20% versus the year-ago period, below the +25% minimum earnings guideline (C criteria) raising some fundamental concerns. >>> FEATURED STOCK ARTICLE : Pulled Back After Quietly Wedging to New Highs - 5/31/2023 | View all notes | Set NEW NOTE alert | Company Profile | SEC News | Chart | Request a new note | ||||||||
Hubbell Electrical-Power/Equipmt | $321.02 | +5.57 1.77% | $321.82 | 472,132 50 DAV is 403,000 | $316.57 1.41% | 4/25/2023 | $262.85 | PP = $257.51 |
| MB = $270.39 | ||||||||
| Most Recent Note - 6/13/2023 5:15:56 PM G - Hit yet another new all-time high with today''s 6th consecutive gain, getting more extended from the prior base. Prior highs in the $263 area define initial support to watch on pullbacks. Fundamentals remain strong. >>> FEATURED STOCK ARTICLE : Extended From Prior Base and Perched Near High - 6/1/2023 | View all notes | Set NEW NOTE alert | Company Profile | SEC News | Chart | Request a new note | ||||||||
NVR Bldg-Resident/Comml | $5,944.96 | +58.39 0.99% | $5,961.14 | 21,221 50 DAV is 23,000 | $5,986.96 -0.70% | 4/25/2023 | $5,882.18 | PP = $5,978.25 |
| MB = $6,277.16 | ||||||||
| Most Recent Note - 6/13/2023 5:14:42 PM G - Posted a 4th consecutive gain today with below-average volume. Its 50 DMA line ($5,747) defines near-term support above the recent low ($5,520 on 6/01/23). Reported Mar ''23 quarterly earnings -14% on -3% sales revenues versus the year-ago period, below the +25% minimum earnings guideline (C criteria) raising fundamental concerns, and its color code was changed to green. Prior quarterly comparisons were well above the +25% minimum earnings guideline (C criteria). Annual earnings (A criteria) growth has been very strong. >>> FEATURED STOCK ARTICLE : Rebounded Above 50 Day Average With Light Volume Gains - 6/6/2023 | View all notes | Set NEW NOTE alert | Company Profile | SEC News | Chart | Request a new note | ||||||||
PulteGroup Bldg-Resident/Comml | $73.96 | +0.71 0.97% | $74.51 | 2,468,874 50 DAV is 2,962,000 | $74.53 -0.76% | 4/25/2023 | $65.17 | PP = $64.01 |
| MB = $67.21 | ||||||||
| Most Recent Note - 6/12/2023 6:12:42 PM G - Hit yet another new high with today''s 2nd consecutive gain backed by below average volume, getting more extended from any sound base. Reported earnings +28% for the Mar ''23 quarter versus the year-ago period. Important support to watch is defined by its 50 DMA line ($65) and recent low. >>> FEATURED STOCK ARTICLE : Rebounded Above "Max Buy" Level Toward Recent High - 6/2/2023 | View all notes | Set NEW NOTE alert | Company Profile | SEC News | Chart | Request a new note | ||||||||
Coca-Cola Consolidated Beverages-Non-Alcoholic | $640.82 | -6.07 -0.94% | $652.23 | 35,052 50 DAV is 37,000 | $694.20 -7.69% | 5/4/2023 | $646.66 | PP = $656.21 |
| MB = $689.02 | ||||||||
| Most Recent Note - 6/14/2023 4:54:01 PM Y - Pulled back below its pivot point with today''s 4th consecutive volume-driven loss. Recent lows in the $625 area define important near-term support above its 50 DMA line. Fundamentals remain strong. See the latest FSU analysis for more details and a new annotated graph. >>> FEATURED STOCK ARTICLE : Fell Below Pivot Point With Recent Volume-Driven Losses - 6/14/2023 | View all notes | Set NEW NOTE alert | Company Profile | SEC News | Chart | Request a new note | ||||||||
| Symbol/Exchange Company Name Industry Group | PRICE | CHANGE | Day High | Volume (% DAV) (% 50 day avg vol) | 52 Wk Hi | Featured Date | Price Featured | Pivot Featured |
| Max Buy | ||||||||
Amphastar Pharm Medical-Biomed/Biotech | $52.23 | +4.29 8.95% | $52.85 | 1,056,139 50 DAV is 415,000 | $48.39 7.94% | 5/15/2023 | $43.56 | PP = $44.15 |
| MB = $46.36 | ||||||||
G - Hitting another new high with today's big gain backed by above average volume, getting very extended from any sound base. Prior highs in the $44 area define initial support to watch above its 50 DMA line ($42) on pullbacks. Fundamentals remain strong. >>> FEATURED STOCK ARTICLE : Weak Finish After Early Gain When Perched Near All-Time High - 5/15/2023 | View all notes | Set NEW NOTE alert | Company Profile | SEC News | Chart | Request a new note | ||||||||
Arista Networks Computer-Networking | $163.47 | -5.61 -3.32% | $164.32 | 6,493,030 50 DAV is 3,233,000 | $178.36 -8.35% | 5/30/2023 | $176.35 | PP = $171.54 |
| MB = $180.12 | ||||||||
Y - Gapped down today for a loss with above average volume raising concerns. Stalled after recent gains triggered a technical buy signal. Its 50 DMA line ($154) defines important near-term support to watch. Fundamentals remain strong. >>> FEATURED STOCK ARTICLE : Rebounding Near Recent High With 3 Consecutive Gains - 6/12/2023 | View all notes | Set NEW NOTE alert | Company Profile | SEC News | Chart | Request a new note | ||||||||
Palo Alto Networks Computer Sftwr-Security | $243.80 | +5.24 2.20% | $244.86 | 6,476,768 50 DAV is 4,524,000 | $239.63 1.74% | 6/5/2023 | $228.35 | PP = $213.73 |
| MB = $224.42 | ||||||||
| Most Recent Note - 6/14/2023 4:56:30 PM G - Posted a 3rd consecutive gain today backed by +27% above average volume hitting a new all-time high and its color code is changed to green after rising above its "max buy" level. The prior high ($213) defines initial support to watch. Fundamentals remain strong. >>> FEATURED STOCK ARTICLE : Palo Alto Powers to New Highs Again - 6/5/2023 | View all notes | Set NEW NOTE alert | Company Profile | SEC News | Chart | Request a new note | ||||||||
Lattice Semiconductor Elec-Semicondctor Fablss | $89.65 | -2.42 -2.63% | $91.57 | 1,630,628 50 DAV is 2,417,000 | $96.82 -7.41% | 6/13/2023 | $91.73 | PP = $96.92 |
| MB = $101.77 | ||||||||
| Most Recent Note - 6/13/2023 12:39:52 PM Y - Color code is changed to yellow with pivot point cited based on its 3/23/23 high plus 10 cents. Gapped up today approaching prior highs after rebounding above its 50 DMA line ($85.23) on the prior session with a volume-driven gain. Subsequent gains above the pivot point backed by at least +40% above average volume may trigger a technical buy signal. Reported Mar '23 quarterly earnings +38% on +22% sales revenues versus the year-ago period, its 9th consecutive strong quarterly comparison above the +25% minimum earnings guideline (C criteria). Annual earnings history (A criteria) has been strong. >>> FEATURED STOCK ARTICLE : Lattice Posts Volume-Driven Gains Approaching Prior High - 6/13/2023 | View all notes | Set NEW NOTE alert | Company Profile | SEC News | Chart | Request a new note | ||||||||
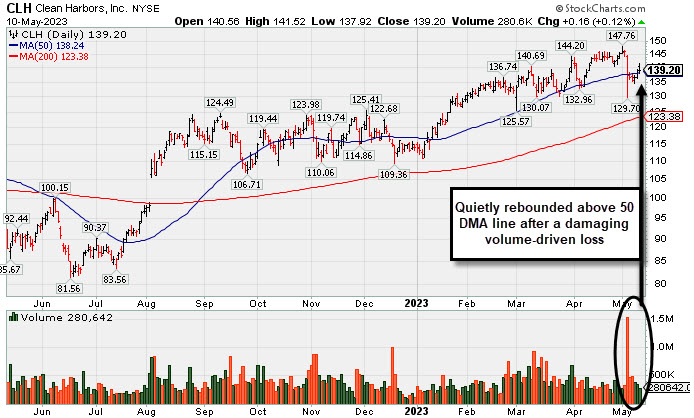
Showed Resilience Near 50-Day Moving Average Following Sell-Off - Wednesday, May 10, 2023
Clean Harbors Inc (CLH +$0.16 or +0.12% to $139.20) posted a 3rd consecutive gain with below-average volume today. It found support near its 50-day moving average (DMA) line ($138.24) after a big loss last week triggered a technical sell signal. More damaging losses would raise greater concerns. CLH reported Mar '23 quarterly earnings +64% on +12% sales revenues versus the year-ago period. Fundamentals remain strong.
CLH was highlighted in yellow in the 3/10/23 mid-day report (read here) as it was noted that a valid secondary buy point exists up to 5% above the recent high following a pullback to support at the 10 WMA line after an earlier breakout. It was last shown in this FSU section on 4/19/23 with an annotated graph under the headline, "Wedged to a New High Close Above 'Max Buy' Level".
CLH has an Earnings Per Share Rating of 99. It reported Dec '22 quarterly earnings +62% on +14% sales revenues versus the year ago period. Prior quarters showed a strong earnings track record with earnings above the +25% minimum guideline (C criteria). Annual earnings (A criteria) growth has been strong and steady.
There are only 54.1 million shares outstanding (S criteria), which can contribute to greater price volatility in the event of institutional buying or selling. The number of top-rated funds owning its shares rose from 590 in Sep '21 to 742 in Mar '23, a reassuring sign concerning the I criteria. The current Up/Down Volume Ratio of 0.9 is an unbiased indication its shares have been neutral concerning accumulation/distribution over the past 50 days. It has a Timeliness Rating of A , a Sponsorship Rating of C, abd an Accumulation Distribution Rating of C+.
Chart courtesy of www.stockcharts.com
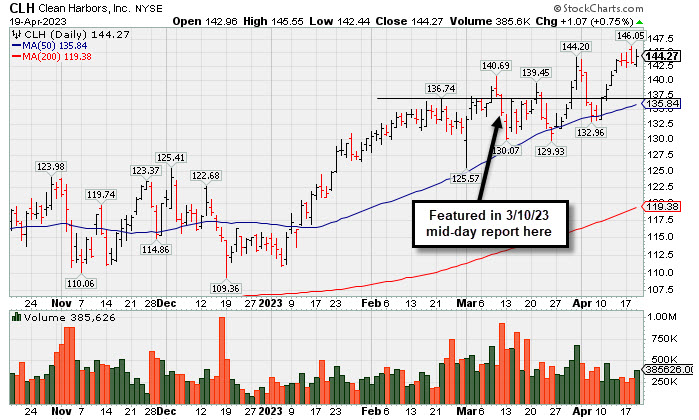
Wedged to a New High Close Above "Max Buy" Level - Wednesday, April 19, 2023
Clean Harbors Inc (CLH +$0.80 or +0.56% to $144.00) posted a gain with near-average volume today for a best-ever close. Its color code was changed to gren after wedging above its "max buy" level. It found prompt support near its 50-day moving average (DMA) line ($135.84) during recent consolidations. Below that important short-term average, the recent low ($129.93 on 3/24/23) defines the next important support where a violation would raise concerns and trigger a more worrisome technical sell signal. Fundamentals remain strong.
CLH was highlighted in yellow in the 3/10/23 mid-day report (read here) as it was noted that a valid secondary buy point exists up to 5% above the recent high following a pullback to support at the 10 WMA line after an earlier breakout. It was last shown in this FSU section on 3/29/23 with an annotated graph under the headline, "Finding Support Recently at 50-Day Moving Average Line".
CLH has an Earnings Per Share Rating of 99. It reported Dec '22 quarterly earnings +62% on +14% sales revenues versus the year ago period. Prior quarters showed a strong earnings track record with earnings above the +25% minimum guideline (C criteria). Annual earnings (A criteria) growth has been strong and steady.
There are only 54.1 million shares outstanding (S criteria), which can contribute to greater price volatility in the event of institutional buying or selling. The number of top-rated funds owning its shares rose from 590 in Sep '21 to 724 in Mar '23, a reassuring sign concerning the I criteria. The current Up/Down Volume Ratio of 1.o is an unbiased indication its shares have been neutral concerning accumulation/distribution over the past 50 days. It has a Timeliness Rating of A , a Sponsorship Rating of C, abd an Accumulation Distribution Rating of B.
Chart courtesy of www.stockcharts.com
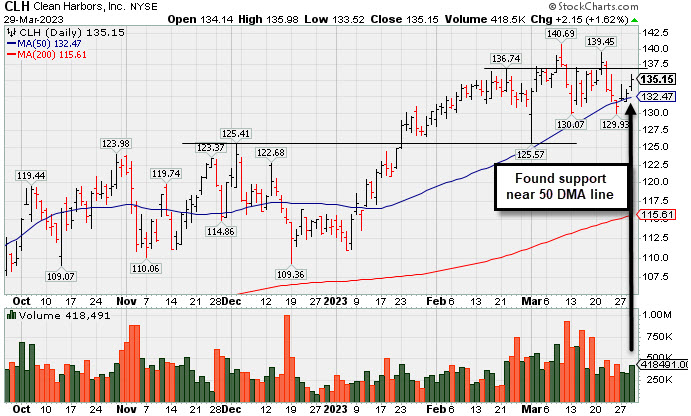
Finding Support Recently at 50-Day Moving Average Line - Wednesday, March 29, 2023
Clean Harbors Inc (CLH +$2.15 or +1.62% to $135.15) posted a 3rd consecutive gain today with average volume, finding prompt support near its 50-day moving average (DMA) line ($132.47). More damaging losses below the 50 DMA line and recent low ($129.93 on 3/24/23) would raise concerns and trigger technical sell signals. Fundamentals remain strong.
CLH was highlighted in yellow in the 3/10/23 mid-day report (read here) as it was noted that a valid secondary buy point exists up to 5% above the recent high following a pullback to support at the 10 WMA line after an earlier breakout. It was shown in greater detail that evening with an annotated graph under the headline, "Pullback to Support Marked Secondary Buy Point; Market Concerns Rose".
CLH has an Earnings Per Share Rating of 99. It reported Dec '22 quarterly earnings +62% on +14% sales revenues versus the year ago period. Volume and volatility often increase near earnings news. Prior quarters showed a strong earnings track record with earnings above the +25% minimum guideline (C criteria). Annual earnings (A criteria) growth has been strong and steady.
There are only 54.1 million shares outstanding (S criteria), which can contribute to greater price volatility in the event of institutional buying or selling. The number of top-rated funds owning its shares rose from 590 in Sep '21 to 719 in Dec '22, a reassuring sign concerning the I criteria. The current Up/Down Volume Ratio of 1.1 is an unbiased indication its shares have been under slight accumulation over the past 50 days. It has a Timeliness Rating of A , a Sponsorship rating of C, abd an Accumulation Distribution Rating of C.
Chart courtesy of www.stockcharts.com
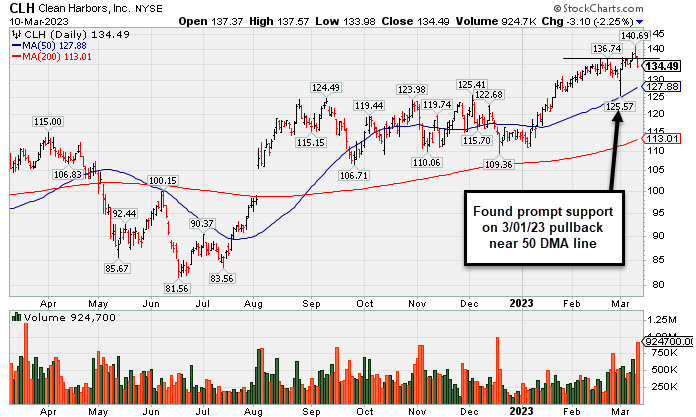
Pullback to Support Marked Secondary Buy Point; Market Concerns Rose - Friday, March 10, 2023
Clean Harbors Inc (CLH -$3.10 or -2.25% to $134.49) was highlighted in yellow in the earlier mid-day report (read here) as a valid secondary buy point exists up to 5% above the recent high following a pullback to support at the 10 WMA line after an earlier breakout. It pulled back on earnings news but found prompt support with a "positive reversal" on 3/01/23. Fundamentals remain strong. There was a "negative reversal" on the prior session at its all-time high. Quickly eroding market conditions (M criteria) also raised a caution flag late this week, hurting the outlook for any new buying efforts.
Its 50-day moving average (DMA) line ($128) defines near-term support above prior highs in the $125 area. CLH was last shown in greater detail on 11/29/22 with an annotated graph under the headline, "Volume-Driven Losses Undercut 50-Day Moving Average". It showed resilience since dropped from the Featured Stocks list on 12/29/22.
CLH has an Earnings Per Share Rating of 99. It reported Dec '22 quarterly earnings +62% on +14% sales revenues versus the year ago period. Volume and volatility often increase near earnings news. Prior quarters showed a strong earnings track record with earnings above the +25% minimum guideline (C criteria). Annual earnings (A criteria) growth has been strong and steady.
There are only 54.1 million shares outstanding (S criteria), which can contribute to greater price volatility in the event of institutional buying or selling. The number of top-rated funds owning its shares rose from 590 in Sep '21 to 702 in Dec '22, a reassuring sign concerning the I criteria. The current Up/Down Volume Ratio of 1.5 is an unbiased indication its shares have been under distributional pressure over the past 50 days. It has a Timeliness Rating of A and a Sponsorship rating of C, but an Accumulation Distribution Rating of B-.
Chart courtesy of www.stockcharts.com
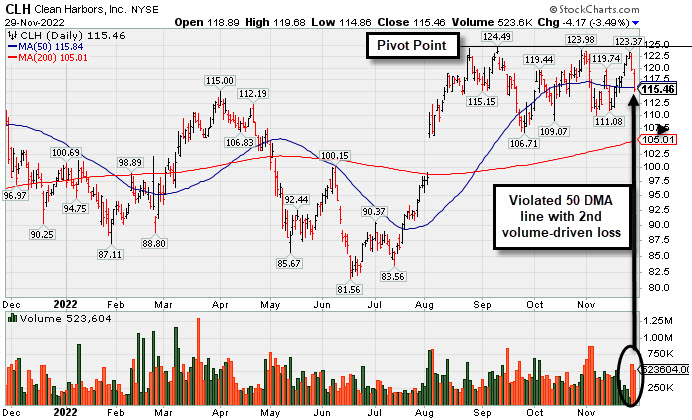
Volume-Driven Losses Undercut 50-Day Moving Average - Tuesday, November 29, 2022
Clean Harbors Inc (CLH -$4.17 or -3.49% to $115.46) suffered a 2nd consecutive loss with above average volume and violated its 50-day moving average (DMA) line ($115.84) triggering a technical sell signal. Only a prompt rebound above the 50 DMA line would help its outlook improve. A streak of 8 consecutive gains helped it approach its prior highs and pivot point, but it again failed to break out and trigger a technical buy signal.
CLH was last shown in greater detail on 11/02/22 with an annotated graph under the headline, "Testing 50 Day Moving Average Line After Forming New Base". Fundamentals remain strong after reporting Sep '22 quarterly earnings +113% on +43% sales revenues versus the year ago period. CLH was highlighted in yellow with pivot point cited based on its 9/12/22 high plus 10 cents in the 11/02/22 mid-day report (read here). It has a highest possible Earnings Per Share Rating of 99.Prior quarters showed a strong earnings track record with earnings above the +25% minimum guideline (C criteria). Annual earnings (A criteria) growth has been strong and steady.
There are only 54.1 million shares outstanding (S criteria), which can contribute to greater price volatility in the event of institutional buying or selling. The number of top-rated funds owning its shares rose from 590 in Sep '21 to 652 in Sep '22, a reassuring sign concerning the I criteria. The current Up/Down Volume Ratio of 0.8 is an unbiased indication its shares have been under distributional pressure over the past 50 days. It has a Timeliness Rating of A and a Sponsorship rating of B, but an Accumulation Distribution Rating of D.
Chart courtesy of www.stockcharts.com
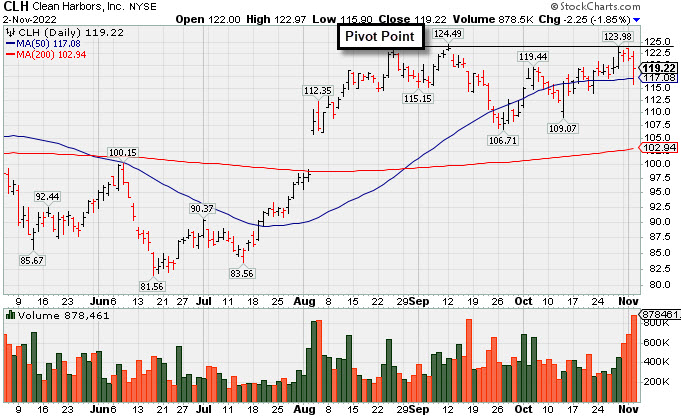
Testing 50 Day Moving Average Line After Forming New Base - Wednesday, November 2, 2022
Clean Harbors Inc (CLH -$2.25 or -1.85% to $119.22) encountered distributional pressure and finished with a loss today with twice average volume after highlighted in yellow with new pivot point cited based on its 9/12/22 high plus 10 cents in the earlier mid-day report (read here). Subsequent gains above the pivot point backed by at least +40% above average volume may trigger a technical buy signal. It showed resilience since dropped from the Featured Stocks list on 9/26/22. Today's low and its 50-day moving average (DMA) line ($117) define important near-term support to watch.
Fundamentals remain strong after reporting Sep '22 quarterly earnings +113% on +43% sales revenues versus the year ago period. It has a highest possible Earnings Per Share Rating of 99.Prior quarters showed a strong earnings track record with earnings above the +25% minimum guideline (C criteria). Annual earnings (A criteria) growth has been strong and steady.
CLH was highlighted in yellow in the 8/10/22 mid-day report (read here) with pivot point cited based on its 4/01/22 high plus 10 cents. It was last shown in greater detail on 8/29/22 with an annotated graph under the headline, "Quietly Consolidating Below "Max Buy" Level After Breakout".
There are only 54.1 million shares outstanding (S criteria), which can contribute to greater price volatility in the event of institutional buying or selling. The number of top-rated funds owning its shares rose from 590 in Sep '21 to 624 in Sep '22, a reassuring sign concerning the I criteria. The current Up/Down Volume Ratio of 0.9 is an unbiased indication its shares have been under slight distributional pressure over the past 50 days. It has a Timeliness Rating of A and a Sponsorship rating of B.
Chart courtesy of www.stockcharts.com
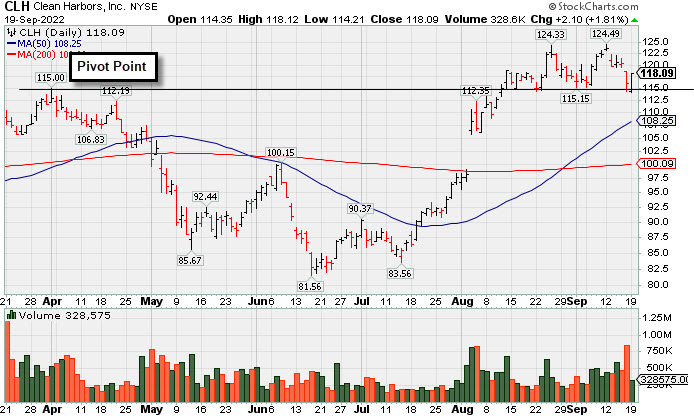
Tested Support Near Prior High in the $115 Area - Monday, September 19, 2022
Clean Harbors Inc (CLH +$2.10 or +1.81% to $118.09) posted a gain today with near average volume, finding support after testing the prior high in the $115 area. More damaging losses would raise concerns and trigger a technical sell signal.
CLH was highlighted in yellow in the 8/10/22 mid-day report (read here) with pivot point cited based on its 4/01/22 high plus 10 cents. It was last shown in greater detail on 8/29/22 with an annotated graph under the headline, "Quietly Consolidating Below "Max Buy" Level After Breakout".
CLH has a highest possible Earnings Per Share Rating of 99. It reported Jun '22 quarterly earnings +105% on +46% sales revenues versus the year ago period. Prior quarters showed a strong earnings track record with earnings above the +25% minimum guideline (C criteria). Annual earnings (A criteria) growth has been strong and steady.
There are only 54.4 million shares outstanding (S criteria), which can contribute to greater price volatility in the event of institutional buying or selling. The number of top-rated funds owning its shares rose from 590 in Sep '21 to 615 in Jun '22, a reassuring sign concerning the I criteria. The current Up/Down Volume Ratio of 1.7 is an unbiased indication its shares have been under accumulation over the past 50 days. It has a Timeliness Rating of A and a Sponsorship rating of B.
Chart courtesy of www.stockcharts.com
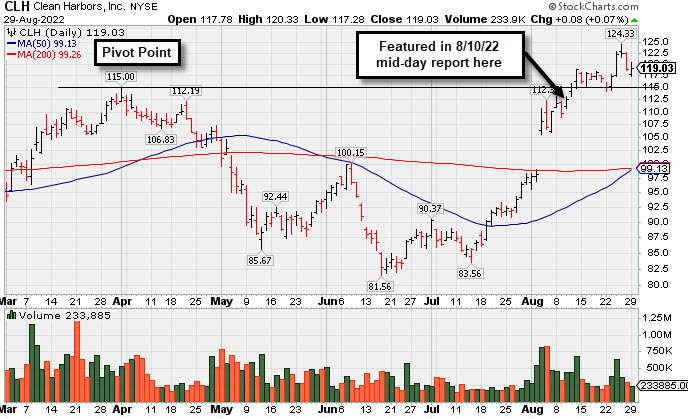
Quietly Consolidating Below "Max Buy" Level After Breakout - Monday, August 29, 2022
Clean Harbors Inc (CLH +$0.08 or +0.07% to $119.03) is consolidating near its all-time high but back below its "max buy" level so its color code is changed to yellow Previously noted gains and a strong close above the pivot point backed by +116% above average volume on 8/12/22 triggered a technical buy signal. No resistance remains due to overhead supply. Fundamentals remain strong. Prior high in the $115 area defines important near-term support to watch on pullbacks.
CLH was highlighted in yellow in the 8/10/22 mid-day report (read here) with pivot point cited based on its 4/01/22 high plus 10 cents. It was shown in greater detail that evening with an annotated graph under the headline, "Pollution Control Firm Perched Near Prior High".
CLH has a highest possible Earnings Per Share Rating of 99. It reported Jun '22 quarterly earnings +105% on +46% sales revenues versus the year ago period. Prior quarters showed a strong earnings track record with earnings above the +25% minimum guideline (C criteria). Annual earnings (A criteria) growth has been strong and steady.
There are only 54.4 million shares outstanding (S criteria), which can contribute to greater price volatility in the event of institutional buying or selling. The number of top-rated funds owning its shares rose from 590 in Sep '21 to 615 in Jun '22, a reassuring sign concerning the I criteria. The current Up/Down Volume Ratio of 2.0 is an unbiased indication its shares have been under accumulation over the past 50 days. It has a Timeliness Rating of A and a Sponsorship rating of C.
Chart courtesy of www.stockcharts.com
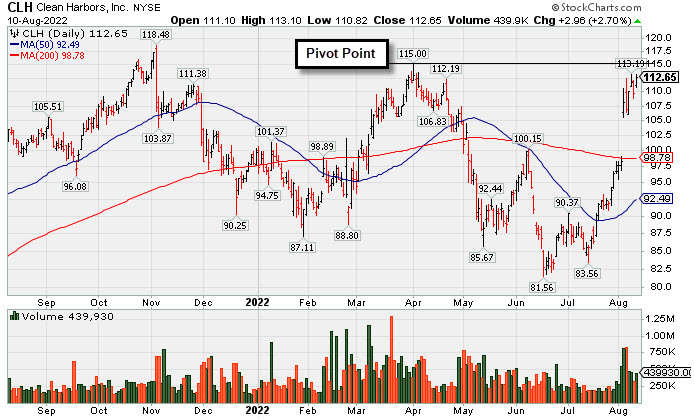
Pollution Control Firm Perched Near Prior High - Wednesday, August 10, 2022
Clean Harbors Inc (CLH +$2.96 or +2.70% to $112.65) was highlighted in yellow in the earlier mid-day report (read here) with pivot point cited based on its 4/01/22 high plus 10 cents. Subsequent gains and a close above the pivot point backed by at least +40% above average volume may trigger a technical buy signal. It has been holding its ground after recent volume-driven gains approaching its April high ($115) and all-time high. Little resistance remains due to overhead supply up to the $118 level.
CLH has a highest possible Earnings Per Share Rating of 99. It reported Jun '22 quarterly earnings +105% on +46% sales revenues versus the year ago period. Prior quarters showed a strong earnings track record with earnings above the +25% minimum guideline (C criteria). Annual earnings (A criteria) growth has been strong and steady.
There are only 54.4 million shares outstanding (S criteria), which can contribute to greater price volatility in the event of institutional buying or selling. The number of top-rated funds owning its shares rose from 590 in Sep '21 to 608 in Jun '22, a reassuring sign concerning the I criteria. The current Up/Down Volume Ratio of 1.4 is an unbiased indication its shares have been under accumulation over the past 50 days. It has a Timeliness Rating of A and a Sponsorship rating of C.
Chart courtesy of www.stockcharts.com