You are not logged in.
This means you
CAN ONLY VIEW reports that were published prior to Thursday, March 20, 2025.
You
MUST UPGRADE YOUR MEMBERSHIP if you want to see any current reports.
AFTER MARKET UPDATE - WEDNESDAY, APRIL 19TH, 2023
Previous After Market Report Next After Market Report >>>
|
|
|
|
DOW |
-79.62 |
33,897.01 |
-0.23% |
|
Volume |
765,628,280 |
-2% |
|
Volume |
4,935,483,000 |
+2% |
|
NASDAQ |
+3.81 |
12,157.23 |
+0.03% |
|
Advancers |
1,340 |
46% |
|
Advancers |
2,100 |
47% |
|
S&P 500 |
-0.35 |
4,154.52 |
-0.01% |
|
Decliners |
1,548 |
54% |
|
Decliners |
2,350 |
53% |
|
Russell 2000 |
+3.89 |
1,799.44 |
+0.22% |
|
52 Wk Highs |
51 |
|
|
52 Wk Highs |
67 |
|
|
S&P 600 |
+3.65 |
1,168.01 |
+0.31% |
|
52 Wk Lows |
31 |
|
|
52 Wk Lows |
138 |
|
|
 |
Mixed Market Still Underpinned by Healthy Leadership
Kenneth J. Gruneisen - Passed the CAN SLIM® Master's Exam
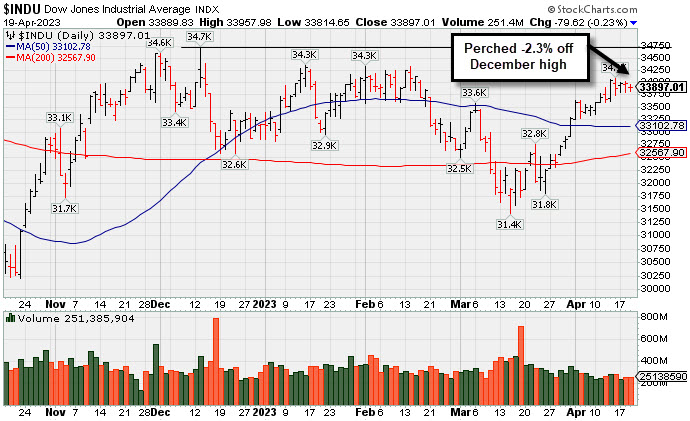
The Dow shed 79 points (0.2%), while the Nasdaq Composite and S&P 500 finished little changed. Volume totals reported were mixed, lighter than the prior session on the NYSE and higher on the Nasdaq exchange. Breadth was slightly negative as decliners led advancers by an 8-7 margin on the NYSE and by an even narrower margin on the Nasdaq exchange. There were 36 high-ranked companies from the Leaders List that hit a new 52-week high and were listed on the BreakOuts Page, versus the total of 35 on the prior session. New 52-week highs outnumbered new 52-week lows on the NYSE but new lows still solidly outnumbered new highs on the Nasdaq exchange.The major indices are in a confirmed uptrend (M criteria). Appropriate new buying efforts may be considered under the fact-based investment system.
PICTURED: The Dow Jones Industrial Average is perched -2.3% off its December 2022 high.
U.S. equities finished mixed in choppy trading as investors assessed the latest earnings releases and the Federal Reserve’s (Fed) Beige Book. In corporate news, Morgan Stanley (MS +0.67%) inched higher after it released better-than-expected first-quarter results with both earnings and revenue topping analyst expectations. The bank noted strong performances from equities and fixed income trading units as a driver behind the results. They also indicated they saw substantial growth in wealth management, with its revenue increasing 11% as compared to last year.
On the data front, Mortgage Bankers’ Association (MBA) mortgage applications fell in the latest week as borrowing costs remain stubbornly high. In the central bank space, the Fed’s Beige Book garnered attention as investors looked for insights into the economy. The report noted March’s banking crisis weighed on financial activity, particularly in the San Francisco and New York areas. It also noted there was some pullback in commercial real estate. Shorter-dated Treasuries weakened, with the yield on the benchmark 10-year note up one basis point (0.01%) to 3.59%, while the 30-year bond yield was little changed at 3.78%. The yield on the two-year note, which is more sensitive to changes in monetary policy, advanced five basis points (0.05%) to 4.26%. In commodities, West Texas Intermediate (WTI) crude fell 2.2% to $79.10/barrel amid mixed global economic data and a stronger U.S. dollar. Meanwhile, the Energy Information Administration’s (EIA) weekly report showed U.S. crude inventories fell more than expected last week while gasoline stockpiles unexpectedly climbed.
|
 Kenneth J. Gruneisen started out as a licensed stockbroker in August 1987, a couple of months prior to the historic stock market crash that took the Dow Jones Industrial Average down -22.6% in a single day. He has published daily fact-based fundamental and technical analysis on high-ranked stocks online for two decades. Through FACTBASEDINVESTING.COM, Kenneth provides educational articles, news, market commentary, and other information regarding proven investment systems that work in good times and bad.
Comments contained in the body of this report are technical opinions only and are not necessarily those of Gruneisen Growth Corp. The material herein has been obtained from sources believed to be reliable and accurate, however, its accuracy and completeness cannot be guaranteed. Our firm, employees, and customers may effect transactions, including transactions contrary to any recommendation herein, or have positions in the securities mentioned herein or options with respect thereto. Any recommendation contained in this report may not be suitable for all investors and it is not to be deemed an offer or solicitation on our part with respect to the purchase or sale of any securities. |
|
 |
Financial and Retail Indexes Rose; Techs and Commodities Fell
Kenneth J. Gruneisen - Passed the CAN SLIM® Master's Exam
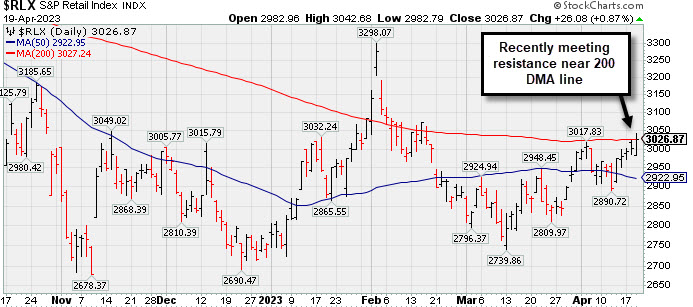
The Bank Index ($BKX +1.69%), Broker/Dealer Index ($XBD +0.79%), and Retail Index ($RLX +0.87%) each posted gains that had a positive influence on the major averages. The tech sector had a negative bias as the Networking Index ($NWX -2.69%) and Semiconductor Index ($SOX -1.02%) both lost ground, meanwhile the Biotech Index ($BTK +0.31%) inched higher. Commodity-linked groups also had a negative bias as the Gold & Silver Index ($XAU -2.04%) suffered a large loss while the Oil Services Index ($OSX -0.35%) and Integrated Oil Index ($XOI -0.83%) both suffered smaller losses.
PICTURED: The Bank Index ($BKX +0.17%) has been rebounding, but it has recently been meeting resistance near its 200-day moving average (DMA) line.
| Oil Services |
$OSX |
82.05 |
-0.29 |
-0.35% |
-2.16% |
| Integrated Oil |
$XOI |
1,782.84 |
-14.96 |
-0.83% |
-0.25% |
| Semiconductor |
$SOX |
3,046.38 |
-31.34 |
-1.02% |
+20.31% |
| Networking |
$NWX |
783.51 |
-21.64 |
-2.69% |
+0.02% |
| Broker/Dealer |
$XBD |
465.91 |
+3.63 |
+0.79% |
+3.74% |
| Retail |
$RLX |
3,026.87 |
+26.08 |
+0.87% |
+9.91% |
| Gold & Silver |
$XAU |
136.09 |
-2.83 |
-2.04% |
+12.60% |
| Bank |
$BKX |
85.71 |
+1.43 |
+1.69% |
-15.01% |
| Biotech |
$BTK |
5,408.95 |
+16.86 |
+0.31% |
+2.42% |
|
|
|
 |
Wedged to a New High Close Above "Max Buy" Level
Kenneth J. Gruneisen - Passed the CAN SLIM® Master's Exam
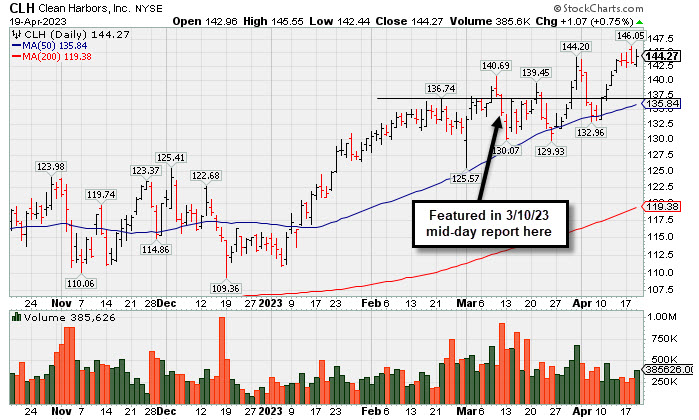
Clean Harbors Inc (CLH +$0.80 or +0.56% to $144.00) posted a gain with near-average volume today for a best-ever close. Its color code was changed to gren after wedging above its "max buy" level. It found prompt support near its 50-day moving average (DMA) line ($135.84) during recent consolidations. Below that important short-term average, the recent low ($129.93 on 3/24/23) defines the next important support where a violation would raise concerns and trigger a more worrisome technical sell signal. Fundamentals remain strong.
CLH was highlighted in yellow in the 3/10/23 mid-day report (read here) as it was noted that a valid secondary buy point exists up to 5% above the recent high following a pullback to support at the 10 WMA line after an earlier breakout. It was last shown in this FSU section on 3/29/23 with an annotated graph under the headline, "Finding Support Recently at 50-Day Moving Average Line".
CLH has an Earnings Per Share Rating of 99. It reported Dec '22 quarterly earnings +62% on +14% sales revenues versus the year ago period. Prior quarters showed a strong earnings track record with earnings above the +25% minimum guideline (C criteria). Annual earnings (A criteria) growth has been strong and steady.
There are only 54.1 million shares outstanding (S criteria), which can contribute to greater price volatility in the event of institutional buying or selling. The number of top-rated funds owning its shares rose from 590 in Sep '21 to 724 in Mar '23, a reassuring sign concerning the I criteria. The current Up/Down Volume Ratio of 1.o is an unbiased indication its shares have been neutral concerning accumulation/distribution over the past 50 days. It has a Timeliness Rating of A , a Sponsorship Rating of C, abd an Accumulation Distribution Rating of B.
|
|
|
Color Codes Explained :
Y - Better candidates highlighted by our
staff of experts.
G - Previously featured
in past reports as yellow but may no longer be buyable under the
guidelines.
***Last / Change / Volume data in this table is the closing quote data***
Symbol/Exchange
Company Name
Industry Group |
PRICE |
CHANGE
(%Change) |
Day High |
Volume
(% DAV)
(% 50 day avg vol) |
52 Wk Hi
% From Hi |
Featured
Date |
Price
Featured |
Pivot Featured |
|
Max Buy |
 GPK
-
NYSE
GPK
-
NYSE
Graphic Packaging
CONSUMER NON-DURABLES - Packaging and Containers
|
$24.99
|
-0.03
-0.12% |
$25.08
|
1,781,842
56.64% of 50 DAV
50 DAV is 3,146,000
|
$25.62
-2.46%
|
10/25/2022
|
$22.75
|
PP = $24.17
|
|
MB = $25.38
|
Most Recent Note - 4/17/2023 3:47:51 PM
Y - Volume totals have been near average or lighter than average while consolidating below its "max buy" level and just -3% below its all-time high. Recent gains lacked great volume conviction. Its 50 DMA line ($24.16) and recent low ($22.99 on 3/16/23) define important near-term support to watch.
>>> FEATURED STOCK ARTICLE : Quietly Consolidating Just Below "Max Buy" Level - 4/10/2023 |
View all notes |
Set NEW NOTE alert |
Company Profile |
SEC
News |
Chart |
Request a new note
C
A
S
I |
STRL
-
NASDAQ
Sterling Infrastructure
MATERIALS and; CONSTRUCTION - Heavy Construction
|
$37.29
|
+0.46
1.25% |
$37.49
|
167,058
66.56% of 50 DAV
50 DAV is 251,000
|
$42.00
-11.21%
|
12/14/2022
|
$32.41
|
PP = $33.72
|
|
MB = $35.41
|
Most Recent Note - 4/18/2023 5:56:46 PM
G - Met resistance at its 50 DMA line today and ended with a loss and near the session low breaking a streak of 6 consecutive gains with below-average volume. A rebound above the 50 DMA line ($37.74) is needed for its outlook to improve.
>>> FEATURED STOCK ARTICLE : Volume-Driven 50-Day Moving Average Violation Triggered Sell Signal - 4/5/2023 |
View all notes |
Set NEW NOTE alert |
Company Profile |
SEC
News |
Chart |
Request a new note
C
A
S
I |
PERI
-
NASDAQ
Perion Network
Comml Svcs-Advertising
|
$38.73
|
-2.77
-6.67% |
$41.14
|
897,433
117.62% of 50 DAV
50 DAV is 763,000
|
$42.75
-9.40%
|
1/25/2023
|
$31.79
|
PP = $33.19
|
|
MB = $34.85
|
 Most Recent Note - 4/19/2023 5:22:15 PM
G - Suffered a big loss today with above-average volume, abruptly retreating from its all-time high. Its 50 DMA line ($36.24) defines important near-term support to watch.
>>> FEATURED STOCK ARTICLE : Hit Another New High With Gain Backed by Light Volume - 3/31/2023 |
View all notes |
Set NEW NOTE alert |
Company Profile |
SEC
News |
Chart |
Request a new note
C
A
S
I |
ALGM
-
NASDAQ
Allegro MicroSystems
Elec-Semiconductor Mfg
|
$43.64
|
-0.70
-1.58% |
$44.08
|
1,003,864
72.32% of 50 DAV
50 DAV is 1,388,000
|
$48.72
-10.43%
|
1/31/2023
|
$37.80
|
PP = $38.38
|
|
MB = $40.30
|
Most Recent Note - 4/18/2023 5:58:14 PM
G - Posted a gain today with lighter volume after violating its 50 DMA line ($44.86) on the prior session with a damaging loss raising concerns and triggering a technical sell signal. Only a prompt rebound above the 50 DMA line would help its outlook improve.
>>> FEATURED STOCK ARTICLE : Consolidating Near 50 DMA Line After Recent Rally - 4/11/2023 |
View all notes |
Set NEW NOTE alert |
Company Profile |
SEC
News |
Chart |
Request a new note
C
A
S
I |
FIX
-
NYSE
Comfort Systems USA
MATERIALS and CONSTRUCTION - General Contractors
|
$134.12
|
+1.37
1.03% |
$134.88
|
195,921
68.99% of 50 DAV
50 DAV is 284,000
|
$152.13
-11.84%
|
2/23/2023
|
$136.52
|
PP = $128.78
|
|
MB = $135.22
|
Most Recent Note - 4/18/2023 5:59:04 PM
G - Volume totals have still been cooling while sputtering above prior highs in the $128 area which are acting as support. Only a prompt rebound above the 50 DMA line ($135.77) would help its outlook improve. Fundamentals remain strong.
>>> FEATURED STOCK ARTICLE : Pullback With Higher Volume While Consolidating - 4/4/2023 |
View all notes |
Set NEW NOTE alert |
Company Profile |
SEC
News |
Chart |
Request a new note
C
A
S
I |
Symbol/Exchange
Company Name
Industry Group |
PRICE |
CHANGE
(%Change) |
Day High |
Volume
(% DAV)
(% 50 day avg vol) |
52 Wk Hi
% From Hi |
Featured
Date |
Price
Featured |
Pivot Featured |
|
Max Buy |
KOF
-
NYSE
Coca-Cola Femsa ADR
FOOD and BEVERAGE - Beverages - Soft Drinks
|
$83.68
|
+0.21
0.25% |
$84.68
|
192,380
104.55% of 50 DAV
50 DAV is 184,000
|
$84.57
-1.05%
|
3/7/2023
|
$76.63
|
PP = $77.11
|
|
MB = $80.97
|
Most Recent Note - 4/17/2023 3:43:23 PM
G - Hovering at its all-time high following a noted streak of 12 consecutive gains. Extended from the prior base. On pullbacks, prior highs in the $79-$77 area define initial support to watch above its 50 DMA line ($76.15).
>>> FEATURED STOCK ARTICLE : Streak of 11 Straight Gains into New High Territory - 4/12/2023 |
View all notes |
Set NEW NOTE alert |
Company Profile |
SEC
News |
Chart |
Request a new note
C
A
S
I |
ANET
-
NYSE
Arista Networks
Computer-Networking
|
$158.09
|
-4.60
-2.83% |
$161.25
|
2,905,516
113.01% of 50 DAV
50 DAV is 2,571,000
|
$171.44
-7.79%
|
3/8/2023
|
$147.59
|
PP = $148.67
|
|
MB = $156.10
|
Most Recent Note - 4/19/2023 5:29:39 PM
G - Gapped down and fell with higher volume today for a 4th consecutive loss. Its 50 DMA line ($152) and prior highs in the $148-145 area define important support to watch.
>>> FEATURED STOCK ARTICLE : Near High With Volume Cooling Following Volume-Driven Gains - 4/17/2023 |
View all notes |
Set NEW NOTE alert |
Company Profile |
SEC
News |
Chart |
Request a new note
C
A
S
I |
CLH
-
NYSE
Clean Harbors
Pollution Control
|
$144.27
|
+1.07
0.75% |
$145.55
|
385,626
89.27% of 50 DAV
50 DAV is 432,000
|
$146.05
-1.22%
|
3/10/2023
|
$136.89
|
PP = $136.74
|
|
MB = $143.58
|
Most Recent Note - 4/19/2023 5:10:39 PM
G - Posted a small gain today with near-average volume for a best-ever close and its color code is changed to green after wedging up above its "max buy" level. Found prompt support near its 50 DMA line ($135.84) during recent consolidations. Below that important short-term average, the recent low ($129.93 on 3/24/23) defines the next important support where a violation would raise concerns and trigger a more worrisome technical sell signal. Fundamentals remain strong. See the latest FSU analysis for more details and a new annotated graph.
>>> FEATURED STOCK ARTICLE : Wedged to a New High Close Above "Max Buy" Level - 4/19/2023 |
View all notes |
Set NEW NOTE alert |
Company Profile |
SEC
News |
Chart |
Request a new note
C
A
S
I |
MTRN
-
NYSE
Materion
METALS and MINING - Industrial Metals and Minerals
|
$114.71
|
-0.09
-0.08% |
$114.77
|
64,739
49.80% of 50 DAV
50 DAV is 130,000
|
$119.75
-4.21%
|
4/18/2023
|
$114.52
|
PP = $118.30
|
|
MB = $124.22
|
Most Recent Note - 4/18/2023 5:54:49 PM
Y - Finished in the lower half of its intra-day range today after highlighted in yellow with pivot point cited based on its 3/03/23 high plus 10 cents in the earlier mid-day report. Hit a new all-time high with today's early gain, but encountered distributional pressure. Subsequent gains and a strong close above the pivot point backed by at least +40% above average volume may trigger a proper technical buy signal. Reported earnings +33% on +9% sales revenues for the Dec '22 quarter versus the year-ago period. Three of the past 4 quarterly comparisons were above the +25% minimum earnings guideline (C criteria). A downturn in its FY '20 annual earnings history (A criteria) has been followed by much stronger '21 and '22 results. See the latest FSU analysis for more details and a new annotated graph.
>>> FEATURED STOCK ARTICLE : Encountered Distributional Pressure When Poised for Breakout - 4/18/2023 |
View all notes |
Set NEW NOTE alert |
Company Profile |
SEC
News |
Chart |
Request a new note
C
A
S
I |
|
|
|
THESE ARE NOT BUY RECOMMENDATIONS!
Comments contained in the body of this report are technical
opinions only. The material herein has been obtained
from sources believed to be reliable and accurate, however,
its accuracy and completeness cannot be guaranteed.
This site is not an investment advisor, hence it does
not endorse or recommend any securities or other investments.
Any recommendation contained in this report may not
be suitable for all investors and it is not to be deemed
an offer or solicitation on our part with respect to
the purchase or sale of any securities. All trademarks,
service marks and trade names appearing in this report
are the property of their respective owners, and are
likewise used for identification purposes only.
This report is a service available
only to active Paid Premium Members.
You may opt-out of receiving report notifications
at any time. Questions or comments may be submitted
by writing to Premium Membership Services 665 S.E. 10 Street, Suite 201 Deerfield Beach, FL 33441-5634 or by calling 1-800-965-8307
or 954-785-1121.
|
|
|