You are not logged in.
This means you
CAN ONLY VIEW reports that were published prior to Monday, March 24, 2025.
You
MUST UPGRADE YOUR MEMBERSHIP if you want to see any current reports.
AFTER MARKET UPDATE - WEDNESDAY, AUGUST 10TH, 2022
Previous After Market Report Next After Market Report >>>
|
|
|
|
DOW |
+535.10 |
33,309.51 |
+1.63% |
|
Volume |
908,300,841 |
+11% |
|
Volume |
5,083,541,700 |
-4% |
|
NASDAQ |
+360.88 |
12,854.80 |
+2.89% |
|
Advancers |
2,646 |
85% |
|
Advancers |
3,251 |
74% |
|
S&P 500 |
+87.77 |
4,210.24 |
+2.13% |
|
Decliners |
460 |
15% |
|
Decliners |
1,142 |
26% |
|
Russell 2000 |
+56.36 |
1,969.25 |
+2.95% |
|
52 Wk Highs |
61 |
|
|
52 Wk Highs |
69 |
|
|
S&P 600 |
+27.22 |
1,256.41 |
+2.21% |
|
52 Wk Lows |
23 |
|
|
52 Wk Lows |
78 |
|
|
 |
Breadth Positive as Major Indices Rose With Greater Leadership
Kenneth J. Gruneisen - Passed the CAN SLIM® Master's Exam
The S&P 500 advanced 2.1%, to its highest level in three months, while the CBOE Volatility Index (VIX) dipped below 20, a trough not seen since April. The Nasdaq Composite surged 2.9%, now more than 20% above its June 16 low - meeting one widely cited definition of a bull market. The Dow added 535 points. The volume totals reported were mixed, higher than the prior session on the NYSE and lower on the Nasdaq exchange. Advancers led decliners by more than a 5-1 margin on the NYSE and by nearly 3-1 on the Nasdaq exchange. There were 40 high-ranked companies from the Leaders List that hit new 52-week highs and were listed on the BreakOuts Page, versus the total of 17 on the prior session. New 52-week lows highs outnumbered new 52-week lows on the NYSE but new lows outnumbered new highs on the Nasdaq exchange. The market is in a confirmed uptrend (M criteria). Any sustainable rally requires a healthy crop of leading stocks hitting new highs, so the recent improvement in leadership was a reassuring sign.
Chart courtesy of www.stockcharts.com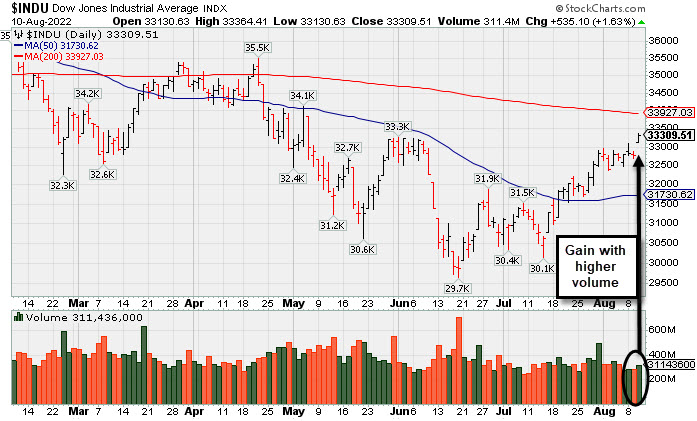 PICTURED: The Dow Jones Industrial Average posted a gain with higher volume, approaching its downward sloping 200 DMA line.
All 11 S&P 500 sectors closed in positive territory, with both growth-related and cyclical groups among the standouts. The Consumer Price Index (CPI) was unchanged in July, versus estimates of a 0.2% gain. The softer print was widely anticipated amid the recent pullback in oil prices. However, the headline figure remained elevated at 8.5% year-over-year, easing more than forecasted from June’s 9.1% annual increase but still well above the Federal Reserve’s (Fed) 2% target. Core CPI (excluding food and energy) climbed 5.9% on an annual basis in July, below expectations of a 6.1% year-over-year pace and matching the prior month’s reading.
Despite the weaker inflation reading, the latest remarks from central bank officials continued to push back against the idea of a pivot to more accommodative policy. The yield on the 10-year note ended just one basis point (0.01%) higher at 2.79% after the maturity’s $35 billion auction was met with strong demand. In FOREX trading, a gauge of the U.S. dollar fell 1.1% in its steepest drop since the start of the pandemic. The lower greenback supported oil prices, helping to offset a larger-than-forecasted weekly buildup in crude stockpiles. West Texas Intermediate crude rose 1.1% to $91.47/barrel. |
 Kenneth J. Gruneisen started out as a licensed stockbroker in August 1987, a couple of months prior to the historic stock market crash that took the Dow Jones Industrial Average down -22.6% in a single day. He has published daily fact-based fundamental and technical analysis on high-ranked stocks online for two decades. Through FACTBASEDINVESTING.COM, Kenneth provides educational articles, news, market commentary, and other information regarding proven investment systems that work in good times and bad.
Comments contained in the body of this report are technical opinions only and are not necessarily those of Gruneisen Growth Corp. The material herein has been obtained from sources believed to be reliable and accurate, however, its accuracy and completeness cannot be guaranteed. Our firm, employees, and customers may effect transactions, including transactions contrary to any recommendation herein, or have positions in the securities mentioned herein or options with respect thereto. Any recommendation contained in this report may not be suitable for all investors and it is not to be deemed an offer or solicitation on our part with respect to the purchase or sale of any securities. |
|
 |
Tech, Retail, Financial, and Commodity-Linked Groups Rose
Kenneth J. Gruneisen - Passed the CAN SLIM® Master's Exam
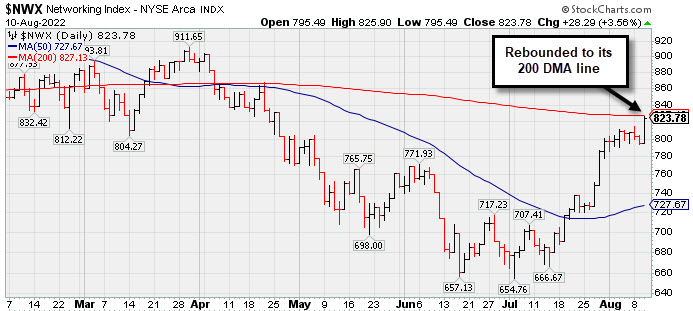
The Retail Index ($RLX +2.73%), Bank Index ($BKX +2.90%), and Broker/Dealer Index ($XBD +1.09%) each posted a solid gain to underpin the major averages' rally. The Semiconductor Index ($SOX +4.25%) and Networking Index ($NWX +3.56%) led the tech sector higher while the Biotech Index ($BTK +1.97%) also notched a solid gain. The Gold & Silver Index ($XAU +1.21%) outpaced the Integrated Oil Index ($XOI +0.85%) and Oil Services Index ($OSX +0.46%), rounding out the solidly positive session.
PICTURED: The Networking Index ($NWX +3.56%) posted a big gain as it approached its 200-day moving average (DMA) line.
| Oil Services |
$OSX |
65.69 |
+0.30 |
+0.46% |
+24.61% |
| Integrated Oil |
$XOI |
1,556.37 |
+13.18 |
+0.85% |
+32.10% |
| Semiconductor |
$SOX |
2,988.71 |
+121.81 |
+4.25% |
-24.26% |
| Networking |
$NWX |
823.78 |
+28.29 |
+3.56% |
-15.17% |
| Broker/Dealer |
$XBD |
455.79 |
+4.93 |
+1.09% |
-6.38% |
| Retail |
$RLX |
3,523.79 |
+93.77 |
+2.73% |
-16.63% |
| Gold & Silver |
$XAU |
111.80 |
+1.34 |
+1.21% |
-15.59% |
| Bank |
$BKX |
111.62 |
+3.15 |
+2.90% |
-15.58% |
| Biotech |
$BTK |
5,090.20 |
+98.42 |
+1.97% |
-7.76% |
|
|
|
 |
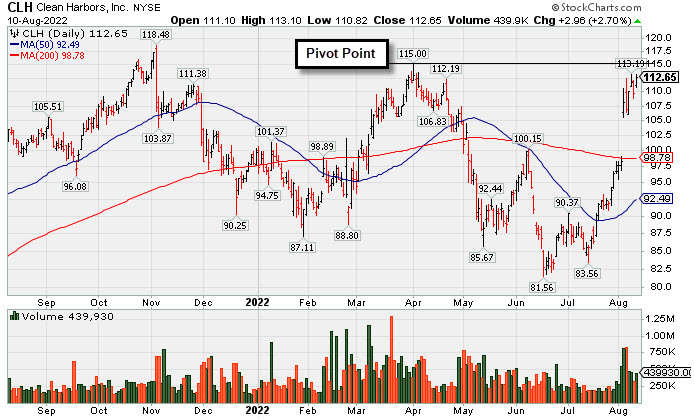
Pollution Control Firm Perched Near Prior High
Kenneth J. Gruneisen - Passed the CAN SLIM® Master's Exam
Clean Harbors Inc (CLH +$2.96 or +2.70% to $112.65) was highlighted in yellow in the earlier mid-day report (read here) with pivot point cited based on its 4/01/22 high plus 10 cents. Subsequent gains and a close above the pivot point backed by at least +40% above average volume may trigger a technical buy signal. It has been holding its ground after recent volume-driven gains approaching its April high ($115) and all-time high. Little resistance remains due to overhead supply up to the $118 level.
CLH has a highest possible Earnings Per Share Rating of 99. It reported Jun '22 quarterly earnings +105% on +46% sales revenues versus the year ago period. Prior quarters showed a strong earnings track record with earnings above the +25% minimum guideline (C criteria). Annual earnings (A criteria) growth has been strong and steady.
There are only 54.4 million shares outstanding (S criteria), which can contribute to greater price volatility in the event of institutional buying or selling. The number of top-rated funds owning its shares rose from 590 in Sep '21 to 608 in Jun '22, a reassuring sign concerning the I criteria. The current Up/Down Volume Ratio of 1.4 is an unbiased indication its shares have been under accumulation over the past 50 days. It has a Timeliness Rating of A and a Sponsorship rating of C.
|
|
|
Color Codes Explained :
Y - Better candidates highlighted by our
staff of experts.
G - Previously featured
in past reports as yellow but may no longer be buyable under the
guidelines.
***Last / Change / Volume data in this table is the closing quote data***
Symbol/Exchange
Company Name
Industry Group |
PRICE |
CHANGE
(%Change) |
Day High |
Volume
(% DAV)
(% 50 day avg vol) |
52 Wk Hi
% From Hi |
Featured
Date |
Price
Featured |
Pivot Featured |
|
Max Buy |
 LLY
-
NYSE
LLY
-
NYSE
Eli Lilly & Co
Medical-Diversified
|
$304.61
|
+1.59
0.52% |
$307.13
|
2,338,481
80.94% of 50 DAV
50 DAV is 2,889,000
|
$335.33
-9.16%
|
5/16/2022
|
$302.46
|
PP = $314.10
|
|
MB = $329.81
|
Most Recent Note - 8/8/2022 12:55:42 PM
G - On track today for a 7th consecutive loss, slumping further below its 50 DMA line ($316) raising concerns. Only a prompt rebound above the 50 DMA line would help its outlook improve.
>>> FEATURED STOCK ARTICLE : Hovering Near "Max Buy" Level With Volume Totals Cooling - 7/22/2022 |
View all notes |
Set NEW NOTE alert |
Company Profile |
SEC
News |
Chart |
Request a new note
C
A
S
I |
IMXI
-
NASDAQ
International Money Exp
Financial Svcs-Specialty
|
$25.39
|
+0.28
1.12% |
$25.92
|
942,057
197.91% of 50 DAV
50 DAV is 476,000
|
$26.11
-2.76%
|
7/1/2022
|
$21.27
|
PP = $21.38
|
|
MB = $22.45
|
 Most Recent Note - 8/10/2022 12:46:20 PM
G - Reported Jun '22 quarterly earnings +21% on +17% sales revenues versus the year ago period, below the +25% minimum earnings guideline (C criteria). Perched near its 52-week high today following a spurt of volume-driven gains. Its 50 DMA line ($21.82) defines important near-term support to watch on pullbacks.
>>> FEATURED STOCK ARTICLE : Finished Strong With Another Volume-Driven Gain After Earnings - 8/3/2022 |
View all notes |
Set NEW NOTE alert |
Company Profile |
SEC
News |
Chart |
Request a new note
C
A
S
I |
HRMY
-
NASDAQ
Harmony Biosciences Holdings
Medical-Biomed/Biotech
|
$52.44
|
+1.67
3.29% |
$52.91
|
620,507
110.94% of 50 DAV
50 DAV is 559,300
|
$57.13
-8.21%
|
7/6/2022
|
$54.12
|
PP = $52.85
|
|
MB = $55.49
|
Most Recent Note - 8/10/2022 7:08:53 PM
Y - Still churning above average volume and consolidating above noted support near its 50 DMA line ($49.90) and prior low ($48.85). More damaging losses would raise concerns and trigger technical sell signals. Challenged its all-time high but met stubborn resistance in the $57 area after reporting Jun '22 quarterly earnings +54% on +45% sales revenues versus the year ago period.
>>> FEATURED STOCK ARTICLE : Churning Higher Volume While Perched Near High After Earnings News - 8/4/2022 |
View all notes |
Set NEW NOTE alert |
Company Profile |
SEC
News |
Chart |
Request a new note
C
A
S
I |
CI
-
NYSE
Cigna Corp
Medical-Managed Care
|
$287.07
|
+2.03
0.71% |
$289.25
|
1,397,851
68.06% of 50 DAV
50 DAV is 2,054,000
|
$288.47
-0.48%
|
7/7/2022
|
$276.55
|
PP = $273.68
|
|
MB = $287.36
|
Most Recent Note - 8/9/2022 7:16:22 PM
Y - Wedged higher and hit a new all-time high with lighter volume behind today's 5th consecutive gain. Still below its "max buy" level. Reported earnings news for the Jun '22 quarter +19% on +5% sales revenues versus the year ago period, breaking a streak of 3 quarterly earnings increases above the +25% minimum guideline (C criteria). Near-term support to watch is at its 50 DMA line ($266.66). See the latest FSU analysis for more details and a new annotated graph.
>>> FEATURED STOCK ARTICLE : Wedging Higher With Lighter Volume Behind Gain for New High - 8/9/2022 |
View all notes |
Set NEW NOTE alert |
Company Profile |
SEC
News |
Chart |
Request a new note
C
A
S
I |
AN
-
NYSE
Autonation Inc
SPECIALTY RETAIL - Auto Dealerships
|
$123.25
|
+2.11
1.74% |
$125.66
|
628,304
88.24% of 50 DAV
50 DAV is 712,000
|
$133.48
-7.66%
|
7/20/2022
|
$122.03
|
PP = $126.49
|
|
MB = $132.81
|
Most Recent Note - 8/8/2022 5:56:57 PM
Y - Posted a gain backed by near average volume today while challenging previously stubborn resistance in the $126 area. Recent rebound above its 200 DMA line and 50 DMA line ($116.62) helped its outlook to improve. Subsequent volume-driven gains above the pivot point may trigger a technical buy signal. Reported Jun '22 quarterly earnings +34% on -2% sales revenues versus the year ago period. Still faces some resistance due to overhead supply up to the $133 level.
>>> FEATURED STOCK ARTICLE : Autonation Earnings Due While Perched Near Pivot Point - 7/20/2022 |
View all notes |
Set NEW NOTE alert |
Company Profile |
SEC
News |
Chart |
Request a new note
C
A
S
I |
Symbol/Exchange
Company Name
Industry Group |
PRICE |
CHANGE
(%Change) |
Day High |
Volume
(% DAV)
(% 50 day avg vol) |
52 Wk Hi
% From Hi |
Featured
Date |
Price
Featured |
Pivot Featured |
|
Max Buy |
ESQ
-
NASDAQ
Esquire Financial Hldgs
Finance-Commercial Loans
|
$38.41
|
-0.01
-0.03% |
$39.50
|
40,782
67.97% of 50 DAV
50 DAV is 60,000
|
$39.09
-1.74%
|
7/26/2022
|
$37.74
|
PP = $39.19
|
|
MB = $41.15
|
Most Recent Note - 8/8/2022 5:59:12 PM
Y - Posted a 4th consecutive gain today challenging previously stubborn resistance in the $39 area. Its 50 DMA line ($35.34) defines important near-term support. Subsequent gains above the pivot point backed by at least +40% above average volume may trigger a technical buy signal.
>>> FEATURED STOCK ARTICLE : Volume Driven Gains Approaching Prior High - 7/26/2022 |
View all notes |
Set NEW NOTE alert |
Company Profile |
SEC
News |
Chart |
Request a new note
C
A
S
I |
GPK
-
NYSE
Graphic Packaging Hldg
CONSUMER NON-DURABLES - Packaging and Containers
|
$23.11
|
+0.25
1.09% |
$23.63
|
3,987,052
137.06% of 50 DAV
50 DAV is 2,909,000
|
$22.99
0.52%
|
7/26/2022
|
$22.63
|
PP = $23.09
|
|
MB = $24.24
|
Most Recent Note - 8/10/2022 12:39:58 PM
Y - Gapped up today on track for a 4th consecutive gain and hitting a new 52-week high. A gain and strong close above the pivot point backed by at least +40% above average volume may trigger a proper technical buy signal. Highlighted in yellow in the 7/26/22 mid-day report with pivot point cited based on its 6/06/22 high plus 10 cents.
>>> FEATURED STOCK ARTICLE : Negative Reversal After Matching 52-Week High - 7/27/2022 |
View all notes |
Set NEW NOTE alert |
Company Profile |
SEC
News |
Chart |
Request a new note
C
A
S
I |
CSL
-
NYSE
Carlisle Cos Inc
Diversified Operations
|
$307.11
|
+5.91
1.96% |
$310.57
|
490,664
128.45% of 50 DAV
50 DAV is 382,000
|
$304.69
0.79%
|
7/28/2022
|
$282.31
|
PP = $275.23
|
|
MB = $288.99
|
Most Recent Note - 8/10/2022 6:58:59 PM
G - Hit another new all-time high with today's volume-driven gain adding to a recent spurt. Prior highs in the $275 area define initial support to watch on pullbacks.
>>> FEATURED STOCK ARTICLE : Carlisle Perched at All-Time High After Noted Breakout - 8/2/2022 |
View all notes |
Set NEW NOTE alert |
Company Profile |
SEC
News |
Chart |
Request a new note
C
A
S
I |
ENPH
-
NASDAQ
Enphase Energy Inc
Energy-Solar
|
$303.25
|
+12.43
4.27% |
$304.32
|
3,134,174
94.60% of 50 DAV
50 DAV is 3,313,000
|
$308.88
-1.82%
|
7/28/2022
|
$276.66
|
PP = $282.55
|
|
MB = $296.68
|
Most Recent Note - 8/10/2022 7:01:52 PM
G - Posted a gain today with average volume for a new high close. It has been noted while recently wedging higher, and its color code is changed to green after rising above its "max buy" level. The prior high in the $282 area was noted as initial support to watch on pullbacks. Fundamentals remain strong.
>>> FEATURED STOCK ARTICLE : Pullback Following 3 Consecutive Gains With Heavier Volume - 8/1/2022 |
View all notes |
Set NEW NOTE alert |
Company Profile |
SEC
News |
Chart |
Request a new note
C
A
S
I |
PWR
-
NYSE
Quanta Services Inc
MATERIALS and CONSTRUCTION - General Contractors
|
$140.25
|
+4.41
3.25% |
$140.53
|
1,187,812
77.63% of 50 DAV
50 DAV is 1,530,000
|
$146.84
-4.49%
|
7/28/2022
|
$141.83
|
PP = $140.14
|
|
MB = $147.15
|
Most Recent Note - 8/10/2022 7:15:55 PM
Y - Posted a gain today with lighter than average volume for a 2nd best ever close back above its pivot point. Fundamentals remain strong.
>>> FEATURED STOCK ARTICLE : Volume-Driven Breakout for Quanta Services - 7/28/2022 |
View all notes |
Set NEW NOTE alert |
Company Profile |
SEC
News |
Chart |
Request a new note
C
A
S
I |
Symbol/Exchange
Company Name
Industry Group |
PRICE |
CHANGE
(%Change) |
Day High |
Volume
(% DAV)
(% 50 day avg vol) |
52 Wk Hi
% From Hi |
Featured
Date |
Price
Featured |
Pivot Featured |
|
Max Buy |
CLFD
-
NASDAQ
Clearfield Inc
TELECOMMUNICATIONS - Cables / Satalite Equipment
|
$116.62
|
+2.74
2.41% |
$117.25
|
533,428
182.06% of 50 DAV
50 DAV is 293,000
|
$114.73
1.65%
|
7/29/2022
|
$94.10
|
PP = $86.81
|
|
MB = $91.15
|
Most Recent Note - 8/10/2022 12:27:49 PM
G - Reversed into the red after early gains today for another new all-time high. Following volume-driven gains, the prior high in the $86 area defines initial support to watch on pullbacks. Fundamentals remain strong after it reported Jun '22 quarterly earnings +109% on +84% sales revenues above the year ago period.
>>> FEATURED STOCK ARTICLE : Volume Heavy Behind Technical Breakout - 7/29/2022 |
View all notes |
Set NEW NOTE alert |
Company Profile |
SEC
News |
Chart |
Request a new note
C
A
S
I |
GFF
-
NYSE
Griffon Corporation
MATERIALS and CONSTRUCTION - General Building Materials
|
$32.98
|
+1.81
5.81% |
$33.11
|
494,369
109.13% of 50 DAV
50 DAV is 453,000
|
$32.65
1.01%
|
8/8/2022
|
$32.46
|
PP = $31.12
|
|
MB = $32.68
|
Most Recent Note - 8/10/2022 7:04:43 PM
G - Hit another new high with today's gain above its "max buy" level backed by near average volume, and its color code is changed to green. Prior highs in the $31 area define initial support to watch on pullbacks.
>>> FEATURED STOCK ARTICLE : Breakout for New High Backed by +52% Above Average Volume - 8/8/2022 |
View all notes |
Set NEW NOTE alert |
Company Profile |
SEC
News |
Chart |
Request a new note
C
A
S
I |
CLH
-
NYSE
Clean Harbors Inc
Pollution Control
|
$112.65
|
+2.96
2.70% |
$113.10
|
439,930
140.11% of 50 DAV
50 DAV is 314,000
|
$118.89
-5.25%
|
8/10/2022
|
$111.78
|
PP = $115.10
|
|
MB = $120.86
|
Most Recent Note - 8/10/2022 6:57:40 PM
Y - Posted a solid volume-driven gain today and finished in the upper third of its intra-day range after highlighted in yellow in the earlier mid-day report with pivot point cited based on its 4/01/22 high plus 10 cents. A subsequent gain above the pivot point backed by at least +40% above average volume may trigger a technical buy signal. Holding its ground after recent volume-driven gains approaching its April high ($115) and all-time high. Little resistance remains due to overhead supply up to the $118 level. Reported Jun '22 quarterly earnings +105% on +46% sales revenues versus the year ago period. Prior quarters showed a strong earnings track record with earnings above the +25% minimum guideline (C criteria). Annual earnings (A criteria) growth has been strong and steady. See the latest FSU analysis for more details and a new annotated graph.
>>> FEATURED STOCK ARTICLE : Pollution Control Firm Perched Near Prior High - 8/10/2022 |
View all notes |
Set NEW NOTE alert |
Company Profile |
SEC
News |
Chart |
Request a new note
C
A
S
I |
|
|
|
THESE ARE NOT BUY RECOMMENDATIONS!
Comments contained in the body of this report are technical
opinions only. The material herein has been obtained
from sources believed to be reliable and accurate, however,
its accuracy and completeness cannot be guaranteed.
This site is not an investment advisor, hence it does
not endorse or recommend any securities or other investments.
Any recommendation contained in this report may not
be suitable for all investors and it is not to be deemed
an offer or solicitation on our part with respect to
the purchase or sale of any securities. All trademarks,
service marks and trade names appearing in this report
are the property of their respective owners, and are
likewise used for identification purposes only.
This report is a service available
only to active Paid Premium Members.
You may opt-out of receiving report notifications
at any time. Questions or comments may be submitted
by writing to Premium Membership Services 665 S.E. 10 Street, Suite 201 Deerfield Beach, FL 33441-5634 or by calling 1-800-965-8307
or 954-785-1121.
|
|
|