You are not logged in.
This means you
CAN ONLY VIEW reports that were published prior to Thursday, March 20, 2025.
You
MUST UPGRADE YOUR MEMBERSHIP if you want to see any current reports.
AFTER MARKET UPDATE - FRIDAY, AUGUST 18TH, 2023
Previous After Market Report Next After Market Report >>>
|
|
|
|
DOW |
+25.83 |
34,500.66 |
+0.07% |
|
Volume |
958,951,881 |
+8% |
|
Volume |
4,816,923,900 |
-10% |
|
NASDAQ |
-26.16 |
13,290.78 |
-0.20% |
|
Advancers |
1,582 |
56% |
|
Advancers |
2,282 |
53% |
|
S&P 500 |
-0.65 |
4,369.71 |
-0.01% |
|
Decliners |
1,222 |
44% |
|
Decliners |
2,007 |
47% |
|
Russell 2000 |
+9.36 |
1,859.42 |
+0.51% |
|
52 Wk Highs |
17 |
|
|
52 Wk Highs |
33 |
|
|
S&P 600 |
+5.31 |
1,201.38 |
+0.44% |
|
52 Wk Lows |
87 |
|
|
52 Wk Lows |
263 |
|
|
 |
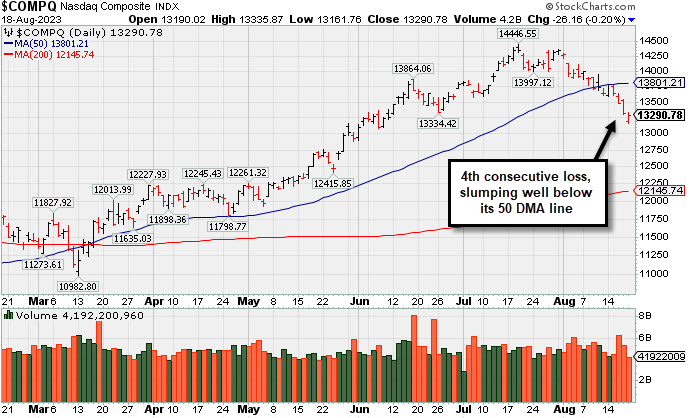
Major Indices Sputtered With Small Caps Outperforming Peers
Kenneth J. Gruneisen - Passed the CAN SLIM® Master's Exam
The S&P 500 closed flat, the Nasdaq fell 0.2%, and the Dow Jones Industrial Average rose 0.1%. The Russell 2000 had a slightly better session, gaining 0.5%. Volume totals reported were mixed, higher than the prior session on the NYSE and lighter on the Nasdaq exchange. Advancers led decliners by a 4-3 margin on the NYSE and by a very narrow margin on the Nasdaq exchange. There were only 3 high-ranked companies from the Leaders List that hit a new 52-week high and were listed on the BreakOuts Page, versus the total of 4 on the prior session. New 52-week lows totals solidly outnumbered new 52-week highs totals on both the NYSE and on the Nasdaq exchange. The major indices are in a correction (M criteria). Leadership has quickly evaporated as indicated by waning new highs totals on both major exchanges. New buying efforts should be avoided until a new confirmed rally marked by a solid follow-through day.
PICTURED: The Nasdaq Composite Index suffered a 4th consecutive loss, slumping well below its 50-day moving average (DMA) line.
Initial weakness was driven by losses in mega-cap stocks, worries about China after property developer Evergrande filed for Chapter 15 bankruptcy protection in the U.S., and carryover downside momentum after the persistent selling in August.
Six of the 11 S&P 500 sectors closed in the green. Energy (+0.9%) was a leading gainer while communication services (-1.0%) was the weakest sector. On the earnings front, Deere (DE -5.3%) fell despite beating EPS expectations for Q3 and raising its net income guidance. Applied Materials (AMAT +3.7%) logged a gain after its earnings report beat Q3 expectations and it issued above-consensus EPS guidance for Q4.
Treasuries settled with gains across the curve. The 2-yr note yield fell five basis points to 4.91%. The 10-yr note yield fell six basis points to 4.25%.
|
 Kenneth J. Gruneisen started out as a licensed stockbroker in August 1987, a couple of months prior to the historic stock market crash that took the Dow Jones Industrial Average down -22.6% in a single day. He has published daily fact-based fundamental and technical analysis on high-ranked stocks online for two decades. Through FACTBASEDINVESTING.COM, Kenneth provides educational articles, news, market commentary, and other information regarding proven investment systems that work in good times and bad.
Comments contained in the body of this report are technical opinions only and are not necessarily those of Gruneisen Growth Corp. The material herein has been obtained from sources believed to be reliable and accurate, however, its accuracy and completeness cannot be guaranteed. Our firm, employees, and customers may effect transactions, including transactions contrary to any recommendation herein, or have positions in the securities mentioned herein or options with respect thereto. Any recommendation contained in this report may not be suitable for all investors and it is not to be deemed an offer or solicitation on our part with respect to the purchase or sale of any securities. |
|
 |
Broker/Dealer, Tech, and Energy-Linked Groups Rose
Kenneth J. Gruneisen - Passed the CAN SLIM® Master's Exam
The Semiconductor Index ($SOX +0.48%) and the Networking Index ($NWX +0.41%) both posted modest gains on Friday while the Biotech Index ($BTK -0.16%) inched lower. The Broker/Dealer Index ($XBD +1.89%) posted a solid gain while the Bank Index ($BKX -0.43%) edged lower. Commodity-linked groups were mixed as the Gold & Silver Index ($XAU -0.61%) edged lower while the Oil Services Index ($OSX +1.04%) and the Integrated Oil Index ($XOI +0.91%) both posted gains.
PICTURED: The Oil Services Index ($OSX +1.04%) is consolidating well above its 50-day and 200-day moving average (DMA) lines.
| Oil Services |
$OSX |
92.07 |
+0.95 |
+1.04% |
+9.79% |
| Integrated Oil |
$XOI |
1,869.96 |
+16.83 |
+0.91% |
+4.63% |
| Semiconductor |
$SOX |
3,462.74 |
+16.38 |
+0.48% |
+36.75% |
| Networking |
$NWX |
777.76 |
+3.18 |
+0.41% |
-0.71% |
| Broker/Dealer |
$XBD |
493.76 |
+9.16 |
+1.89% |
+9.94% |
| Retail |
$RLX |
3,536.80 |
-2.48 |
-0.07% |
+28.42% |
| Gold & Silver |
$XAU |
111.68 |
-0.69 |
-0.61% |
-7.60% |
| Bank |
$BKX |
81.78 |
-0.35 |
-0.43% |
-18.91% |
| Biotech |
$BTK |
5,157.66 |
-8.01 |
-0.16% |
-2.34% |
|
|
|
 |
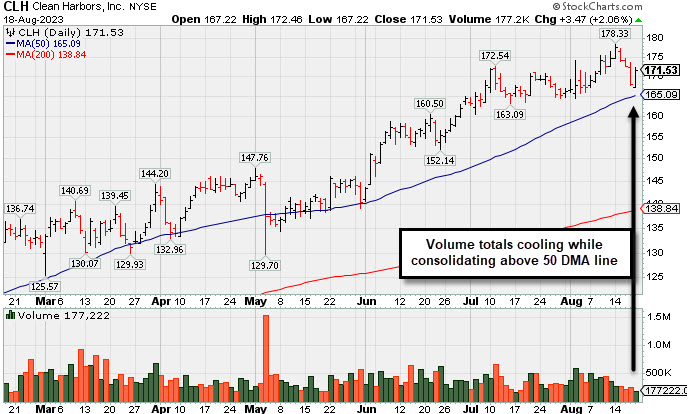
Volume Totals Have Been Cooling While Hovering Near High
Kenneth J. Gruneisen - Passed the CAN SLIM® Master's Exam
Clean Harbors Inc (CLH +$3.47 or +2.06% to $171.53) has seen volume totals cooling while consolidating near its all-time high. Its 50-day moving average (DMA) line ($165) defines important near-term support to watch on pullbacks. Recentlyu reported earnings for the Jun '23 quarter -13% on +3% sales revenues versus the year-ago period, below the +25% minimum earnings guideline (C criteria), raising fundamental concerns. CLH has seen its Earnings Per Share Rating slump to 94 from 99. Prior quarters showed a strong earnings track record with earnings above the +25% minimum guideline (C criteria). Annual earnings (A criteria) growth has been strong and steady.
There are only 54.1 million shares outstanding (S criteria), which can contribute to greater price volatility in the event of institutional buying or selling. The number of top-rated funds owning its shares rose from 590 in Sep '21 to 774 in Jun '23, a reassuring sign concerning the I criteria. The current Up/Down Volume Ratio of 1.3 is an unbiased indication its shares have been under accumulation over the past 50 days. It has a Timeliness Rating of B , a Sponsorship Rating of C, and an Accumulation Distribution Rating of B.
|
|
|
Color Codes Explained :
Y - Better candidates highlighted by our
staff of experts.
G - Previously featured
in past reports as yellow but may no longer be buyable under the
guidelines.
***Last / Change / Volume data in this table is the closing quote data***
Symbol/Exchange
Company Name
Industry Group |
PRICE |
CHANGE
(%Change) |
Day High |
Volume
(% DAV)
(% 50 day avg vol) |
52 Wk Hi
% From Hi |
Featured
Date |
Price
Featured |
Pivot Featured |
|
Max Buy |
 STRL
-
NASDAQ
STRL
-
NASDAQ
Sterling Infrastructure
Bldg-Heavy Construction
|
$75.24
|
-5.25
-6.52% |
$80.96
|
709,978
175.30% of 50 DAV
50 DAV is 405,000
|
$83.81
-10.23%
|
12/14/2022
|
$32.41
|
PP = $33.72
|
|
MB = $35.41
|
 Most Recent Note - 8/17/2023 5:42:08 PM
G - Abruptly retreated from its all-time high with today's big volume-driven loss. It is very extended from any sound base. Jun '23 quarterly earnings rose +37% on +13% sales revenues versus the year-ago period.
>>> FEATURED STOCK ARTICLE : Volume-Driven Gains Leave Construction Firm at All-Time High - 8/9/2023 |
View all notes |
Set NEW NOTE alert |
Company Profile |
SEC
News |
Chart |
Request a new note
C
A
S
I |
FIX
-
NYSE
Comfort Systems USA
Bldg-A/C and Heating Prds
|
$173.76
|
-5.33
-2.98% |
$179.61
|
195,056
90.30% of 50 DAV
50 DAV is 216,000
|
$182.94
-5.02%
|
4/27/2023
|
$148.85
|
PP = $152.23
|
|
MB = $159.84
|
Most Recent Note - 8/14/2023 5:56:20 PM
G - Holding its ground near its all-time high, extended from any sound base. Its 50 DMA line ($166) defines important near-term support to watch on pullbacks. Reported Jun '23 quarterly earnings +65% on +27% versus the year-ago period.
>>> FEATURED STOCK ARTICLE : Pulled Back From High With Lighter Volume - 7/19/2023 |
View all notes |
Set NEW NOTE alert |
Company Profile |
SEC
News |
Chart |
Request a new note
C
A
S
I |
KOF
-
NYSE
Coca-Cola Femsa ADR
Beverages-Non-Alcoholic
|
$84.46
|
+0.46
0.55% |
$84.91
|
163,619
109.08% of 50 DAV
50 DAV is 150,000
|
$91.23
-7.42%
|
6/9/2023
|
$88.61
|
PP = $91.33
|
|
MB = $95.90
|
Most Recent Note - 8/14/2023 6:01:39 PM
G - Posted a small gain today with +110% above average volume. A rebound above the 50 DMA line ($84.31) is still needed for its outlook to improve but that short-term average recently has acted as resistance. Its Relative Strength Rating is currently 81. Reported Jun '23 quarterly earnings +23% on +26% sales revenues versus the year-ago period, below the +25% minimum guideline (C criteria).
>>> FEATURED STOCK ARTICLE : 50-Day Moving Average Line has Acted as Resistance - 8/10/2023 |
View all notes |
Set NEW NOTE alert |
Company Profile |
SEC
News |
Chart |
Request a new note
C
A
S
I |
CLH
-
NYSE
Clean Harbors
Pollution Control
|
$168.06
|
-4.67
-2.70% |
$173.54
|
249,457
64.63% of 50 DAV
50 DAV is 386,000
|
$178.33
-5.76%
|
3/10/2023
|
$136.89
|
PP = $136.74
|
|
MB = $143.58
|
Most Recent Note - 8/15/2023 6:07:25 PM
G - Pulled back today with light volume, retreating from its all-time high. Its 50 DMA line ($164) defines important near-term support to watch on pullbacks. Reported earnings for the Jun '23 quarter -13% on +3% sales revenues versus the year-ago period, below the +25% minimum earnings guideline (C criteria), raising fundamental concerns.
>>> FEATURED STOCK ARTICLE : Negative Reversal at High After +26% Rally in 4 Months - 7/18/2023 |
View all notes |
Set NEW NOTE alert |
Company Profile |
SEC
News |
Chart |
Request a new note
C
A
S
I |
HUBB
-
NYSE
Hubbell
Electrical-Power/Equipmt
|
$300.61
|
-5.91
-1.93% |
$308.63
|
312,513
73.19% of 50 DAV
50 DAV is 427,000
|
$340.06
-11.60%
|
4/25/2023
|
$262.85
|
PP = $257.51
|
|
MB = $270.39
|
Most Recent Note - 8/15/2023 6:08:13 PM
G - Still lingering below its 50 DMA line ($318.73). A rebound above the 50 DMA line is needed for its outlook to improve. Fundamentals remain strong after Jun '23 earnings rose +45% on +9% sales revenues versus the year-ago period.
>>> FEATURED STOCK ARTICLE : Pulled Back Undercutting 50 Day Moving Average Line - 7/26/2023 |
View all notes |
Set NEW NOTE alert |
Company Profile |
SEC
News |
Chart |
Request a new note
C
A
S
I |
Symbol/Exchange
Company Name
Industry Group |
PRICE |
CHANGE
(%Change) |
Day High |
Volume
(% DAV)
(% 50 day avg vol) |
52 Wk Hi
% From Hi |
Featured
Date |
Price
Featured |
Pivot Featured |
|
Max Buy |
NVR
-
NYSE
NVR
Bldg-Resident/Comml
|
$6,022.00
|
-125.94
-2.05% |
$6,187.28
|
24,238
127.57% of 50 DAV
50 DAV is 19,000
|
$6,474.53
-6.99%
|
4/25/2023
|
$5,882.18
|
PP = $5,978.25
|
|
MB = $6,277.16
|
Most Recent Note - 8/16/2023 5:55:08 PM
G - Still consolidating near its 50 DMA line ($6,186). Reported Jun '23 quarterly earnings -6% on -13% sales revenues, its 2nd subpar quarter, raising greater fundamental concerns.
>>> FEATURED STOCK ARTICLE : Consolidating Above 50 DMA After 2nd Subpar Earnings Report - 8/7/2023 |
View all notes |
Set NEW NOTE alert |
Company Profile |
SEC
News |
Chart |
Request a new note
C
A
S
I |
PHM
-
NYSE
PulteGroup
Bldg-Resident/Comml
|
$78.79
|
-3.77
-4.57% |
$83.44
|
2,990,686
115.47% of 50 DAV
50 DAV is 2,590,000
|
$86.16
-8.55%
|
4/25/2023
|
$65.17
|
PP = $64.01
|
|
MB = $67.21
|
Most Recent Note - 8/17/2023 5:47:28 PM
G - Volume was +17% above average behind today's big loss violating its 50 DMA line ($79.24) triggering a technical sell signal. Recently reported earnings +18% for the Jun '23 quarter versus the year-ago period, below the +25% minimum guideline (C criteria) raising concerns.
>>> FEATURED STOCK ARTICLE : Reversed After Reaching a New All-Time High - 7/27/2023 |
View all notes |
Set NEW NOTE alert |
Company Profile |
SEC
News |
Chart |
Request a new note
C
A
S
I |
AMPH
-
NASDAQ
Amphastar Pharm
Medical-Biomed/Biotech
|
$53.01
|
-3.04
-5.42% |
$56.05
|
432,171
93.95% of 50 DAV
50 DAV is 460,000
|
$67.66
-21.65%
|
5/15/2023
|
$43.56
|
PP = $44.15
|
|
MB = $46.36
|
Most Recent Note - 8/17/2023 5:45:35 PM
G - Slumped further below its 50 DMA line ($56.79) with today's loss and closed near the session low raising concerns. Fundamentals remain strong after it reported Jun '23 quarterly earnings +67% on +18% sales revenues versus the year-ago period.
>>> FEATURED STOCK ARTICLE : 6th Straight Gain for Amphastar - 7/20/2023 |
View all notes |
Set NEW NOTE alert |
Company Profile |
SEC
News |
Chart |
Request a new note
C
A
S
I |
ANET
-
NYSE
Arista Networks
Computer-Networking
|
$182.76
|
+1.39
0.77% |
$184.82
|
2,836,814
87.77% of 50 DAV
50 DAV is 3,232,000
|
$190.65
-4.14%
|
8/1/2023
|
$188.84
|
PP = $178.46
|
|
MB = $187.38
|
Most Recent Note - 8/14/2023 5:53:20 PM
Y - Posted a gain today with light volume. Volume totals have been cooling while hovering near the prior high and pivot point. Bullish action came after it reported Jun '23 quarterly earnings +40% on +39% sales revenues versus the year-ago period. See the latest FSU analysis for more details and a new annotated graph.
>>> FEATURED STOCK ARTICLE : Hovering Near High with Volume Totals Cooling - 8/14/2023 |
View all notes |
Set NEW NOTE alert |
Company Profile |
SEC
News |
Chart |
Request a new note
C
A
S
I |
LSCC
-
NASDAQ
Lattice Semiconductor
Elec-Semicondctor Fablss
|
$86.57
|
-0.42
-0.48% |
$87.44
|
1,452,729
82.35% of 50 DAV
50 DAV is 1,764,000
|
$98.18
-11.83%
|
6/13/2023
|
$91.73
|
PP = $96.92
|
|
MB = $101.77
|
Most Recent Note - 8/17/2023 5:43:53 PM
G - Posted a 3rd consecutive small loss today with light volume, sputtering below its 50 DMA line ($89.94) which may act as resistance. Subsequent gains above the 50 DMA line are needed for its outlook to improve. Reported Jun '23 quarterly earnings +24% on +18% sales revenues versus the year-ago period, just below the +25% minimum earnings guideline (C criteria). See the latest FSU analysis for more details and a new annotated graph.
>>> FEATURED STOCK ARTICLE : Rebound Needed Above 50-Day Moving Average for Lattice - 8/17/2023 |
View all notes |
Set NEW NOTE alert |
Company Profile |
SEC
News |
Chart |
Request a new note
C
A
S
I |
Symbol/Exchange
Company Name
Industry Group |
PRICE |
CHANGE
(%Change) |
Day High |
Volume
(% DAV)
(% 50 day avg vol) |
52 Wk Hi
% From Hi |
Featured
Date |
Price
Featured |
Pivot Featured |
|
Max Buy |
XPEL
-
NASDAQ
XPEL
Auto/Truck-Replace Parts
|
$82.95
|
-0.47
-0.56% |
$83.89
|
113,837
85.59% of 50 DAV
50 DAV is 133,000
|
$87.46
-5.16%
|
6/28/2023
|
$83.14
|
PP = $87.11
|
|
MB = $91.47
|
Most Recent Note - 8/11/2023 5:17:11 PM
G - Posted another solid gain today, promptly rebounding well above its 50 DMA line ($80.27), showing resilience after triggering a technical sell signal on 8/09/23. Faces little resistance due to overhead supply up to the $87 level. Reported Jun '23 quarterly earnings +33% on +22% sales revenues versus the year-ago period. Volume and volatility often increase near earnings news.
>>> FEATURED STOCK ARTICLE : Consolidating After Rebounding Above 50-Day Moving Average - 8/2/2023 |
View all notes |
Set NEW NOTE alert |
Company Profile |
SEC
News |
Chart |
Request a new note
C
A
S
I |
ESQ
-
NASDAQ
Esquire Finl Hldgs
Finance-Commercial Loans
|
$47.93
|
-0.27
-0.56% |
$48.60
|
11,261
38.83% of 50 DAV
50 DAV is 29,000
|
$54.03
-11.29%
|
7/14/2023
|
$45.80
|
PP = $48.23
|
|
MB = $50.64
|
Most Recent Note - 8/15/2023 6:04:08 PM
Y - Volume was below average behind today's 3rd consecutive loss. Testing prior highs in the $47 area defining important near-term support coinciding with its 50 DMA line. See the latest FSU analysis for more details and a new annotated graph.
>>> FEATURED STOCK ARTICLE : Pullback with Light Volume Testing Important Support Level - 8/15/2023 |
View all notes |
Set NEW NOTE alert |
Company Profile |
SEC
News |
Chart |
Request a new note
C
A
S
I |
MEDP
-
NASDAQ
Medpace Holdings
Medical-Research Eqp/Svc
|
$253.59
|
-1.98
-0.77% |
$257.19
|
190,917
50.24% of 50 DAV
50 DAV is 380,000
|
$269.44
-5.88%
|
7/25/2023
|
$196.32
|
PP = $241.57
|
|
MB = $253.65
|
Most Recent Note - 8/16/2023 5:53:55 PM
Y - Color code is changed to yellow after pulling back below its "max buy" level with today's 4th consecutive loss with below average volume. Prior highs in the $241 area define support to watch above its 50 DMA line ($241). Reported earnings increases above the +25% minimum earnings guideline (C criteria) in the past 5 quarterly comparisons through Jun '23.
>>> FEATURED STOCK ARTICLE : Medpace Posted a Solid Volume-Driven Gain for a New High - 7/25/2023 |
View all notes |
Set NEW NOTE alert |
Company Profile |
SEC
News |
Chart |
Request a new note
C
A
S
I |
COKE
-
NASDAQ
Coca-Cola Consolidated
Beverages-Non-Alcoholic
|
$689.88
|
-24.31
-3.40% |
$713.66
|
37,580
89.48% of 50 DAV
50 DAV is 42,000
|
$745.53
-7.46%
|
8/3/2023
|
$718.56
|
PP = $694.30
|
|
MB = $729.02
|
Most Recent Note - 8/17/2023 5:49:57 PM
G - Volume was below average behind today's 4th consecutive loss, slumping from its all-time high and back below its pivot point raising concerns. Fundamentals remain strong
>>> FEATURED STOCK ARTICLE : Powerful Breakout for COKE - 8/3/2023 |
View all notes |
Set NEW NOTE alert |
Company Profile |
SEC
News |
Chart |
Request a new note
C
A
S
I |
PLUS
-
NASDAQ
ePlus
Computer-Tech Services
|
$62.74
|
-0.48
-0.76% |
$63.82
|
125,649
108.32% of 50 DAV
50 DAV is 116,000
|
$75.90
-17.34%
|
8/8/2023
|
$67.60
|
PP = $62.92
|
|
MB = $66.07
|
Most Recent Note - 8/16/2023 5:58:24 PM
Y - Pulled back today for a 4th consecutive loss with near average volume, consolidating since a noted "breakaway gap" on 8/08/23. Reported earnings +42% on +25% sales revenues for the Jun '23 quarter versus the year ago period, its 3rd consecutive quarterly earnings increase above the +25% minimum guideline (C criteria) helping it better match the winning models of the fact-based investment system. Annual earnings growth (A criteria) has been strong.
>>> FEATURED STOCK ARTICLE : ePLUS Gapped Up but Ended in Lower Half of Intra-Day Range - 8/8/2023 |
View all notes |
Set NEW NOTE alert |
Company Profile |
SEC
News |
Chart |
Request a new note
C
A
S
I |
Symbol/Exchange
Company Name
Industry Group |
PRICE |
CHANGE
(%Change) |
Day High |
Volume
(% DAV)
(% 50 day avg vol) |
52 Wk Hi
% From Hi |
Featured
Date |
Price
Featured |
Pivot Featured |
|
Max Buy |
|
|
|
THESE ARE NOT BUY RECOMMENDATIONS!
Comments contained in the body of this report are technical
opinions only. The material herein has been obtained
from sources believed to be reliable and accurate, however,
its accuracy and completeness cannot be guaranteed.
This site is not an investment advisor, hence it does
not endorse or recommend any securities or other investments.
Any recommendation contained in this report may not
be suitable for all investors and it is not to be deemed
an offer or solicitation on our part with respect to
the purchase or sale of any securities. All trademarks,
service marks and trade names appearing in this report
are the property of their respective owners, and are
likewise used for identification purposes only.
This report is a service available
only to active Paid Premium Members.
You may opt-out of receiving report notifications
at any time. Questions or comments may be submitted
by writing to Premium Membership Services 665 S.E. 10 Street, Suite 201 Deerfield Beach, FL 33441-5634 or by calling 1-800-965-8307
or 954-785-1121.
|
|
|