You are not logged in.
This means you
CAN ONLY VIEW reports that were published prior to Saturday, March 29, 2025.
You
MUST UPGRADE YOUR MEMBERSHIP if you want to see any current reports.
AFTER MARKET UPDATE - FRIDAY, MARCH 10TH, 2023
Previous After Market Report Next After Market Report >>>
|
|
|
|
DOW |
-345.22 |
31,909.64 |
-1.07% |
|
Volume |
1,197,073,864 |
+22% |
|
Volume |
6,151,651,800 |
+21% |
|
NASDAQ |
-199.47 |
11,138.89 |
-1.76% |
|
Advancers |
408 |
14% |
|
Advancers |
824 |
18% |
|
S&P 500 |
-56.73 |
3,861.59 |
-1.45% |
|
Decliners |
2,498 |
86% |
|
Decliners |
3,664 |
82% |
|
Russell 2000 |
-21.78 |
1,772.70 |
-1.21% |
|
52 Wk Highs |
25 |
|
|
52 Wk Highs |
37 |
|
|
S&P 600 |
-30.00 |
1,172.34 |
-2.50% |
|
52 Wk Lows |
209 |
|
|
52 Wk Lows |
547 |
|
|
Damaging losses on Thursday and Friday signaled a shift from the prior market uptrend (M criteria) to an uptrend under pressure and then quickly to a "market correction". Disciplined investors know to reduce market exposure by selling any weakening stocks on a case-by-case basis.
|
 |
Decisive Downturn Signals Market Correction Taking Hold
Kenneth J. Gruneisen - Passed the CAN SLIM® Master's Exam
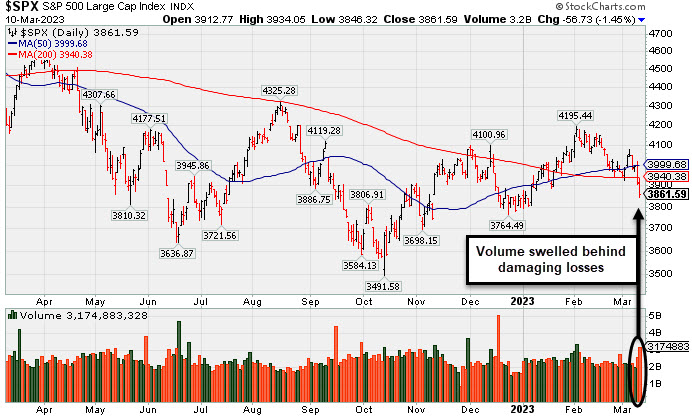
The Dow lost 345 points (-1.1%), while the Nasdaq Composite decreased 1.8%. The S&P 500 declined 1.5%. All three major averages notched weekly declines with the Dow down 4.4%, the NASDAQ down 4.7%, and the S&P 500 down 4.6%. Volume totals on Friday were higher than the prior session on the NYSE and on the Nasdaq exchange, indicating more intense selling pressure coming from the institutional crowd. Breadth was clearly negative as decliners led advancers by more than 6-1 on the NYSE and by more than 4-1 on the Nasdaq exchange. There were only 2 high-ranked companies from the Leaders List that hit new 52-week highs and were listed on the BreakOuts Page, versus 16 on the prior session. New 52-week lows totals swelled and outnumbered new 52-week highs on the NYSE and on the Nasdaq exchange. The evaporation of leadership and damaging losses late this week signaled that the major indices are in a market correction (M criteria). Disciplined investors know that in a market correction it is best to avoid new buying efforts and raise safe cash.
PICTURED: The S&P 500 Index suffered a big 2nd consecutive loss with higher volume while violating its 200-day moving average (DMA) line.
All eleven sectors finished in negative territory as U.S. equities closed lower Friday. February’s jobs data and the turmoil seen in the financial sector raised concerns. Early Friday, the Federal Deposit Insurance Corporation (FDIC) announced the closure of Silicon Valley Bank and the creation of the Deposit Insurance National Bank of Santa Clara where all insured deposits have been transferred. As a result, parent company, SVB Financial Group (SIVB) halted trading after the stock plummeted 63% in premarket trading following reports of Silicon Valley Bank being the second-biggest bank failure in history.
On the data front, February’s nonfarm payrolls came in better-than-expected at 311,000, down from last month’s revised 504,000 print. Similarly, private payrolls rose more than expected adding 265,000 new jobs, down from January’s revised 386,000. Meanwhile, unemployment ticked higher to 3.6% while average hourly earnings growth moved lower signaling the labor market might be loosening up.
Treasuries strengthened, with the yield on the benchmark 10-year note decreasing 24 basis points (0.24%) to 3.68% while the 30-year bond yield lost 19 basis points (0.19%) to 3.68%. The yield on the two-year note declined 31 basis points (0.31%) to 4.58%, posting its largest decline in decades. In commodities, West Texas Intermediate (WTI) crude increased 1.1% to $76.53/barrel after Saudi Arabia and Iran re-established ties after days of undisclosed meetings in Beijing. Elsewhere, U.S. President Joe Biden proposed budget cuts which would scrap billions of dollars in industry subsidies.
|
 Kenneth J. Gruneisen started out as a licensed stockbroker in August 1987, a couple of months prior to the historic stock market crash that took the Dow Jones Industrial Average down -22.6% in a single day. He has published daily fact-based fundamental and technical analysis on high-ranked stocks online for two decades. Through FACTBASEDINVESTING.COM, Kenneth provides educational articles, news, market commentary, and other information regarding proven investment systems that work in good times and bad.
Comments contained in the body of this report are technical opinions only and are not necessarily those of Gruneisen Growth Corp. The material herein has been obtained from sources believed to be reliable and accurate, however, its accuracy and completeness cannot be guaranteed. Our firm, employees, and customers may effect transactions, including transactions contrary to any recommendation herein, or have positions in the securities mentioned herein or options with respect thereto. Any recommendation contained in this report may not be suitable for all investors and it is not to be deemed an offer or solicitation on our part with respect to the purchase or sale of any securities. |
|
 |
Financial, Retail, Tech, and Energy-Linked Groups Fell
Kenneth J. Gruneisen - Passed the CAN SLIM® Master's Exam
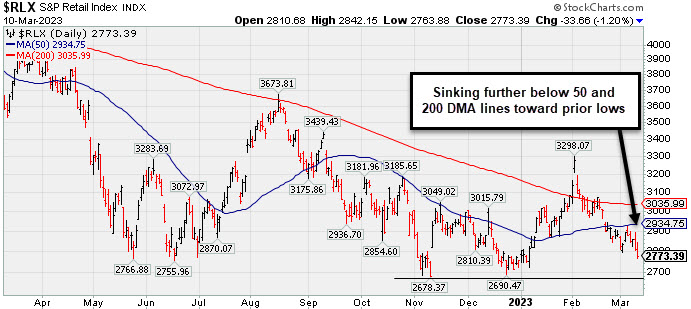
The Broker/Dealer Index ($XBD -4.32%) and Bank Index ($BKX -3.91%), both important leading indicators, suffered big losses and weighed on the major averages on Friday. The Retail Index ($RLX -1.20%) lost ground and the tech sector also had a negative bias as the Semiconductor Index ($SOX -1.89%), Networking Index ($NWX -1.24%), and Biotech Index ($BTK -1.33%) suffered unanimous losses. Commodity-linked groups were mixed as the Oil Services Index ($OSX -2.34%) and Integrated Oil Index ($XOI -1.25%) both lost ground while the Gold & Silver Index ($XAU +0.96%) posted a standout gain on the widely negative session.
PICTURED: The Retail Index ($RLX -1.20%) has been slumping well below its 50-day and 200-day moving average (DMA) lines toward the prior lows. Consumer spending accounts for about 2/3 of the US economy, so the weak action bodes poorly for the broader market outlook.
| Oil Services |
$OSX |
82.34 |
-1.97 |
-2.34% |
-1.82% |
| Integrated Oil |
$XOI |
1,722.80 |
-21.78 |
-1.25% |
-3.61% |
| Semiconductor |
$SOX |
2,923.93 |
-56.28 |
-1.89% |
+15.47% |
| Networking |
$NWX |
808.14 |
-10.17 |
-1.24% |
+3.17% |
| Broker/Dealer |
$XBD |
452.43 |
-20.43 |
-4.32% |
+0.74% |
| Retail |
$RLX |
2,773.39 |
-33.66 |
-1.20% |
+0.70% |
| Gold & Silver |
$XAU |
111.59 |
+1.06 |
+0.96% |
-7.67% |
| Bank |
$BKX |
92.22 |
-3.75 |
-3.91% |
-8.56% |
| Biotech |
$BTK |
5,056.87 |
-68.28 |
-1.33% |
-4.25% |
|
|
|
 |
Pullback to Support Marked Secondary Buy Point; Market Concerns Rose
Kenneth J. Gruneisen - Passed the CAN SLIM® Master's Exam
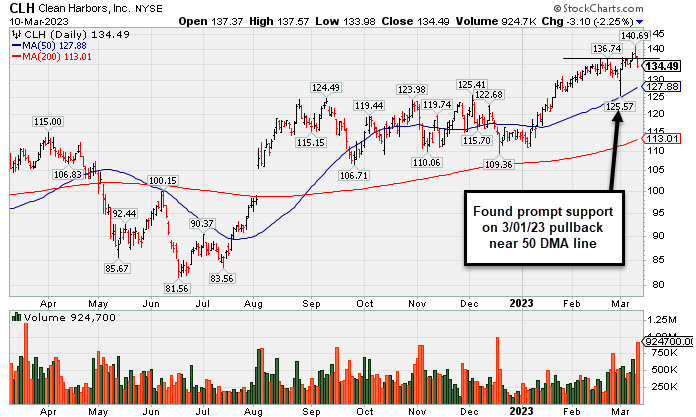
Clean Harbors Inc (CLH -$3.10 or -2.25% to $134.49) was highlighted in yellow in the earlier mid-day report (read here) as a valid secondary buy point exists up to 5% above the recent high following a pullback to support at the 10 WMA line after an earlier breakout. It pulled back on earnings news but found prompt support with a "positive reversal" on 3/01/23. Fundamentals remain strong. There was a "negative reversal" on the prior session at its all-time high. Quickly eroding market conditions (M criteria) also raised a caution flag late this week, hurting the outlook for any new buying efforts.
Its 50-day moving average (DMA) line ($128) defines near-term support above prior highs in the $125 area. CLH was last shown in greater detail on 11/29/22 with an annotated graph under the headline, "Volume-Driven Losses Undercut 50-Day Moving Average". It showed resilience since dropped from the Featured Stocks list on 12/29/22.
CLH has an Earnings Per Share Rating of 99. It reported Dec '22 quarterly earnings +62% on +14% sales revenues versus the year ago period. Volume and volatility often increase near earnings news. Prior quarters showed a strong earnings track record with earnings above the +25% minimum guideline (C criteria). Annual earnings (A criteria) growth has been strong and steady.
There are only 54.1 million shares outstanding (S criteria), which can contribute to greater price volatility in the event of institutional buying or selling. The number of top-rated funds owning its shares rose from 590 in Sep '21 to 702 in Dec '22, a reassuring sign concerning the I criteria. The current Up/Down Volume Ratio of 1.5 is an unbiased indication its shares have been under distributional pressure over the past 50 days. It has a Timeliness Rating of A and a Sponsorship rating of C, but an Accumulation Distribution Rating of B-.
|
|
|
Color Codes Explained :
Y - Better candidates highlighted by our
staff of experts.
G - Previously featured
in past reports as yellow but may no longer be buyable under the
guidelines.
***Last / Change / Volume data in this table is the closing quote data***
Symbol/Exchange
Company Name
Industry Group |
PRICE |
CHANGE
(%Change) |
Day High |
Volume
(% DAV)
(% 50 day avg vol) |
52 Wk Hi
% From Hi |
Featured
Date |
Price
Featured |
Pivot Featured |
|
Max Buy |
 CMC
-
NYSE
CMC
-
NYSE
Commercial Metals Co
METALS and MINING - Steel and Iron
|
$47.91
|
-2.65
-5.24% |
$50.81
|
1,775,822
164.28% of 50 DAV
50 DAV is 1,081,000
|
$58.09
-17.52%
|
10/14/2022
|
$41.61
|
PP = $44.45
|
|
MB = $46.67
|
 Most Recent Note - 3/10/2023 4:54:11 PM
Volume was above average behind today's big loss while slumping further below its 50 DMA line ($53.34). It also violated the recent low ($50.90 on 2/24/23) raising greater concerns and triggering a more worrisome technical sell signal. A rebound above the 50 DMA line is needed for its outlook to improve. It will be dropped from the Featured Stocks list tonight.
>>> FEATURED STOCK ARTICLE : Sputtering Below 50-Day Moving Average Line Again - 3/6/2023 |
View all notes |
Set NEW NOTE alert |
Company Profile |
SEC
News |
Chart |
Request a new note
C
A
S
I |
GPK
-
NYSE
Graphic Packaging Hldg
CONSUMER NON-DURABLES - Packaging and Containers
|
$23.76
|
-0.86
-3.49% |
$24.54
|
3,619,051
114.71% of 50 DAV
50 DAV is 3,155,000
|
$25.17
-5.60%
|
10/25/2022
|
$22.75
|
PP = $24.17
|
|
MB = $25.38
|
Most Recent Note - 3/10/2023 4:58:21 PM
Y - Pulled back below the pivot point raising concerns with today's 3rd consecutive loss backed by higher volume. Posted a solid gain on 3/07/23, breaking into new all-time high territory with volume +39% above average and was previously noted - "It has the look of a solid technical breakout, but the fact-based investment system's most successful breakouts that went on to produce big gains flashed much heavier volume behind gains as a buy signal."
>>> FEATURED STOCK ARTICLE : Quietly Lingering Near High With Strong Fundamentals - 2/27/2023 |
View all notes |
Set NEW NOTE alert |
Company Profile |
SEC
News |
Chart |
Request a new note
C
A
S
I |
TITN
-
NASDAQ
Titan Machinery Inc
SPECIALTY RETAIL
|
$43.43
|
-3.06
-6.58% |
$46.63
|
477,361
216.98% of 50 DAV
50 DAV is 220,000
|
$47.87
-9.28%
|
1/13/2023
|
$40.10
|
PP = $44.45
|
|
MB = $46.67
|
Most Recent Note - 3/10/2023 5:07:49 PM
Y - Pulled back today for a damaging 3rd consecutive volume-driven loss, testing support at its 50 DMA line ($43.35). Color code was changed to yellow after retreating below its "max buy" level. More damaging losses may raise concerns and trigger a technical sell signal.
>>> FEATURED STOCK ARTICLE : Pulled Back from New All-Time High - 2/28/2023 |
View all notes |
Set NEW NOTE alert |
Company Profile |
SEC
News |
Chart |
Request a new note
C
A
S
I |
STRL
-
NASDAQ
Sterling Infrastructure
MATERIALS and; CONSTRUCTION - Heavy Construction
|
$38.87
|
-1.99
-4.87% |
$41.15
|
329,663
118.16% of 50 DAV
50 DAV is 279,000
|
$42.00
-7.45%
|
12/14/2022
|
$32.41
|
PP = $33.72
|
|
MB = $35.41
|
Most Recent Note - 3/10/2023 5:06:45 PM
G - Pulling back from its all-time high with today's 3rd consecutive loss backed by +18% above average volume. It remains very extended from the previously noted base. Its 50 DMA line ($35.80) and prior highs in the $34-33 area define important near-term support to watch.
>>> FEATURED STOCK ARTICLE : Sterling Perched Near High, Extended From Prior Base - 2/24/2023 |
View all notes |
Set NEW NOTE alert |
Company Profile |
SEC
News |
Chart |
Request a new note
C
A
S
I |
PERI
-
NASDAQ
Perion Networks Ltd
Comml Svcs-Advertising
|
$33.91
|
-0.40
-1.17% |
$34.94
|
700,412
96.21% of 50 DAV
50 DAV is 728,000
|
$37.18
-8.80%
|
1/25/2023
|
$31.79
|
PP = $33.19
|
|
MB = $34.85
|
Most Recent Note - 3/10/2023 5:02:44 PM
Y - Pulled back today with below average volume behind a 3rd consecutive loss off its 52-week high. Its color code was changed to yellow after dipping below its "max buy" level. Important support to watch is its 50 DMA line ($31.73) and recent low ($29.83 on 2/08/23).
>>> FEATURED STOCK ARTICLE : Perion Stubbornly Holding Ground Near High After Spurt of Gains - 2/22/2023 |
View all notes |
Set NEW NOTE alert |
Company Profile |
SEC
News |
Chart |
Request a new note
C
A
S
I |
Symbol/Exchange
Company Name
Industry Group |
PRICE |
CHANGE
(%Change) |
Day High |
Volume
(% DAV)
(% 50 day avg vol) |
52 Wk Hi
% From Hi |
Featured
Date |
Price
Featured |
Pivot Featured |
|
Max Buy |
ALGM
-
NASDAQ
Allegro Microsystems Inc
Elec-Semiconductor Mfg
|
$44.06
|
-1.16
-2.57% |
$45.56
|
1,505,972
101.28% of 50 DAV
50 DAV is 1,487,000
|
$47.67
-7.57%
|
1/31/2023
|
$37.80
|
PP = $38.38
|
|
MB = $40.30
|
Most Recent Note - 3/10/2023 5:21:22 PM
G - Slumped further today after another "negative reversal" for a loss on the prior session at its all-time high. It is extended from the previously noted base. Prior high in the $38 area defines initial support to watch on pullbacks.
>>> FEATURED STOCK ARTICLE : Holding its Ground After Rallying From Previously Noted Base - 3/1/2023 |
View all notes |
Set NEW NOTE alert |
Company Profile |
SEC
News |
Chart |
Request a new note
C
A
S
I |
WCC
-
NYSE
Wesco International Inc
WHOLESALE - Electronics Wholesale
|
$158.64
|
-7.70
-4.63% |
$165.60
|
730,399
157.41% of 50 DAV
50 DAV is 464,000
|
$175.00
-9.35%
|
2/10/2023
|
$148.50
|
PP = $147.15
|
|
MB = $154.51
|
Most Recent Note - 3/10/2023 5:10:57 PM
G - Pulled back with +57% above average volume behind today s big loss. It remains extended from the prior base. Its 50 DMA line ($149) defines initial support to watch above prior highs in the $144-147 area. Reported Dec '22 quarterly earnings +40% on +15% sales revenues versus the year ago period. See the latest FSU analysis for more details and an annotated graph.
>>> FEATURED STOCK ARTICLE : Wesco Hovering Near All-Time High After Recent Breakout - 3/9/2023 |
View all notes |
Set NEW NOTE alert |
Company Profile |
SEC
News |
Chart |
Request a new note
C
A
S
I |
FIX
-
NYSE
Comfort Systems U S A
MATERIALS and CONSTRUCTION - General Contractors
|
$140.98
|
-4.02
-2.77% |
$145.00
|
289,534
128.11% of 50 DAV
50 DAV is 226,000
|
$152.13
-7.33%
|
2/23/2023
|
$136.52
|
PP = $128.78
|
|
MB = $135.22
|
Most Recent Note - 3/10/2023 4:56:10 PM
G - Pulled back from its all-time high with higher volume behind today's 4th consecutive loss. It still is extended from the previously noted base. Prior highs in the $128 area define initial support to watch above its 50 DMA line.
>>> FEATURED STOCK ARTICLE : Powerful Technical Breakout After Earnings Report - 2/23/2023 |
View all notes |
Set NEW NOTE alert |
Company Profile |
SEC
News |
Chart |
Request a new note
C
A
S
I |
KOF
-
NYSE
Coca Cola Femsa Sab Ads
FOOD and BEVERAGE - Beverages - Soft Drinks
|
$76.02
|
-1.15
-1.49% |
$77.39
|
118,055
70.27% of 50 DAV
50 DAV is 168,000
|
$79.16
-3.97%
|
3/7/2023
|
$76.63
|
PP = $77.11
|
|
MB = $80.97
|
Most Recent Note - 3/10/2023 5:01:35 PM
Y - Pulled back today for a 2nd consecutive loss with lighter volume following a streak of 6 consecutive gains with higher volume while hitting a new 52-week high. Highlighted in yellow with pivot point cited based on its 1/24/23 high plus 10 cents in the 3/07/23 mid-day report. Gains above the pivot point must be backed by at least +40% above average volume to trigger a proper technical buy signal.
>>> FEATURED STOCK ARTICLE : Mexican Coke Bottler Hits New Multi-Year High - 3/7/2023 |
View all notes |
Set NEW NOTE alert |
Company Profile |
SEC
News |
Chart |
Request a new note
C
A
S
I |
ANET
-
NYSE
Arista Networks Inc
Computer-Networking
|
$146.46
|
-2.19
-1.47% |
$150.73
|
2,907,485
127.58% of 50 DAV
50 DAV is 2,279,000
|
$152.07
-3.69%
|
3/8/2023
|
$147.59
|
PP = $148.67
|
|
MB = $156.10
|
Most Recent Note - 3/10/2023 5:22:45 PM
Y - Pulled back today breaking a streak of 5 consecutive gains hitting a new all-time high. Highlighted in yellow in the 3/08/23 mid-day report with pivot point cited based on its 12/27/21 high plus 10 cents. A gain and strong close above the pivot point backed by at least +40% above average volume may trigger a proper technical buy signal. Fundamentals remain strong after it reported Dec '22 quarterly earnings +72% on +55% sales revenues versus the year ago period.
>>> FEATURED STOCK ARTICLE : Arista Challenging All-Time High - 3/8/2023 |
View all notes |
Set NEW NOTE alert |
Company Profile |
SEC
News |
Chart |
Request a new note
C
A
S
I |
Symbol/Exchange
Company Name
Industry Group |
PRICE |
CHANGE
(%Change) |
Day High |
Volume
(% DAV)
(% 50 day avg vol) |
52 Wk Hi
% From Hi |
Featured
Date |
Price
Featured |
Pivot Featured |
|
Max Buy |
CLH
-
NYSE
Clean Harbors Inc
Pollution Control
|
$134.49
|
-3.10
-2.25% |
$137.57
|
924,698
278.52% of 50 DAV
50 DAV is 332,000
|
$140.69
-4.41%
|
3/10/2023
|
$136.89
|
PP = $136.74
|
|
MB = $143.58
|
Most Recent Note - 3/10/2023 5:44:24 PM
Y - Color code was changed to yellow as a valid secondary buy point exists up to 5% above the recent high following a pullback to support at the 10 WMA line after an earlier breakout. Fundamentals remain strong. There was a "negative reversal" on the prior session at its all-time high. Reported Dec '22 quarterly earnings +62% on +14% sales revenues versus the year ago period. Volume and volatility often increase near earnings news. Its 50 DMA line ($128) defines near-term support above prior highs in the $125 area. Showed resilience since dropped from the Featured Stocks list on 12/29/22. See the latest FSU analysis for more details and a new annotated graph.
>>> FEATURED STOCK ARTICLE : Pullback to Support Marked Secondary Buy Point; Market Concerns Rose - 3/10/2023 |
View all notes |
Set NEW NOTE alert |
Company Profile |
SEC
News |
Chart |
Request a new note
C
A
S
I |
|
|
|
THESE ARE NOT BUY RECOMMENDATIONS!
Comments contained in the body of this report are technical
opinions only. The material herein has been obtained
from sources believed to be reliable and accurate, however,
its accuracy and completeness cannot be guaranteed.
This site is not an investment advisor, hence it does
not endorse or recommend any securities or other investments.
Any recommendation contained in this report may not
be suitable for all investors and it is not to be deemed
an offer or solicitation on our part with respect to
the purchase or sale of any securities. All trademarks,
service marks and trade names appearing in this report
are the property of their respective owners, and are
likewise used for identification purposes only.
This report is a service available
only to active Paid Premium Members.
You may opt-out of receiving report notifications
at any time. Questions or comments may be submitted
by writing to Premium Membership Services 665 S.E. 10 Street, Suite 201 Deerfield Beach, FL 33441-5634 or by calling 1-800-965-8307
or 954-785-1121.
|
|
|