You are not logged in.
This means you
CAN ONLY VIEW reports that were published prior to Thursday, April 17, 2025.
You
MUST UPGRADE YOUR MEMBERSHIP if you want to see any current reports.
AFTER MARKET UPDATE - WEDNESDAY, MARCH 29TH, 2023
Previous After Market Report Next After Market Report >>>
|
|
|
|
DOW |
+323.35 |
32,717.60 |
+1.00% |
|
Volume |
899,834,309 |
+13% |
|
Volume |
4,487,438,800 |
+12% |
|
NASDAQ |
+210.16 |
11,926.24 |
+1.79% |
|
Advancers |
2,308 |
79% |
|
Advancers |
2,959 |
67% |
|
S&P 500 |
+56.54 |
4,027.81 |
+1.42% |
|
Decliners |
604 |
21% |
|
Decliners |
1,471 |
33% |
|
Russell 2000 |
+23.83 |
1,715.46 |
+1.41% |
|
52 Wk Highs |
41 |
|
|
52 Wk Highs |
68 |
|
|
S&P 600 |
+7.51 |
1,160.59 |
+0.65% |
|
52 Wk Lows |
20 |
|
|
52 Wk Lows |
143 |
|
|
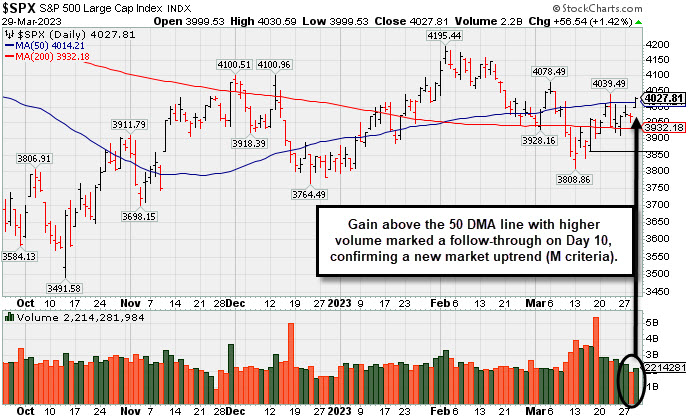
Wednesday's gains with higher volume and greater leadership marked a follow-through day confirming a new uptrend. New buying efforts may be made based on the (M criteria) of the fact-based investment system. Disciplined investors know to only buy stocks meeting all key criteria.
|
 |
Major Indices' Gains Signal Follow-Through Confirming New Uptrend
Kenneth J. Gruneisen - Passed the CAN SLIM® Master's Exam
The Dow climbed 323 points (1%), while the Nasdaq Composite advanced 1.8% amid a broad-based rally in Technology shares. The S&P 500 added 1.4%, with all sectors finishing in positive territory. Volume totals reported were higher than the prior session on the NYSE and on the Nasdaq exchange, a reassuring sign of greater institutional buying demand or "accumulation". Breadth was positive as advancers led decliners by almost a 4-1 margin on the NYSE and by more than a 2-1 margin on the Nasdaq exchange. There were 14 high-ranked companies from theLeaders List that hit a new 52-week high and were listed on the BreakOuts Page, versus the total of 14 on the prior session. There was an increase in new 52-week highs as they outnumbered new 52-week lows on the NYSE, and new highs also increased on the Nasdaq exchange but new 52-week lows still outnumbered them. The major indices are in a new confirmed uptrend (M criteria).
PICTURED: The S&P 500 Index posted a gain with higher volume and rose above its 50-day moving average (DMA) line. The session marked a solid follow-through day to confirm a new uptrend on Day 10 of the benchmark index's rally. This signals that new buying efforts may be considered appropriate under the fact-based investment system.
U.S. equities finished higher Wednesday amid a rally in technology and as sentiment rebounded as the banking chaos continued to ease. Also in focus was Federal Reserve (Fed) Vice Chair for Supervision Michael Barr’s testimony in front of the House Financial Services Committee. In his remarks, he stated there is a need to thoroughly review bank management, supervisors, and the regulatory system for insights into how this crisis occurred.
On the data front today, Mortgage Bankers Association (MBA) mortgage applications for the week ended March 24 climbed 2.9% as U.S. mortgage rates continue to decline. The report also showed refinancing applications rose for the fourth-straight week to its highest level since September. Meanwhile, pending home sales unexpectedly climbed 0.8% month-over-month in February versus the expected 3% monthly decline. Treasuries weakened, with the yield on the benchmark 10-year note up two basis points (0.02%) to 3.57%, while the 30-year bond yield climbed one basis point (0.01%) to 3.77%. The yield on the two-year note, which is more sensitive to changes in Fed policy, gained three basis points (0.03%) to 4.09%. In commodities, West Texas Intermediate (WTI) crude dipped 0.3% to $72.99/barrel as concerns over tight supply were outweighed by reports Russian oil production fell less than expected in March. However, the weekly report from the U.S. Energy Information Administration (EIA) kept a floor under prices, showing there was an unexpected drawdown in crude stockpiles while gasoline inventories posted a larger-than-expected decline.
|
 Kenneth J. Gruneisen started out as a licensed stockbroker in August 1987, a couple of months prior to the historic stock market crash that took the Dow Jones Industrial Average down -22.6% in a single day. He has published daily fact-based fundamental and technical analysis on high-ranked stocks online for two decades. Through FACTBASEDINVESTING.COM, Kenneth provides educational articles, news, market commentary, and other information regarding proven investment systems that work in good times and bad.
Comments contained in the body of this report are technical opinions only and are not necessarily those of Gruneisen Growth Corp. The material herein has been obtained from sources believed to be reliable and accurate, however, its accuracy and completeness cannot be guaranteed. Our firm, employees, and customers may effect transactions, including transactions contrary to any recommendation herein, or have positions in the securities mentioned herein or options with respect thereto. Any recommendation contained in this report may not be suitable for all investors and it is not to be deemed an offer or solicitation on our part with respect to the purchase or sale of any securities. |
|
 |
Retail, Financial, Tech, and Energy-Linked Groups Rose
Kenneth J. Gruneisen - Passed the CAN SLIM® Master's Exam
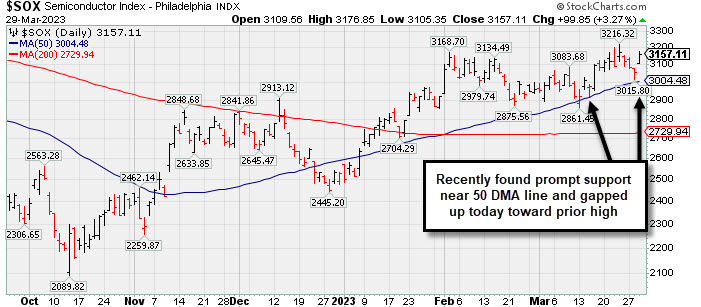
The Retail Index ($RLX +1.94%), Bank Index ($BKX +2.09%), and Broker/Dealer Index ($XBD +1.32%) each posted a solid gain helping to boost the major averages. The Semiconductor Index ($SOX +3.27%) led the tech sector while the Biotech Index ($BTK +1.57%) and Networking Index ($NWX +0.96%) both followed with solid gains. The Oil Services Index ($OSX +1.24%) and Integrated Oil Index ($XOI +1.41%) both notched gains, meanwhile the Gold & Silver Index ($XAU -0.23%) edged lower.
PICTURED: The Semiconductor Index ($SOX +3.27%) recently found prompt support near its 50-day moving average (DMA) line and gapped up today toward the prior high.
| Oil Services |
$OSX |
78.93 |
+0.97 |
+1.24% |
-5.88% |
| Integrated Oil |
$XOI |
1,715.46 |
+23.83 |
+1.41% |
-4.02% |
| Semiconductor |
$SOX |
3,157.11 |
+99.85 |
+3.27% |
+24.68% |
| Networking |
$NWX |
822.71 |
+7.78 |
+0.96% |
+5.03% |
| Broker/Dealer |
$XBD |
456.14 |
+5.93 |
+1.32% |
+1.56% |
| Retail |
$RLX |
2,898.15 |
+55.25 |
+1.94% |
+5.23% |
| Gold & Silver |
$XAU |
130.00 |
-0.31 |
-0.23% |
+7.56% |
| Bank |
$BKX |
82.32 |
+1.69 |
+2.09% |
-18.37% |
| Biotech |
$BTK |
5,235.64 |
+81.01 |
+1.57% |
-0.86% |
|
|
|
 |
Finding Support Recently at 50-Day Moving Average Line
Kenneth J. Gruneisen - Passed the CAN SLIM® Master's Exam
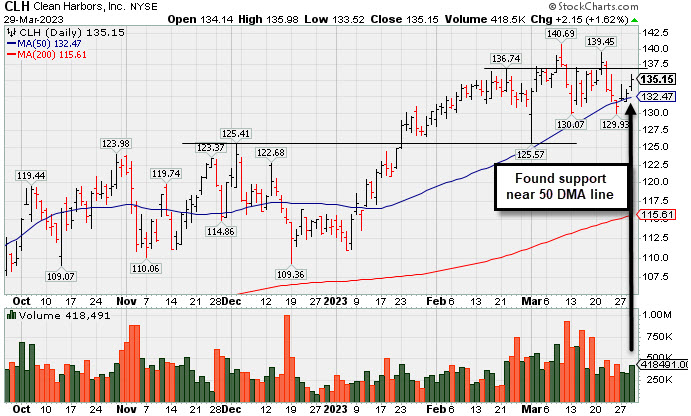
Clean Harbors Inc (CLH +$2.15 or +1.62% to $135.15) posted a 3rd consecutive gain today with average volume, finding prompt support near its 50-day moving average (DMA) line ($132.47). More damaging losses below the 50 DMA line and recent low ($129.93 on 3/24/23) would raise concerns and trigger technical sell signals. Fundamentals remain strong.
CLH was highlighted in yellow in the 3/10/23 mid-day report (read here) as it was noted that a valid secondary buy point exists up to 5% above the recent high following a pullback to support at the 10 WMA line after an earlier breakout. It was shown in greater detail that evening with an annotated graph under the headline, "Pullback to Support Marked Secondary Buy Point; Market Concerns Rose".
CLH has an Earnings Per Share Rating of 99. It reported Dec '22 quarterly earnings +62% on +14% sales revenues versus the year ago period. Volume and volatility often increase near earnings news. Prior quarters showed a strong earnings track record with earnings above the +25% minimum guideline (C criteria). Annual earnings (A criteria) growth has been strong and steady.
There are only 54.1 million shares outstanding (S criteria), which can contribute to greater price volatility in the event of institutional buying or selling. The number of top-rated funds owning its shares rose from 590 in Sep '21 to 719 in Dec '22, a reassuring sign concerning the I criteria. The current Up/Down Volume Ratio of 1.1 is an unbiased indication its shares have been under slight accumulation over the past 50 days. It has a Timeliness Rating of A , a Sponsorship rating of C, abd an Accumulation Distribution Rating of C.
|
|
|
Color Codes Explained :
Y - Better candidates highlighted by our
staff of experts.
G - Previously featured
in past reports as yellow but may no longer be buyable under the
guidelines.
***Last / Change / Volume data in this table is the closing quote data***
Symbol/Exchange
Company Name
Industry Group |
PRICE |
CHANGE
(%Change) |
Day High |
Volume
(% DAV)
(% 50 day avg vol) |
52 Wk Hi
% From Hi |
Featured
Date |
Price
Featured |
Pivot Featured |
|
Max Buy |
 GPK
-
NYSE
GPK
-
NYSE
Graphic Packaging
CONSUMER NON-DURABLES - Packaging and Containers
|
$25.17
|
+0.02
0.08% |
$25.38
|
3,178,938
95.43% of 50 DAV
50 DAV is 3,331,000
|
$25.42
-0.98%
|
10/25/2022
|
$22.75
|
PP = $24.17
|
|
MB = $25.38
|
Most Recent Note - 3/27/2023 6:05:39 PM
Y - Posted a 3rd consecutive gain today with lighter volume, wedging back above the noted pivot point. Its 50 DMA line ($23.59) and recent low ($22.99 on 3/16/23) define important near-term support to watch. More damaging losses would raise greater concerns and trigger a technical sell signal.
>>> FEATURED STOCK ARTICLE : Found Encouraging Support Near 50-Day Moving Average Line - 3/21/2023 |
View all notes |
Set NEW NOTE alert |
Company Profile |
SEC
News |
Chart |
Request a new note
C
A
S
I |
STRL
-
NASDAQ
Sterling Infrastructure
MATERIALS and; CONSTRUCTION - Heavy Construction
|
$38.00
|
-0.30
-0.78% |
$38.77
|
207,548
73.08% of 50 DAV
50 DAV is 284,000
|
$42.00
-9.52%
|
12/14/2022
|
$32.41
|
PP = $33.72
|
|
MB = $35.41
|
Most Recent Note - 3/28/2023 3:44:01 PM
G - On track today for a 3rd consecutive small gain with below-average volume. Its 50 DMA line ($37.09) defines important near-term support to watch above recent lows in the mid-$36 area.
>>> FEATURED STOCK ARTICLE : Posting Quiet Gains Just Above 50-Day Moving Average Line - 3/20/2023 |
View all notes |
Set NEW NOTE alert |
Company Profile |
SEC
News |
Chart |
Request a new note
C
A
S
I |
PERI
-
NASDAQ
Perion Network
Comml Svcs-Advertising
|
$38.60
|
+0.27
0.70% |
$38.78
|
574,093
73.51% of 50 DAV
50 DAV is 781,000
|
$39.54
-2.38%
|
1/25/2023
|
$31.79
|
PP = $33.19
|
|
MB = $34.85
|
Most Recent Note - 3/28/2023 3:42:27 PM
G - Pulling back today with light volume after hitting new all-time highs with 5 consecutive gains. Found support when recently consolidating above its 50 DMA line ($33.86) and the prior high ($33) which define important near-term support.
>>> FEATURED STOCK ARTICLE : Consolidating in an Orderly Manner Above Old High and 50 DMA Line - 3/15/2023 |
View all notes |
Set NEW NOTE alert |
Company Profile |
SEC
News |
Chart |
Request a new note
C
A
S
I |
ALGM
-
NASDAQ
Allegro MicroSystems
Elec-Semiconductor Mfg
|
$46.66
|
+1.58
3.50% |
$47.00
|
795,693
46.53% of 50 DAV
50 DAV is 1,710,000
|
$48.30
-3.40%
|
1/31/2023
|
$37.80
|
PP = $38.38
|
|
MB = $40.30
|
 Most Recent Note - 3/29/2023 5:37:36 PM
G - Posted a gain today with below-average volume. It is extended from the previously noted base. Its 50 DMA line ($42.25) and recent low ($41.30 on 3/18/23) define important near-term support to watch.
>>> FEATURED STOCK ARTICLE : Extended From Prior Base and Perched Near All-Time High - 3/22/2023 |
View all notes |
Set NEW NOTE alert |
Company Profile |
SEC
News |
Chart |
Request a new note
C
A
S
I |
FIX
-
NYSE
Comfort Systems USA
MATERIALS and CONSTRUCTION - General Contractors
|
$143.96
|
+2.02
1.42% |
$145.90
|
323,363
128.83% of 50 DAV
50 DAV is 251,000
|
$152.13
-5.37%
|
2/23/2023
|
$136.52
|
PP = $128.78
|
|
MB = $135.22
|
Most Recent Note - 3/28/2023 3:40:54 PM
G - Posting a 3rd consecutive small gain with light volume. Consolidating well above its 50 DMA line ($131.20) and the prior high in the $128 area defining important support to watch. Fundamentals remain strong.
>>> FEATURED STOCK ARTICLE : Consolidating Above Support at Prior High and 50-Day Moving Average - 3/16/2023 |
View all notes |
Set NEW NOTE alert |
Company Profile |
SEC
News |
Chart |
Request a new note
C
A
S
I |
Symbol/Exchange
Company Name
Industry Group |
PRICE |
CHANGE
(%Change) |
Day High |
Volume
(% DAV)
(% 50 day avg vol) |
52 Wk Hi
% From Hi |
Featured
Date |
Price
Featured |
Pivot Featured |
|
Max Buy |
KOF
-
NYSE
Coca Cola Femsa Sab Ads
FOOD and BEVERAGE - Beverages - Soft Drinks
|
$79.40
|
+0.76
0.97% |
$80.05
|
245,806
13.86% of 50 DAV
50 DAV is 1,774,100
|
$79.61
-0.26%
|
3/7/2023
|
$76.63
|
PP = $77.11
|
|
MB = $80.97
|
Most Recent Note - 3/27/2023 6:09:09 PM
Y - Touched a new all-time high today but reversed into the red for a small loss with light volume. Highlighted in yellow with pivot point cited based on its 1/24/23 high plus 10 cents in the 3/07/23 mid-day report. Gains above the pivot point must be backed by at least +40% above average volume to trigger a proper technical buy signal.
>>> FEATURED STOCK ARTICLE : Gain for Best-Ever Close With Near Average Volume - 3/24/2023 |
View all notes |
Set NEW NOTE alert |
Company Profile |
SEC
News |
Chart |
Request a new note
C
A
S
I |
ANET
-
NYSE
Arista Networks
Computer-Networking
|
$162.50
|
-0.50
-0.31% |
$165.03
|
3,414,957
129.85% of 50 DAV
50 DAV is 2,630,000
|
$171.44
-5.21%
|
3/8/2023
|
$147.59
|
PP = $148.67
|
|
MB = $156.10
|
Most Recent Note - 3/28/2023 12:37:52 PM
G - Gapped down today retreating from its all-time high. Very extended from any sound base after an impressive spurt of volume-driven gains. Prior highs in the $148-145 area define initial support to watch above its 50 DMA line ($138). Broader market weakness (M criteria) has been noted as a "correction" that has raised concerns.
>>> FEATURED STOCK ARTICLE : Pulling Back After Getting Very Extended From Prior Base - 3/28/2023 |
View all notes |
Set NEW NOTE alert |
Company Profile |
SEC
News |
Chart |
Request a new note
C
A
S
I |
CLH
-
NYSE
Clean Harbors
Pollution Control
|
$135.15
|
+2.15
1.62% |
$135.98
|
418,608
101.60% of 50 DAV
50 DAV is 412,000
|
$140.69
-3.94%
|
3/10/2023
|
$136.89
|
PP = $136.74
|
|
MB = $143.58
|
Most Recent Note - 3/29/2023 5:36:07 PM
Y - Posted a 3rd consecutive gain today with average volume, finding prompt support near its 50 DMA line ($132.47). More damaging losses below the 50 DMA line and recent low ($129.93 on 3/24/23) would raise concerns and trigger technical sell signals. Fundamentals remain strong. See the latest FSU analysis for more details and a new annotated graph.
>>> FEATURED STOCK ARTICLE : Finding Support Recently at 50-Day Moving Average Line - 3/29/2023 |
View all notes |
Set NEW NOTE alert |
Company Profile |
SEC
News |
Chart |
Request a new note
C
A
S
I |
|
|
|
THESE ARE NOT BUY RECOMMENDATIONS!
Comments contained in the body of this report are technical
opinions only. The material herein has been obtained
from sources believed to be reliable and accurate, however,
its accuracy and completeness cannot be guaranteed.
This site is not an investment advisor, hence it does
not endorse or recommend any securities or other investments.
Any recommendation contained in this report may not
be suitable for all investors and it is not to be deemed
an offer or solicitation on our part with respect to
the purchase or sale of any securities. All trademarks,
service marks and trade names appearing in this report
are the property of their respective owners, and are
likewise used for identification purposes only.
This report is a service available
only to active Paid Premium Members.
You may opt-out of receiving report notifications
at any time. Questions or comments may be submitted
by writing to Premium Membership Services 665 S.E. 10 Street, Suite 201 Deerfield Beach, FL 33441-5634 or by calling 1-800-965-8307
or 954-785-1121.
|
|
|