You are not logged in.
This means you
CAN ONLY VIEW reports that were published prior to Friday, April 18, 2025.
You
MUST UPGRADE YOUR MEMBERSHIP if you want to see any current reports.
AFTER MARKET UPDATE - THURSDAY, AUGUST 3RD, 2023
Previous After Market Report Next After Market Report >>>
|
|
|
|
DOW |
-66.63 |
35,215.89 |
-0.19% |
|
Volume |
888,790,172 |
-7% |
|
Volume |
6,096,578,900 |
+10% |
|
NASDAQ |
-13.73 |
13,959.72 |
-0.10% |
|
Advancers |
1,082 |
38% |
|
Advancers |
1,947 |
44% |
|
S&P 500 |
-11.50 |
4,501.89 |
-0.25% |
|
Decliners |
1,779 |
62% |
|
Decliners |
2,460 |
56% |
|
Russell 2000 |
-5.43 |
1,961.40 |
-0.28% |
|
52 Wk Highs |
70 |
|
|
52 Wk Highs |
59 |
|
|
S&P 600 |
-4.63 |
1,260.26 |
-0.37% |
|
52 Wk Lows |
44 |
|
|
52 Wk Lows |
106 |
|
|
 |
Major Indices Ended Lower Again Following U.S. Downgrade
Kenneth J. Gruneisen - Passed the CAN SLIM® Master's Exam
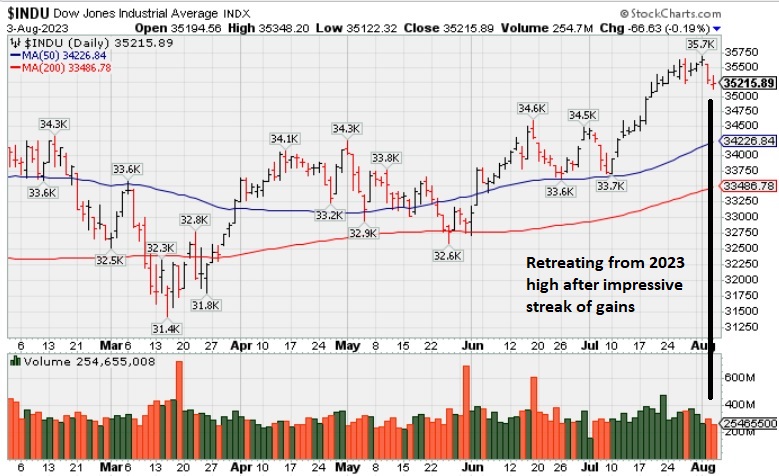
Ultimately, the major indices closed with slim losses, showing some resilience. Volume totals reported were mixed, lighter on the NYSE and higher on the Nasdaq exchange versus the prior session. Breadth was negative as decliners led advancers by more than a 3-2 margin on the NYSE and by 5-4 on the Nasdaq exchange. There were 32 high-ranked companies from the Leaders List that hit a new 52-week high and were listed on the BreakOuts Page, versus the total of 31 on the prior session. New 52-week highs outnumbered new 52-week lows on the NYSE but new lows outnumbered new highs on the Nasdaq exchange. The major indices are in an uptrend that is encountering pressure (M criteria) while leadership has been waning. Appropriate new buying efforts may still be considered under the fact-based investment system. Greater caution may be necessary in the event of a more serious correction.
PICTURED: The Dow Jones Industrial Average is retreating from its 2023 high after an impressive streak of gains.
There was an uptick in selling interest in longer-dated Treasuries after a 25-basis points rate hike by the Bank of England to 5.25%. Chatter continued about Wednesday's downgrade of the U.S. credit rating by Fitch Ratings. Weekly initial jobless claims increased slightly, but still reflect a strong labor market. Meanwhile, the ISM Non-Manufacturing Index showed that services sector growth decelerated in July.
The 10-yr note yield rose 11 basis points to 4.19%, leaving the 10-yr yield 14 basis points below its October high. The 30-yr note yield rose 14 basis points to 4.30%.
On the earnings front, Qualcomm (QCOM -8.2%) was a standout decliner after giving a tepid outlook in connection with its fiscal Q3 report. The S&P 500 energy sector (+1.0%) showed the largest gain while the utilities (-2.3%) sector lost ground.
Investors are eyeing earnings reports from Apple (AAPL) and Amazon.com (AMZN) after the close, along with the July Employment Situation Report due 8:30 a.m. Friday.
|
 Kenneth J. Gruneisen started out as a licensed stockbroker in August 1987, a couple of months prior to the historic stock market crash that took the Dow Jones Industrial Average down -22.6% in a single day. He has published daily fact-based fundamental and technical analysis on high-ranked stocks online for two decades. Through FACTBASEDINVESTING.COM, Kenneth provides educational articles, news, market commentary, and other information regarding proven investment systems that work in good times and bad.
Comments contained in the body of this report are technical opinions only and are not necessarily those of Gruneisen Growth Corp. The material herein has been obtained from sources believed to be reliable and accurate, however, its accuracy and completeness cannot be guaranteed. Our firm, employees, and customers may effect transactions, including transactions contrary to any recommendation herein, or have positions in the securities mentioned herein or options with respect thereto. Any recommendation contained in this report may not be suitable for all investors and it is not to be deemed an offer or solicitation on our part with respect to the purchase or sale of any securities. |
|
 |
Energy Linked Groups Led Gainers; Networking Index Led Decliners
Kenneth J. Gruneisen - Passed the CAN SLIM® Master's Exam
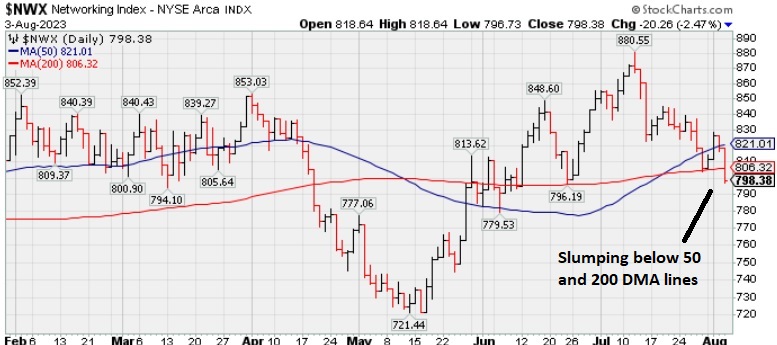
The Retail Index ($RLX +0.33%), Bank Index ($BKX +0.67%) and the Broker/Dealer Index ($XBD +0.24) each posted a small gain. The tech sector was led lower by the Networking Index ($NWX -2.47%) while the Biotech Index ($BTK -0.56%) suffered a smaller loss and the Semiconductor Index ($SOX -0.09%) finished flat. Commodity-linked groups were mixed as the Gold & Silver Index ($XAU -0.52%) fell while the Oil Services Index ($OSX +0.99%) and the Integrated Oil Index ($XOI +0.89%) both posted gains.
PICTURED: The Networking Index ($NWX -2.47%) has slumped below its 50-day and 200-day moving average (DMA) lines.
| Oil Services |
$OSX |
93.33 |
+0.91 |
+0.99% |
+11.29% |
| Integrated Oil |
$XOI |
1,822.37 |
+16.15 |
+0.89% |
+1.97% |
| Semiconductor |
$SOX |
3,708.08 |
-3.52 |
-0.09% |
+46.44% |
| Networking |
$NWX |
798.38 |
-20.26 |
-2.47% |
+1.92% |
| Broker/Dealer |
$XBD |
508.83 |
+1.19 |
+0.24% |
+13.29% |
| Retail |
$RLX |
3,479.18 |
+11.33 |
+0.33% |
+26.33% |
| Gold & Silver |
$XAU |
118.45 |
-0.62 |
-0.52% |
-2.00% |
| Bank |
$BKX |
88.07 |
+0.59 |
+0.67% |
-12.67% |
| Biotech |
$BTK |
5,207.43 |
-29.52 |
-0.56% |
-1.39% |
|
|
|
 |
Powerful Breakout for COKE
Kenneth J. Gruneisen - Passed the CAN SLIM® Master's Exam
Coca-Cola Consolidated (COKE +$83.74 or +13.42% to $707.79) was highlighted in yellow with pivot point cited based on its 5/04/23 high plus 10 cents in the earlier mid-day report. It reported Jun '23 quarterly earnings +54% on +9% sales revenues versus the year-ago period, continuing its strong track record. It hit a new 52-week high with today's big gain backed by +159% above average volume triggering a technical buy signal, rebounding from below its 50-day moving average (DMA) line ($650).
COKE was last shown in this FSU section on 6/14/23 with an annotated graph under the headline "Fell Below Pivot Point With Recent Volume-Driven Losses". It was dropped from the Featured Stocks list on 7/11/23. COKE has a 99 Earnings Per Share Rating, well above the 80+ minimum for buy candidates. The 5 latest quarterly comparisons were well above the +25% minimum earnings guideline (C criteria). Annual earnings (A criteria) growth has been very strong after a slight downturn in FY '18.
The number of top-rated funds owning its shares rose from 379 in Jun '21 to 506 in Jun '23, a reassuring sign concerning the I criteria. Its current Up/Down Volume Ratio of 0.6 is an unbiased indication its shares have been under distributional pressure over the past 50 days. It has a Timeliness Rating of A and a Sponsorship Rating of B. There are only 5.8 million shares in the public float which can contribute to greater price volatility due to any buying or selling by the institutional crowd. |
|
|
Color Codes Explained :
Y - Better candidates highlighted by our
staff of experts.
G - Previously featured
in past reports as yellow but may no longer be buyable under the
guidelines.
***Last / Change / Volume data in this table is the closing quote data***
Symbol/Exchange
Company Name
Industry Group |
PRICE |
CHANGE
(%Change) |
Day High |
Volume
(% DAV)
(% 50 day avg vol) |
52 Wk Hi
% From Hi |
Featured
Date |
Price
Featured |
Pivot Featured |
|
Max Buy |
 STRL
-
NASDAQ
STRL
-
NASDAQ
Sterling Infrastructure
Bldg-Heavy Construction
|
$61.30
|
-0.45
-0.73% |
$62.02
|
267,321
78.16% of 50 DAV
50 DAV is 342,000
|
$63.21
-3.02%
|
12/14/2022
|
$32.41
|
PP = $33.72
|
|
MB = $35.41
|
Most Recent Note - 8/1/2023 1:02:46 PM
G - Posting a 6th consecutive gain today for a new all-time high. It is very extended from any sound base and its 50 DMA line ($54) defines near-term support to watch. Mar '23 quarterly earnings were below the +25% minimum guideline (C criteria) raising fundamental concerns.
>>> FEATURED STOCK ARTICLE : Streak of Gains Lifts Sterling Infrastructure to New Highs - 7/3/2023 |
View all notes |
Set NEW NOTE alert |
Company Profile |
SEC
News |
Chart |
Request a new note
C
A
S
I |
FIX
-
NYSE
Comfort Systems USA
Bldg-A/C and Heating Prds
|
$176.81
|
+2.05
1.17% |
$177.23
|
164,968
73.98% of 50 DAV
50 DAV is 223,000
|
$176.27
0.31%
|
4/27/2023
|
$148.85
|
PP = $152.23
|
|
MB = $159.84
|
Most Recent Note - 7/28/2023 6:00:19 PM
G - Hit a new all-time high today after testing its 50 DMA line ($159) on the prior session. Reported Jun '23 quarterly earnings +65% on +27% versus the year ago period. Volume and volatility often increase near earnings news.
>>> FEATURED STOCK ARTICLE : Pulled Back From High With Lighter Volume - 7/19/2023 |
View all notes |
Set NEW NOTE alert |
Company Profile |
SEC
News |
Chart |
Request a new note
C
A
S
I |
KOF
-
NYSE
Coca Cola Femsa Sab Ads
FOOD and BEVERAGE - Beverages - Soft Drinks
|
$80.96
|
-1.51
-1.83% |
$82.22
|
189,933
117.61% of 50 DAV
50 DAV is 161,500
|
$91.23
-11.26%
|
6/9/2023
|
$88.61
|
PP = $91.33
|
|
MB = $95.90
|
Most Recent Note - 8/2/2023 6:01:06 PM
G - Reported Jun '23 quarterly earnings +23% on +26% sales revenues versus the year-ago period, below the +25% minimum guideline (C criteria). Its Relative Strength Rating has slumped to 79 while meeting resistance and lingering below its 50 DMA line. A rebound above the 50 DMA line ($84.76) is needed for its outlook to improve.
>>> FEATURED STOCK ARTICLE : Slumping Below 50-Day Moving Average and Below Prior Low - 7/6/2023 |
View all notes |
Set NEW NOTE alert |
Company Profile |
SEC
News |
Chart |
Request a new note
C
A
S
I |
CLH
-
NYSE
Clean Harbors
Pollution Control
|
$167.28
|
-0.52
-0.31% |
$171.48
|
503,140
127.38% of 50 DAV
50 DAV is 395,000
|
$174.10
-3.92%
|
3/10/2023
|
$136.89
|
PP = $136.74
|
|
MB = $143.58
|
Most Recent Note - 8/2/2023 5:59:00 PM
G - Hit a new all-time high today while trading higher volume but ending little changed. Reported earnings for the Jun '23 quarter -13% on +3% sales revenues versus the year ago period, below the +25% minimum earnings guideline (C criteria), raising fundamental concerns. , extended from any sound base. Its 50 DMA line ($159) defines important near-term support to watch on pullbacks.
>>> FEATURED STOCK ARTICLE : Negative Reversal at High After +26% Rally in 4 Months - 7/18/2023 |
View all notes |
Set NEW NOTE alert |
Company Profile |
SEC
News |
Chart |
Request a new note
C
A
S
I |
SPSC
-
NASDAQ
SPS Commerce
Comp Sftwr-Spec Enterprs
|
$168.40
|
-0.40
-0.24% |
$169.43
|
129,215
60.95% of 50 DAV
50 DAV is 212,000
|
$196.39
-14.25%
|
4/24/2023
|
$150.01
|
PP = $157.56
|
|
MB = $165.44
|
Most Recent Note - 8/2/2023 6:06:42 PM
G - Suffered a damaging loss and slumped further below its 50 DMA line ($177) and its color code is changed to green. A rebound above the 50 DMA line is needed for its outlook to improve. Reported Jun '23 quarterly earnings +30% on +19% sales revenues versus the year-ago period.
>>> FEATURED STOCK ARTICLE : Pulled Back Abruptly to 50-Day Moving Average Line - 7/24/2023 |
View all notes |
Set NEW NOTE alert |
Company Profile |
SEC
News |
Chart |
Request a new note
C
A
S
I |
Symbol/Exchange
Company Name
Industry Group |
PRICE |
CHANGE
(%Change) |
Day High |
Volume
(% DAV)
(% 50 day avg vol) |
52 Wk Hi
% From Hi |
Featured
Date |
Price
Featured |
Pivot Featured |
|
Max Buy |
HUBB
-
NYSE
Hubbell
Electrical-Power/Equipmt
|
$306.58
|
-6.61
-2.11% |
$311.35
|
565,594
132.46% of 50 DAV
50 DAV is 427,000
|
$340.06
-9.85%
|
4/25/2023
|
$262.85
|
PP = $257.51
|
|
MB = $270.39
|
Most Recent Note - 7/26/2023 5:38:35 PM
G - Abruptly retreated from its all-time high with today's 2nd consecutive volume-driven undercutting its 50 DMA line ($311) raising concerns. Fundamentals remain strong after Jun '23 earnings rose +45%. See the latest FSU analysis for more details and a new annotated graph.
>>> FEATURED STOCK ARTICLE : Pulled Back Undercutting 50 Day Moving Average Line - 7/26/2023 |
View all notes |
Set NEW NOTE alert |
Company Profile |
SEC
News |
Chart |
Request a new note
C
A
S
I |
NVR
-
NYSE
N V R Inc
MATERIALS and CONSTRUCTION - Residential Construction
|
$6,248.02
|
-55.82
-0.89% |
$6,290.00
|
19,180
82.32% of 50 DAV
50 DAV is 23,300
|
$6,474.53
-3.50%
|
4/25/2023
|
$5,882.18
|
PP = $5,978.25
|
|
MB = $6,277.16
|
Most Recent Note - 7/27/2023 7:50:27 PM
G - Pulled back today with above average volume. Reported Jun '23 quarterly earnings -6% on -13% sales revenues raising greater fundamental concerns. Its prior low ($6,009 on 7/06) and 50 DMA line ($6,028) define near-term support watch.
>>> FEATURED STOCK ARTICLE : New High Close for Strong Homebuilder - 6/30/2023 |
View all notes |
Set NEW NOTE alert |
Company Profile |
SEC
News |
Chart |
Request a new note
C
A
S
I |
PHM
-
NYSE
PulteGroup
Bldg-Resident/Comml
|
$81.45
|
-2.11
-2.53% |
$83.10
|
2,588,230
92.93% of 50 DAV
50 DAV is 2,785,000
|
$86.01
-5.30%
|
4/25/2023
|
$65.17
|
PP = $64.01
|
|
MB = $67.21
|
Most Recent Note - 7/27/2023 7:42:23 PM
G - There was a "negative reversal" today after hitting another new high. It is very extended from any sound base. Recently reported earnings +18% for the Jun '23 quarter versus the year-ago period, below the +25% minimum guideline (C criteria) raising concerns. Important support to watch is defined by its 50 DMA line ($74.54). See the latest FSU analysis for more details and a new annotated graph.
>>> FEATURED STOCK ARTICLE : Reversed After Reaching a New All-Time High - 7/27/2023 |
View all notes |
Set NEW NOTE alert |
Company Profile |
SEC
News |
Chart |
Request a new note
C
A
S
I |
AMPH
-
NASDAQ
Amphastar Pharm
Medical-Biomed/Biotech
|
$63.08
|
+1.39
2.25% |
$63.39
|
218,706
50.51% of 50 DAV
50 DAV is 433,000
|
$63.72
-1.00%
|
5/15/2023
|
$43.56
|
PP = $44.15
|
|
MB = $46.36
|
Most Recent Note - 8/2/2023 6:02:40 PM
G - Still hovering near its all-time high with volume totals cooling. It has not formed a sound new base of sufficient length. Its 50 DMA line ($53.75) defines important support to watch. Fundamentals remain strong.
>>> FEATURED STOCK ARTICLE : 6th Straight Gain for Amphastar - 7/20/2023 |
View all notes |
Set NEW NOTE alert |
Company Profile |
SEC
News |
Chart |
Request a new note
C
A
S
I |
ANET
-
NYSE
Arista Networks
Computer-Networking
|
$177.76
|
+0.48
0.27% |
$180.93
|
2,777,015
74.11% of 50 DAV
50 DAV is 3,747,000
|
$190.65
-6.76%
|
8/1/2023
|
$188.84
|
PP = $178.46
|
|
MB = $187.38
|
Most Recent Note - 8/2/2023 6:04:28 PM
Y - Gapped down today negating a portion of the considerable volume-driven gain on the prior session and slumping near the prior high and pivot point. Color code was changed to yellow with new pivot point cited based on its 5/30/23 high plus 10 cents. Bullish action came after it reported Jun '23 quarterly earnings +40% on +39% sales revenues versus the year-ago period. Volume and volatility often increase near earnings news.
>>> FEATURED STOCK ARTICLE : Wedging Higher After Rebounding Above 50-Day Moving Average - 7/12/2023 |
View all notes |
Set NEW NOTE alert |
Company Profile |
SEC
News |
Chart |
Request a new note
C
A
S
I |
Symbol/Exchange
Company Name
Industry Group |
PRICE |
CHANGE
(%Change) |
Day High |
Volume
(% DAV)
(% 50 day avg vol) |
52 Wk Hi
% From Hi |
Featured
Date |
Price
Featured |
Pivot Featured |
|
Max Buy |
PANW
-
NASDAQ
Palo Alto Networks
Computer Sftwr-Security
|
$237.45
|
+1.28
0.54% |
$238.75
|
3,557,027
54.36% of 50 DAV
50 DAV is 6,543,000
|
$258.88
-8.28%
|
6/5/2023
|
$228.35
|
PP = $213.73
|
|
MB = $224.42
|
Most Recent Note - 7/31/2023 4:58:13 PM
G - Posted a 4th consecutive gain today with light volume. Volume totals have been cooling while consolidating above its 50 DMA line ($234) which defines near-term support to watch. Fundamentals remain strong. See the latest FSU analysis for more details and a new annotated graph.
>>> FEATURED STOCK ARTICLE : Volume Cooling While Hovering Near High - 7/31/2023 |
View all notes |
Set NEW NOTE alert |
Company Profile |
SEC
News |
Chart |
Request a new note
C
A
S
I |
LSCC
-
NASDAQ
Lattice Semiconductor
Elec-Semicondctor Fablss
|
$90.99
|
-0.17
-0.19% |
$92.07
|
1,346,785
59.88% of 50 DAV
50 DAV is 2,249,000
|
$98.18
-7.32%
|
6/13/2023
|
$91.73
|
PP = $96.92
|
|
MB = $101.77
|
Most Recent Note - 7/27/2023 7:44:48 PM
Y - Color code is changed to yellow after today's gap up and big volume-driven gain helped it promptly rebound above the 50 DMA line helping its outlook improve, Due to report Jun '23 quarterly results on 7/31/23.
>>> FEATURED STOCK ARTICLE : Perched Near Pivot Point After Best-Ever Close - 7/17/2023 |
View all notes |
Set NEW NOTE alert |
Company Profile |
SEC
News |
Chart |
Request a new note
C
A
S
I |
XPEL
-
NASDAQ
XPEL
Auto/Truck-Replace Parts
|
$80.79
|
+0.75
0.94% |
$81.46
|
68,757
52.49% of 50 DAV
50 DAV is 131,000
|
$87.46
-7.63%
|
6/28/2023
|
$83.14
|
PP = $87.11
|
|
MB = $91.47
|
Most Recent Note - 7/31/2023 4:25:08 PM
Y - Color code was changed to yellow after rebounding back above its 50 DMA line ($78.68) with 2 consecutive gains. Stalled after recently hitting a new 52-week high. Reported Mar '23 quarterly earnings +46% on +19% sales revenues versus the year-ago period, its 3rd quarterly comparison above the +25% minimum earnings guideline (C criteria), helping it better match the winning models of the fact-based investment system.
>>> FEATURED STOCK ARTICLE : Consolidating After Rebounding Above 50-Day Moving Average - 8/2/2023 |
View all notes |
Set NEW NOTE alert |
Company Profile |
SEC
News |
Chart |
Request a new note
C
A
S
I |
FTNT
-
NASDAQ
Fortinet
Computer Sftwr-Security
|
$75.76
|
+1.44
1.94% |
$76.00
|
5,343,430
98.88% of 50 DAV
50 DAV is 5,404,000
|
$81.24
-6.75%
|
7/10/2023
|
$78.29
|
PP = $74.45
|
|
MB = $78.17
|
Most Recent Note - 8/2/2023 6:05:28 PM
Y - Suffered a large loss today with higher (near average) volume. Its prior high in the $74 area defines support above its 50 DMA line ($73.43) Fundamentals remain strong.
>>> FEATURED STOCK ARTICLE : Fortinet Powered to New All-Time High - 7/10/2023 |
View all notes |
Set NEW NOTE alert |
Company Profile |
SEC
News |
Chart |
Request a new note
C
A
S
I |
PII
-
NYSE
Polaris
Leisure-Products
|
$132.28
|
-1.22
-0.91% |
$133.77
|
417,365
68.53% of 50 DAV
50 DAV is 609,000
|
$138.49
-4.48%
|
7/11/2023
|
$126.92
|
PP = $123.97
|
|
MB = $130.17
|
Most Recent Note - 7/31/2023 5:06:08 PM
G - Posted a gain today with above average volume. Reported Jun '23 quarterly earnings +0% versus the year ago period, below the +25% minimum earnings guideline (C criteria). On pullbacks, the prior highs define initial support to watch above its 50 DMA line ($120.73).
>>> FEATURED STOCK ARTICLE : Volume-Driven Breakout for Polaris - 7/11/2023 |
View all notes |
Set NEW NOTE alert |
Company Profile |
SEC
News |
Chart |
Request a new note
C
A
S
I |
Symbol/Exchange
Company Name
Industry Group |
PRICE |
CHANGE
(%Change) |
Day High |
Volume
(% DAV)
(% 50 day avg vol) |
52 Wk Hi
% From Hi |
Featured
Date |
Price
Featured |
Pivot Featured |
|
Max Buy |
ALGM
-
NASDAQ
Allegro MicroSystems
Elec-Semicondctor Fablss
|
$43.13
|
-0.09
-0.21% |
$43.39
|
1,810,261
118.94% of 50 DAV
50 DAV is 1,522,000
|
$53.05
-18.70%
|
7/13/2023
|
$49.86
|
PP = $48.82
|
|
MB = $51.26
|
Most Recent Note - 8/1/2023 12:40:58 PM
G - Gapped down today undercutting the prior low with a big volume-driven loss raising concerns and its color code is changed to green. Reported Jun '23 quarterly earnings +63% versus the year-ago period. Volume and volatility often increase near earnings news. Disciplined investors always limit losses by selling any stock that falls more than -8% from their purchase price.
>>> FEATURED STOCK ARTICLE : Volume Heavy Behind Considerable Breakout Gain - 7/13/2023 |
View all notes |
Set NEW NOTE alert |
Company Profile |
SEC
News |
Chart |
Request a new note
C
A
S
I |
ESQ
-
NASDAQ
Esquire Finl Hldgs
Finance-Commercial Loans
|
$50.48
|
+0.63
1.26% |
$50.88
|
11,526
38.42% of 50 DAV
50 DAV is 30,000
|
$54.03
-6.57%
|
7/14/2023
|
$45.80
|
PP = $48.23
|
|
MB = $50.64
|
Most Recent Note - 7/27/2023 7:46:46 PM
Y - Color code is changed to yellow after pulling back below its "max buy" level. Found support above its 50 DMA line on the recent pullback.
>>> FEATURED STOCK ARTICLE : Esquire Perched Near Prior Highs - 7/14/2023 |
View all notes |
Set NEW NOTE alert |
Company Profile |
SEC
News |
Chart |
Request a new note
C
A
S
I |
MEDP
-
NASDAQ
Medpace Holdings
Medical-Research Eqp/Svc
|
$258.04
|
+2.75
1.08% |
$258.64
|
215,176
55.32% of 50 DAV
50 DAV is 389,000
|
$264.19
-2.33%
|
7/25/2023
|
$196.32
|
PP = $241.57
|
|
MB = $253.65
|
Most Recent Note - 7/27/2023 7:53:30 PM
Y - Pulled back with average volume today for a 2nd consecutive loss after hitting a new all-time high. Prior highs in the $241 area define support to watch on pullbacks. Reported earnings increases above the +25% minimum earnings guideline (C criteria) in the past 5 quarterly comparisons through Jun '23.
>>> FEATURED STOCK ARTICLE : Medpace Posted a Solid Volume-Driven Gain for a New High - 7/25/2023 |
View all notes |
Set NEW NOTE alert |
Company Profile |
SEC
News |
Chart |
Request a new note
C
A
S
I |
COKE
-
NASDAQ
Coca-Cola Consolidated
Beverages-Non-Alcoholic
|
$707.79
|
+83.74
13.42% |
$731.90
|
105,351
263.38% of 50 DAV
50 DAV is 40,000
|
$694.20
1.96%
|
8/3/2023
|
$718.56
|
PP = $694.30
|
|
MB = $729.02
|
 Most Recent Note - 8/3/2023 6:04:46 PM
Y - Finished strong after highlighted in yellow with pivot point cited based on its 5/04/23 high plus 10 cents in the earlier mid-day report. Reported Jun '23 quarterly earnings +54% on +9% sales revenues versus the year-ago period, continuing its strong track record. Hitting a new 52-week high with today's big volume-driven gain triggering a technical buy signal, rebounding from below its 50 DMA line ($650). See the latest FSU analysis for more details and an annotated graph.
>>> FEATURED STOCK ARTICLE : Powerful Breakout for COKE - 8/3/2023 |
View all notes |
Set NEW NOTE alert |
Company Profile |
SEC
News |
Chart |
Request a new note
C
A
S
I |
|
|
|
THESE ARE NOT BUY RECOMMENDATIONS!
Comments contained in the body of this report are technical
opinions only. The material herein has been obtained
from sources believed to be reliable and accurate, however,
its accuracy and completeness cannot be guaranteed.
This site is not an investment advisor, hence it does
not endorse or recommend any securities or other investments.
Any recommendation contained in this report may not
be suitable for all investors and it is not to be deemed
an offer or solicitation on our part with respect to
the purchase or sale of any securities. All trademarks,
service marks and trade names appearing in this report
are the property of their respective owners, and are
likewise used for identification purposes only.
This report is a service available
only to active Paid Premium Members.
You may opt-out of receiving report notifications
at any time. Questions or comments may be submitted
by writing to Premium Membership Services 665 S.E. 10 Street, Suite 201 Deerfield Beach, FL 33441-5634 or by calling 1-800-965-8307
or 954-785-1121.
|
|
|