You are not logged in.
This means you
CAN ONLY VIEW reports that were published prior to Saturday, April 19, 2025.
You
MUST UPGRADE YOUR MEMBERSHIP if you want to see any current reports.
AFTER MARKET UPDATE - WEDNESDAY, JULY 26TH, 2023
Previous After Market Report Next After Market Report >>>
|
|
|
|
DOW |
+82.05 |
35,520.12 |
+0.23% |
|
Volume |
871,619,405 |
+5% |
|
Volume |
4,296,039,300 |
-5% |
|
NASDAQ |
-17.27 |
14,127.28 |
-0.12% |
|
Advancers |
1,819 |
64% |
|
Advancers |
2,681 |
61% |
|
S&P 500 |
-0.71 |
4,566.75 |
-0.02% |
|
Decliners |
1,028 |
36% |
|
Decliners |
1,718 |
39% |
|
Russell 2000 |
+14.24 |
1,980.36 |
+0.72% |
|
52 Wk Highs |
104 |
|
|
52 Wk Highs |
123 |
|
|
S&P 600 |
+8.63 |
1,272.21 |
+0.68% |
|
52 Wk Lows |
6 |
|
|
52 Wk Lows |
102 |
|
|
 |
Major Indices Ended Mixed After Fed Decision
Kenneth J. Gruneisen - Passed the CAN SLIM® Master's Exam
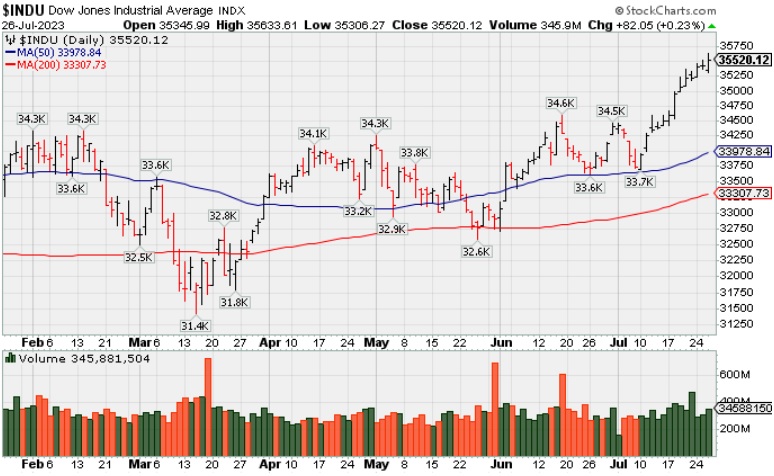
The major indices finished mixed. The volume totals reported were mixed, higher on the NYSE and lower on the Nasdaq exchange versus the prior session. Advancers led decliners by a 9-5 margin on the NYSE and by a 3-2 margin on the Nasdaq exchange. Leadership improved as there were 56 high-ranked companies from the Leaders List that hit a new 52-week high and were listed on the BreakOuts Page, versus the total of 42 on the prior session. New 52-week highs outnumbered new 52-week lows on the NYSE and on the Nasdaq exchange. The major indices are in a confirmed uptrend (M criteria). Appropriate new buying efforts may be considered under the fact-based investment system.
PICTURED: The Dow Jones Industrial Average is hitting new 2023 highs with 13 consecutive gains.
Investors reacted to a heavy batch of earnings, the latest policy move by the FOMC, and Fed Chair Powell's subsequent commentary. The FOMC voted unanimously to raise the target range for the fed funds rate by 25 basis points to 5.25-5.50%, as expected.
On the earnings front, Microsoft (MSFT -3.8%) and Alphabet (GOOG +5.6%) were influential movers. Boeing (BA +8.7%) The market-cap weighted S&P 500 closed flat. Strength from its regional bank components helped the Russell 2000 to outperform its peers, gaining 0.7%. Regional bank stocks were a pocket of strength after the news that PacWest Bancorp (PACW +26.92%) and Banc of California (BANC +0.82%) are merging in an all-stock transaction.
|
 Kenneth J. Gruneisen started out as a licensed stockbroker in August 1987, a couple of months prior to the historic stock market crash that took the Dow Jones Industrial Average down -22.6% in a single day. He has published daily fact-based fundamental and technical analysis on high-ranked stocks online for two decades. Through FACTBASEDINVESTING.COM, Kenneth provides educational articles, news, market commentary, and other information regarding proven investment systems that work in good times and bad.
Comments contained in the body of this report are technical opinions only and are not necessarily those of Gruneisen Growth Corp. The material herein has been obtained from sources believed to be reliable and accurate, however, its accuracy and completeness cannot be guaranteed. Our firm, employees, and customers may effect transactions, including transactions contrary to any recommendation herein, or have positions in the securities mentioned herein or options with respect thereto. Any recommendation contained in this report may not be suitable for all investors and it is not to be deemed an offer or solicitation on our part with respect to the purchase or sale of any securities. |
|
 |
Financials Rose While Tech Indexes Pulled Back
Kenneth J. Gruneisen - Passed the CAN SLIM® Master's Exam
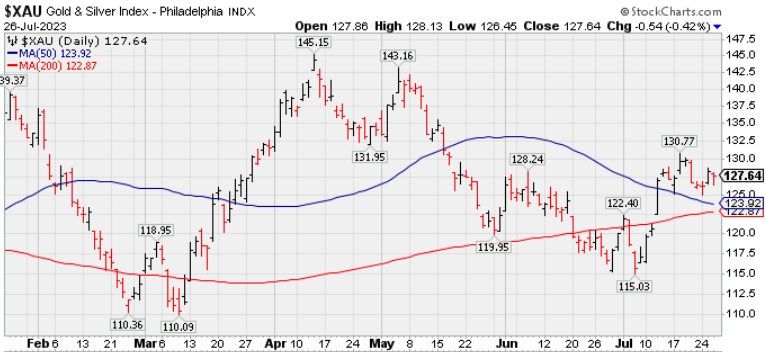
Financials had a positive bias as the Bank Index ($BKX +1.88%) outpaced the Broker/Dealer Index ($XBD +0.68%), meanwhile, the Retail Index ($RLX -0.11%) inched lower. The tech sector had a negative bias as the Semiconductor Index ($SOX -1.49%), Networking Index ($NWX -0.76%) and the Biotech Index ($BTK -0.36%) each finished lower. Commodity-linked groups were led lower by the Gold & Silver Index ($XAU -0.42%) while the Oil Services Index ($OSX +0.05%) and the Integrated Oil Index ($XOI -0.15%) both were little changed.
PICTURED: The Gold & Silver Index ($XAU -0.42%) has been consolidating above its 50 and 200 DMA lines.
| Oil Services |
$OSX |
91.46 |
+0.05 |
+0.05% |
+9.07% |
| Integrated Oil |
$XOI |
1,806.14 |
-2.73 |
-0.15% |
+1.06% |
| Semiconductor |
$SOX |
3,699.37 |
-55.89 |
-1.49% |
+46.10% |
| Networking |
$NWX |
829.00 |
-6.35 |
-0.76% |
+5.83% |
| Broker/Dealer |
$XBD |
517.95 |
+3.50 |
+0.68% |
+15.32% |
| Retail |
$RLX |
3,491.93 |
-3.71 |
-0.11% |
+26.79% |
| Gold & Silver |
$XAU |
127.64 |
-0.54 |
-0.42% |
+5.61% |
| Bank |
$BKX |
89.38 |
+1.65 |
+1.88% |
-11.38% |
| Biotech |
$BTK |
5,299.34 |
-18.98 |
-0.36% |
+0.35% |
|
|
|
 |
Pulled Back Undercutting 50 Day Moving Average Line
Kenneth J. Gruneisen - Passed the CAN SLIM® Master's Exam
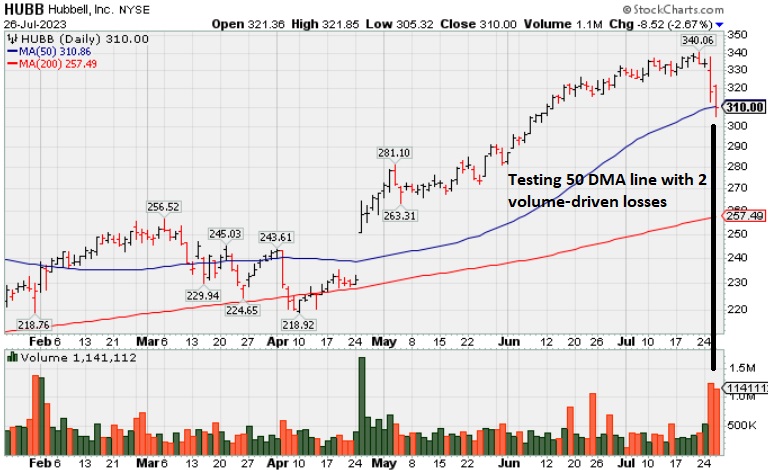
Hubbell (HUBB -$8.52 or -2.67% to $310.00) abruptly retreated from its all-time high with today's 2nd consecutive volume-driven loss undercutting its 50-day moving average (DMA) line ($311), important support to watch. More damaging losses would riase greater concerns and trigger a technical sell signal. Fundamentals remain strong.
HUBB was highlighted yellow in the 4/25/23 mid-day report (read here) with pivot point cited based on its 3/06/23 high as it gapped up after a 4-month "double bottom" base. It was last shown in great detail in this FSU section on 6/22/23 with an annotated graph under the headline "Hubbell on Track for 11th Weekly Gain". HUBB reported Jun '23 quarterly earnings +45% on +9% sales revenues over the year-ago period, continuing its streak of quarterly earnings increases were above the +25% minimum (C criteria). Annual earnings history (A criteria) had a downturn in FY '20 like many companies during the pandemic. It has a 95 Earnings Per Share Rating, well above the 80+ minimum for buy candidates.The high-ranked Electrical-Power/Equipmt firm has 53.6 million shares outstanding (S criteria) which can contribute to greater price volatility in the event of institutional buying or selling. The number of top-rated funds owning its shares rose from 805 in Jun '22 to 1,374 in Jun '23, a reassuring sign concerning the I criteria. The current Up/Down Volume Ratio of 2.1 is an unbiased indication it has been neutral concerning accumulation/distribution over the past 50 days. It has an A Timeliness Rating and a B Sponsorship Rating.
|
|
|
Color Codes Explained :
Y - Better candidates highlighted by our
staff of experts.
G - Previously featured
in past reports as yellow but may no longer be buyable under the
guidelines.
***Last / Change / Volume data in this table is the closing quote data***
Symbol/Exchange
Company Name
Industry Group |
PRICE |
CHANGE
(%Change) |
Day High |
Volume
(% DAV)
(% 50 day avg vol) |
52 Wk Hi
% From Hi |
Featured
Date |
Price
Featured |
Pivot Featured |
|
Max Buy |
 STRL
-
NASDAQ
STRL
-
NASDAQ
Sterling Infrastructure
Bldg-Heavy Construction
|
$58.20
|
+0.04
0.07% |
$59.14
|
176,366
54.27% of 50 DAV
50 DAV is 325,000
|
$60.58
-3.93%
|
12/14/2022
|
$32.41
|
PP = $33.72
|
|
MB = $35.41
|
Most Recent Note - 7/24/2023 5:58:45 PM
G - Pulled back with higher volume behind today's 4th consecutive loss off its all-time high. It is very extended from any sound base and its 50 DMA line defines near-term support to watch. Mar '23 quarterly earnings were below the +25% minimum guideline (C criteria) raising fundamental concerns.
>>> FEATURED STOCK ARTICLE : Streak of Gains Lifts Sterling Infrastructure to New Highs - 7/3/2023 |
View all notes |
Set NEW NOTE alert |
Company Profile |
SEC
News |
Chart |
Request a new note
C
A
S
I |
FIX
-
NYSE
Comfort Systems USA
Bldg-A/C and Heating Prds
|
$165.88
|
-1.63
-0.97% |
$167.70
|
150,326
67.71% of 50 DAV
50 DAV is 222,000
|
$172.02
-3.57%
|
4/27/2023
|
$148.85
|
PP = $152.23
|
|
MB = $159.84
|
Most Recent Note - 7/25/2023 5:14:20 PM
G - Due to report Jun '23 quarterly results on 7/26/23. Volume and volatility often increase near earnings news. Perched near its all-time high with volume totals cooling. No resistance remains due to overhead supply. Its 50 DMA line ($158.85) defines important near-term support to watch on pullbacks.
>>> FEATURED STOCK ARTICLE : Pulled Back From High With Lighter Volume - 7/19/2023 |
View all notes |
Set NEW NOTE alert |
Company Profile |
SEC
News |
Chart |
Request a new note
C
A
S
I |
KOF
-
NYSE
Coca Cola Femsa Sab Ads
FOOD and BEVERAGE - Beverages - Soft Drinks
|
$84.90
|
+2.99
3.65% |
$85.50
|
153,509
92.09% of 50 DAV
50 DAV is 166,700
|
$91.23
-6.94%
|
6/9/2023
|
$88.61
|
PP = $91.33
|
|
MB = $95.90
|
Most Recent Note - 7/25/2023 5:23:18 PM
G - Due to report Jun '23 quarterly results. Volume and volatility often increase near earnings news. Its Relative Strength Rating has slumped to 79 while lingering below its 50 DMA line. A rebound above the 50 DMA line ($85.33) is needed for its outlook to improve. Fundamentals remain strong.
>>> FEATURED STOCK ARTICLE : Slumping Below 50-Day Moving Average and Below Prior Low - 7/6/2023 |
View all notes |
Set NEW NOTE alert |
Company Profile |
SEC
News |
Chart |
Request a new note
C
A
S
I |
CLH
-
NYSE
Clean Harbors
Pollution Control
|
$167.48
|
-2.52
-1.48% |
$170.08
|
307,140
80.40% of 50 DAV
50 DAV is 382,000
|
$172.54
-2.93%
|
3/10/2023
|
$136.89
|
PP = $136.74
|
|
MB = $143.58
|
Most Recent Note - 7/25/2023 5:10:35 PM
G - Hovering near its all-time high, extended from any sound base. Its 50 DMA line ($155.89) defines important near-term support to watch on pullbacks. Due to report Jun '23 quarterly results on 8/02/23.
>>> FEATURED STOCK ARTICLE : Negative Reversal at High After +26% Rally in 4 Months - 7/18/2023 |
View all notes |
Set NEW NOTE alert |
Company Profile |
SEC
News |
Chart |
Request a new note
C
A
S
I |
SPSC
-
NASDAQ
SPS Commerce
Comp Sftwr-Spec Enterprs
|
$175.01
|
-1.64
-0.93% |
$177.98
|
113,603
56.24% of 50 DAV
50 DAV is 202,000
|
$196.39
-10.89%
|
4/24/2023
|
$150.01
|
PP = $157.56
|
|
MB = $165.44
|
Most Recent Note - 7/24/2023 5:43:40 PM
G - Pulled back nearly testing its 50 DMA line ($175) with today's 4th consecutive loss. Due to report Jun '23 quarterly results on 7/27/23. See the latest FSU analysis for more details and a new annotated graph.
>>> FEATURED STOCK ARTICLE : Pulled Back Abruptly to 50-Day Moving Average Line - 7/24/2023 |
View all notes |
Set NEW NOTE alert |
Company Profile |
SEC
News |
Chart |
Request a new note
C
A
S
I |
Symbol/Exchange
Company Name
Industry Group |
PRICE |
CHANGE
(%Change) |
Day High |
Volume
(% DAV)
(% 50 day avg vol) |
52 Wk Hi
% From Hi |
Featured
Date |
Price
Featured |
Pivot Featured |
|
Max Buy |
HUBB
-
NYSE
Hubbell
Electrical-Power/Equipmt
|
$310.00
|
-8.52
-2.67% |
$321.85
|
1,140,979
286.68% of 50 DAV
50 DAV is 398,000
|
$340.06
-8.84%
|
4/25/2023
|
$262.85
|
PP = $257.51
|
|
MB = $270.39
|
 Most Recent Note - 7/26/2023 5:38:35 PM
G - Abruptly retreated from its all-time high with today's 2nd consecutive volume-driven undercutting its 50 DMA line ($311) raising concerns. Fundamentals remain strong after Jun '23 earnings rose +45%. See the latest FSU analysis for more details and a new annotated graph.
>>> FEATURED STOCK ARTICLE : Pulled Back Undercutting 50 Day Moving Average Line - 7/26/2023 |
View all notes |
Set NEW NOTE alert |
Company Profile |
SEC
News |
Chart |
Request a new note
C
A
S
I |
NVR
-
NYSE
NVR
Bldg-Resident/Comml
|
$6,382.98
|
+21.85
0.34% |
$6,443.90
|
15,191
66.05% of 50 DAV
50 DAV is 23,000
|
$6,474.53
-1.41%
|
4/25/2023
|
$5,882.18
|
PP = $5,978.25
|
|
MB = $6,277.16
|
Most Recent Note - 7/20/2023 1:13:57 PM
G - Due to report Jun '23 quarterly results. The Mar '23 quarter was noted as it raised fundamental concerns. Pulling back today undercutting its "max buy" level after recently wedging to a new all-time high. Its prior low ($6,009 on 7/06) and 50 DMA line ($5,984) define near-term support watch.
>>> FEATURED STOCK ARTICLE : New High Close for Strong Homebuilder - 6/30/2023 |
View all notes |
Set NEW NOTE alert |
Company Profile |
SEC
News |
Chart |
Request a new note
C
A
S
I |
PHM
-
NYSE
PulteGroup
Bldg-Resident/Comml
|
$84.30
|
+0.88
1.05% |
$85.00
|
4,216,460
151.02% of 50 DAV
50 DAV is 2,792,000
|
$83.87
0.51%
|
4/25/2023
|
$65.17
|
PP = $64.01
|
|
MB = $67.21
|
Most Recent Note - 7/25/2023 12:08:48 PM
G - Hitting another new high with today's 3rd consecutive gain with volume running at an above average pace. Very extended from any sound base. Reported earnings +18% for the Jun '23 quarter versus the year-ago period, below the +25% minimum guideline (C criteria) raising concerns. Important support to watch is defined by its 50 DMA line ($74).
>>> FEATURED STOCK ARTICLE : Negative Reversal After Hitting Another New High - 6/26/2023 |
View all notes |
Set NEW NOTE alert |
Company Profile |
SEC
News |
Chart |
Request a new note
C
A
S
I |
AMPH
-
NASDAQ
Amphastar Pharm
Medical-Biomed/Biotech
|
$61.38
|
-0.27
-0.44% |
$62.13
|
176,420
37.86% of 50 DAV
50 DAV is 466,000
|
$63.72
-3.67%
|
5/15/2023
|
$43.56
|
PP = $44.15
|
|
MB = $46.36
|
Most Recent Note - 7/26/2023 5:40:51 PM
G - Hovering near its all-time high. It did not form a sound new base of sufficient length. Its 50 DMA line ($52) defines important support to watch. Fundamentals remain strong.
>>> FEATURED STOCK ARTICLE : 6th Straight Gain for Amphastar - 7/20/2023 |
View all notes |
Set NEW NOTE alert |
Company Profile |
SEC
News |
Chart |
Request a new note
C
A
S
I |
ANET
-
NYSE
Arista Networks
Computer-Networking
|
$164.45
|
-9.64
-5.54% |
$173.64
|
3,739,125
117.21% of 50 DAV
50 DAV is 3,190,000
|
$178.36
-7.80%
|
5/30/2023
|
$176.35
|
PP = $171.54
|
|
MB = $180.12
|
Most Recent Note - 7/26/2023 5:42:15 PM
G - Pulled back abruptly today with higher volume. It faces little near-term resistance due to overhead supply up to the $178 level. Fundamentals remain strong. Its 50 DMA line ($159.41) defines near-term support.
>>> FEATURED STOCK ARTICLE : Wedging Higher After Rebounding Above 50-Day Moving Average - 7/12/2023 |
View all notes |
Set NEW NOTE alert |
Company Profile |
SEC
News |
Chart |
Request a new note
C
A
S
I |
Symbol/Exchange
Company Name
Industry Group |
PRICE |
CHANGE
(%Change) |
Day High |
Volume
(% DAV)
(% 50 day avg vol) |
52 Wk Hi
% From Hi |
Featured
Date |
Price
Featured |
Pivot Featured |
|
Max Buy |
PANW
-
NASDAQ
Palo Alto Networks
Computer Sftwr-Security
|
$245.01
|
+2.10
0.86% |
$248.65
|
3,624,717
54.13% of 50 DAV
50 DAV is 6,696,000
|
$258.88
-5.36%
|
6/5/2023
|
$228.35
|
PP = $213.73
|
|
MB = $224.42
|
Most Recent Note - 7/21/2023 5:00:53 PM
G - Posted a small gain today with average volume and it remains perched near its all-time high. Its 50 DMA line ($228) defines near-term support to watch. Fundamentals remain strong.
>>> FEATURED STOCK ARTICLE : Strength Continues for Network Security Leader - 6/27/2023 |
View all notes |
Set NEW NOTE alert |
Company Profile |
SEC
News |
Chart |
Request a new note
C
A
S
I |
LSCC
-
NASDAQ
Lattice Semiconductor
Elec-Semicondctor Fablss
|
$85.01
|
-4.41
-4.93% |
$88.15
|
1,764,069
77.85% of 50 DAV
50 DAV is 2,266,000
|
$98.18
-13.41%
|
6/13/2023
|
$91.73
|
PP = $96.92
|
|
MB = $101.77
|
Most Recent Note - 7/26/2023 5:44:44 PM
G - Color code is changed to green after today's loss on below-average volume violated its 50 DMA line ($87.31) raising concerns and triggering a technical sell signal. Only a prompt rebound above the 50 DMA line would help its outlook improve, Due to report Jun '23 quarterly results on 7/31/23.
>>> FEATURED STOCK ARTICLE : Perched Near Pivot Point After Best-Ever Close - 7/17/2023 |
View all notes |
Set NEW NOTE alert |
Company Profile |
SEC
News |
Chart |
Request a new note
C
A
S
I |
XPEL
-
NASDAQ
Xpel Inc
Auto/Truck-Tires andamp; Misc
|
$77.15
|
-0.70
-0.90% |
$78.53
|
103,865
78.98% of 50 DAV
50 DAV is 131,500
|
$87.46
-11.79%
|
6/28/2023
|
$83.14
|
PP = $87.11
|
|
MB = $91.47
|
Most Recent Note - 7/25/2023 5:20:38 PM
G - Color code is changed to green after slumping and closing below its 50 DMA line ($78.40) with today's 6th consecutive gain backed by below-average volume. Stalled after recently hitting a new 52-week high. Reported Mar '23 quarterly earnings +46% on +19% sales revenues versus the year-ago period, its 3rd quarterly comparison above the +25% minimum earnings guideline (C criteria), helping it better match the winning models of the fact-based investment system.
>>> FEATURED STOCK ARTICLE : XPEL Returns to Featured Stocks List After Long Consolidation - 6/28/2023 |
View all notes |
Set NEW NOTE alert |
Company Profile |
SEC
News |
Chart |
Request a new note
C
A
S
I |
FTNT
-
NASDAQ
Fortinet
Computer Sftwr-Security
|
$77.26
|
-1.08
-1.38% |
$78.75
|
3,376,610
62.08% of 50 DAV
50 DAV is 5,439,000
|
$81.24
-4.90%
|
7/10/2023
|
$78.29
|
PP = $74.45
|
|
MB = $78.17
|
Most Recent Note - 7/24/2023 5:56:43 PM
Y - Color code is changed to yellow after pulling back with light volume below its "max buy" level. Its prior high in the $74 area defines support above its 50 DMA line ($72.22) Fundamentals remain strong.
>>> FEATURED STOCK ARTICLE : Fortinet Powered to New All-Time High - 7/10/2023 |
View all notes |
Set NEW NOTE alert |
Company Profile |
SEC
News |
Chart |
Request a new note
C
A
S
I |
PII
-
NYSE
Polaris
Leisure-Products
|
$137.17
|
+4.36
3.28% |
$137.61
|
872,985
154.51% of 50 DAV
50 DAV is 565,000
|
$136.55
0.45%
|
7/11/2023
|
$126.92
|
PP = $123.97
|
|
MB = $130.17
|
Most Recent Note - 7/25/2023 12:11:08 PM
G - Gapped down today then rebounded from the early low after reporting Jun '23 quarterly earnings +0% versus the year ago period, below the +25% minimum earnings guideline (C criteria). On pullbacks, the prior highs define initial support to watch above its 50 DMA line ($118).
>>> FEATURED STOCK ARTICLE : Volume-Driven Breakout for Polaris - 7/11/2023 |
View all notes |
Set NEW NOTE alert |
Company Profile |
SEC
News |
Chart |
Request a new note
C
A
S
I |
Symbol/Exchange
Company Name
Industry Group |
PRICE |
CHANGE
(%Change) |
Day High |
Volume
(% DAV)
(% 50 day avg vol) |
52 Wk Hi
% From Hi |
Featured
Date |
Price
Featured |
Pivot Featured |
|
Max Buy |
ALGM
-
NASDAQ
Allegro MicroSystems
Elec-Semicondctor Fablss
|
$48.66
|
-0.87
-1.76% |
$49.05
|
886,115
60.44% of 50 DAV
50 DAV is 1,466,000
|
$53.05
-8.28%
|
7/13/2023
|
$49.86
|
PP = $48.82
|
|
MB = $51.26
|
Most Recent Note - 7/25/2023 5:16:08 PM
Y - Posted a gain with lighter volume today rebounding back above the pivot point following 4 consecutive losses with above-average volume. Due to report Jun '23 quarterly earnings news on 7/27/23. Volume and volatility often increase near earnings news. Disciplined investors always limit losses by selling any stock that falls more than -8% from their purchase price.
>>> FEATURED STOCK ARTICLE : Volume Heavy Behind Considerable Breakout Gain - 7/13/2023 |
View all notes |
Set NEW NOTE alert |
Company Profile |
SEC
News |
Chart |
Request a new note
C
A
S
I |
ESQ
-
NASDAQ
Esquire Finl Hldgs
Finance-Commercial Loans
|
$51.75
|
+0.55
1.07% |
$54.03
|
57,656
198.81% of 50 DAV
50 DAV is 29,000
|
$51.43
0.62%
|
7/14/2023
|
$45.80
|
PP = $48.23
|
|
MB = $50.64
|
Most Recent Note - 7/25/2023 5:12:30 PM
G - Color code is changed to green after posting a 4th consecutive gain today with +96% above-average volume, clinching a technical buy signal and hitting a new all-time high but rising above its "max buy" level. Found support above its 50 DMA line on the recent pullback.
>>> FEATURED STOCK ARTICLE : Esquire Perched Near Prior Highs - 7/14/2023 |
View all notes |
Set NEW NOTE alert |
Company Profile |
SEC
News |
Chart |
Request a new note
C
A
S
I |
MEDP
-
NASDAQ
Medpace Holdings
Medical-Research Eqp/Svc
|
$256.52
|
-0.08
-0.03% |
$259.81
|
387,479
101.97% of 50 DAV
50 DAV is 380,000
|
$264.19
-2.90%
|
7/25/2023
|
$196.32
|
PP = $241.57
|
|
MB = $253.65
|
Most Recent Note - 7/25/2023 5:08:48 PM
Y - Finished strong after highlighted in yellow with pivot point cited based on its 1/23/23 high plus 10 cents in the earlier mid-day report. Hit a new all-time high with a solid gain backed by +170% above average volume clinching a technical buy signal. Prior highs in the $241 area define support to watch on pullbacks. Reported earnings increases above the +25% minimum earnings guideline (C criteria) in the past 5 quarterly comparisons through Jun '23. See the latest FSU analysis for more details and a new annotated graph.
>>> FEATURED STOCK ARTICLE : Medpace Posted a Solid Volume-Driven Gain for a New High - 7/25/2023 |
View all notes |
Set NEW NOTE alert |
Company Profile |
SEC
News |
Chart |
Request a new note
C
A
S
I |
|
|
|
THESE ARE NOT BUY RECOMMENDATIONS!
Comments contained in the body of this report are technical
opinions only. The material herein has been obtained
from sources believed to be reliable and accurate, however,
its accuracy and completeness cannot be guaranteed.
This site is not an investment advisor, hence it does
not endorse or recommend any securities or other investments.
Any recommendation contained in this report may not
be suitable for all investors and it is not to be deemed
an offer or solicitation on our part with respect to
the purchase or sale of any securities. All trademarks,
service marks and trade names appearing in this report
are the property of their respective owners, and are
likewise used for identification purposes only.
This report is a service available
only to active Paid Premium Members.
You may opt-out of receiving report notifications
at any time. Questions or comments may be submitted
by writing to Premium Membership Services 665 S.E. 10 Street, Suite 201 Deerfield Beach, FL 33441-5634 or by calling 1-800-965-8307
or 954-785-1121.
|
|
|