You are not logged in.
This means you
CAN ONLY VIEW reports that were published prior to Saturday, April 19, 2025.
You
MUST UPGRADE YOUR MEMBERSHIP if you want to see any current reports.
AFTER MARKET UPDATE - MONDAY, JULY 24TH, 2023
Previous After Market Report Next After Market Report >>>
|
|
|
|
DOW |
+183.55 |
35,411.24 |
+0.52% |
|
Volume |
794,425,239 |
-13% |
|
Volume |
4,113,805,500 |
-24% |
|
NASDAQ |
+26.06 |
14,058.87 |
+0.19% |
|
Advancers |
1,790 |
62% |
|
Advancers |
2,130 |
48% |
|
S&P 500 |
+18.30 |
4,554.64 |
+0.40% |
|
Decliners |
1,106 |
38% |
|
Decliners |
2,307 |
52% |
|
Russell 2000 |
+5.42 |
1,965.68 |
+0.28% |
|
52 Wk Highs |
99 |
|
|
52 Wk Highs |
94 |
|
|
S&P 600 |
+7.72 |
1,264.47 |
+0.61% |
|
52 Wk Lows |
9 |
|
|
52 Wk Lows |
96 |
|
|
 |
Major Averages Rose With Lighter Volume Totals
Kenneth J. Gruneisen - Passed the CAN SLIM® Master's Exam
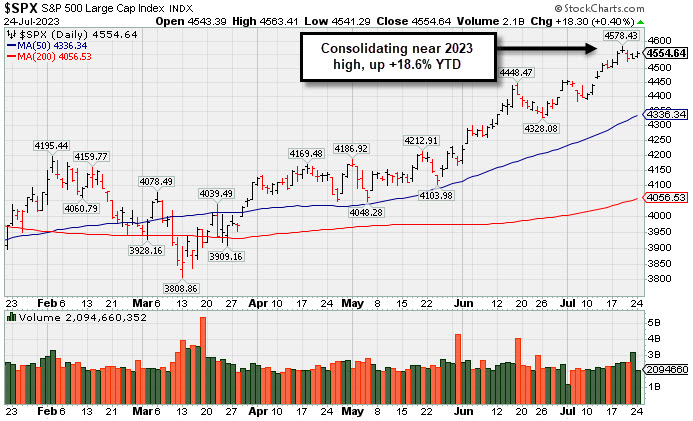
The Dow Jones Industrial Average registered its eleventh consecutive gain as many blue chip stocks outperformed. The volume totals reported were lighter on the NYSE and on the Nasdaq exchange versus the prior session. Advancers led deliners by a 3-2 margin on the NYSE but declienrs edged out advancers by a narrow margin on the Nasdaq exchange. Leadership improved as there were 42 high-ranked companies from the Leaders List that hit a new 52-week high and were listed on the BreakOuts Page, versus the total of 26 on the prior session. New 52-week highs outnumbered new 52-week lows on the NYSE but new lows barely outnumbered new highs on the Nasdaq exchange. The major indices are in a confirmed uptrend (M criteria). Appropriate new buying efforts may be considered under the fact-based investment system.
PICTURED: The S&P 500 Index is consolidating near its 2023 high, up 18.6% year-to-date.
Nine of the 11 S&P 500 sectors rose. Energy (+1.7%) was the top performer, with a gain in Chevron (CVX +2.0%), which said it expects Q2 EPS to be above consensus. Oil prices rose ($78.83/bbl, +1.78, +2.3%). The financials (+1.0%) and real estate (+1.0%) sectors were also winning standouts. Meanwhile, utilities (-0.3%) and health care (-0.2%) sectors fell. A heavy batch of earnings this week includes Alphabet (GOOG +1.3%) and Microsoft (MSFT +0.4%) after the close on Tuesday and Meta Platforms (META -0.9%) after the close on Wednesday. Meanwhile, several central banks will announce policy decisions including the Fed on Wednesday, the ECB on Thursday, and the Bank of Japan on Friday.
Treasuries yields ultimately settled close to their highs for the day as the market digested an okay 2-yr note auction and readied itself for a $43 bln 5-yr note auction on Tuesday. The 2-yr note yield rose three basis points to 4.88% and the 10-yr note yield rose one basis point to 3.86%.
|
 Kenneth J. Gruneisen started out as a licensed stockbroker in August 1987, a couple of months prior to the historic stock market crash that took the Dow Jones Industrial Average down -22.6% in a single day. He has published daily fact-based fundamental and technical analysis on high-ranked stocks online for two decades. Through FACTBASEDINVESTING.COM, Kenneth provides educational articles, news, market commentary, and other information regarding proven investment systems that work in good times and bad.
Comments contained in the body of this report are technical opinions only and are not necessarily those of Gruneisen Growth Corp. The material herein has been obtained from sources believed to be reliable and accurate, however, its accuracy and completeness cannot be guaranteed. Our firm, employees, and customers may effect transactions, including transactions contrary to any recommendation herein, or have positions in the securities mentioned herein or options with respect thereto. Any recommendation contained in this report may not be suitable for all investors and it is not to be deemed an offer or solicitation on our part with respect to the purchase or sale of any securities. |
|
 |
Financial and Energy-Linked Groups Posted Gains
Kenneth J. Gruneisen - Passed the CAN SLIM® Master's Exam
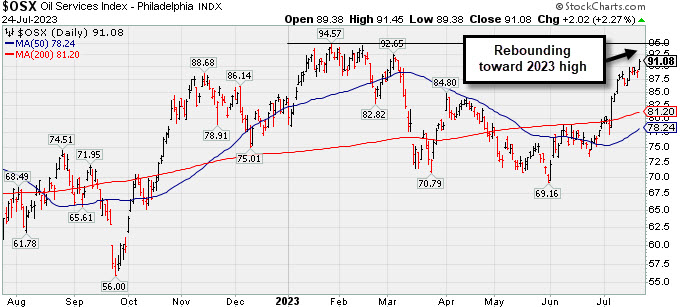
The Bank Index ($BKX +1.71%) and the Broker/Dealer Index ($XBD +0.78%) posted gains but the Retail Index ($RLX -0.16%) inched lower. The tech sector had a slightly negative bias as the Biotech Index ($BTK -1.467%) outpaced the Semiconductor Index ($SOX -0.18%) and the Networking Index ($NWX -0.34%) to the downside. The Oil Services Index ($OSX +2.27%) andf the Integrated Oil Index ($XOI +1.80%) posted solid gains while the Gold & Silver Index ($XAU -0.14%) ended slightly in the red.
PICTURED: The Oil Services Index ($OSX +2.27%) is rebounding toward its 2023 high.
| Oil Services |
$OSX |
91.08 |
+2.02 |
+2.27% |
+8.61% |
| Integrated Oil |
$XOI |
1,797.94 |
+31.87 |
+1.80% |
+0.60% |
| Semiconductor |
$SOX |
3,692.32 |
-6.53 |
-0.18% |
+45.82% |
| Networking |
$NWX |
829.54 |
-2.81 |
-0.34% |
+5.90% |
| Broker/Dealer |
$XBD |
516.54 |
+4.02 |
+0.78% |
+15.01% |
| Retail |
$RLX |
3,489.63 |
-5.68 |
-0.16% |
+26.71% |
| Gold & Silver |
$XAU |
126.31 |
-0.17 |
-0.14% |
+4.51% |
| Bank |
$BKX |
89.17 |
+1.50 |
+1.71% |
-11.58% |
| Biotech |
$BTK |
5,332.93 |
-78.83 |
-1.46% |
+0.98% |
|
|
|
 |
Pulled Back Abruptly to 50-Day Moving Average Line
Kenneth J. Gruneisen - Passed the CAN SLIM® Master's Exam
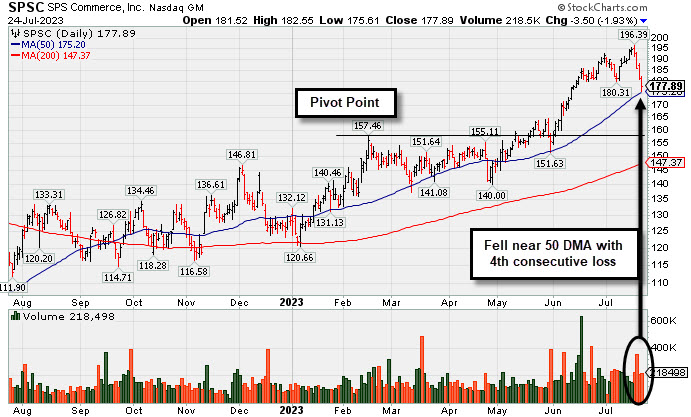
SPS Commerce (SPSC -1.93% or $177.89) suffered a 4th consecutive loss today, slumping near its 50-day moving average (DMA) line which defines important near-term support to watch. Keep in mind it is due top report Jun '23 quarterly results on 7/27/23. Volume and volatility often increase near earnings news.
Recently it reported Mar '23 quarterly earnings +22% on +20% versus the year-ago period, below the +25% minimum earnings guideline (C criteria) raising some fundamental concerns. Two of the 4 latest quarterly comparisons were above the +25% minimum earnings guideline (C criteria). Annual earnings (A criteria) history has been strong and it still has an Earnings Per Share Rating of 98.
SPSC was highlighted in yellow in the 4/24/23 mid-day report with new pivot point cited based on its 2/15/23 high plus 10 cents. It was last shown in this FSU section in greater detail on 6/21/23 with an annotated graph under the headline, "Perched Near High Following Noted Volume-Driven Gains".
SPSC hails from the Computer Software - Spec Enterprise group which is currently ranked 4th on the 197 Industry Groups list (L criteria). The number of top-rated funds owning its shares rose from 562 in Sep '22 to 601 in Jun '23, a reassuring sign concerning the I criteria. Its current Up/Down Volume Ratio of 1.5 is an unbiased indication its shares have been under accumulation over the past 50 days. It has a Timeliness Rating of A and Sponsorship Rating of B. The small supply of 36.5 million shares outstanding (S criteria) can contribute to greater price volatility in the event of institutional buying or selling. A 2:1 split impacted share price on 8/23/19. Charts courtesy of www.stockcharts.com
 |
|
|
Color Codes Explained :
Y - Better candidates highlighted by our
staff of experts.
G - Previously featured
in past reports as yellow but may no longer be buyable under the
guidelines.
***Last / Change / Volume data in this table is the closing quote data***
Symbol/Exchange
Company Name
Industry Group |
PRICE |
CHANGE
(%Change) |
Day High |
Volume
(% DAV)
(% 50 day avg vol) |
52 Wk Hi
% From Hi |
Featured
Date |
Price
Featured |
Pivot Featured |
|
Max Buy |
 STRL
-
NASDAQ
STRL
-
NASDAQ
Sterling Infrastructure
Bldg-Heavy Construction
|
$57.26
|
-0.70
-1.21% |
$58.14
|
592,863
188.81% of 50 DAV
50 DAV is 314,000
|
$60.58
-5.48%
|
12/14/2022
|
$32.41
|
PP = $33.72
|
|
MB = $35.41
|
 Most Recent Note - 7/24/2023 5:58:45 PM
G - Pulled back with higher volume behind today's 4th consecutive loss off its all-time high. It is very extended from any sound base and its 50 DMA line defines near-term support to watch. Mar '23 quarterly earnings were below the +25% minimum guideline (C criteria) raising fundamental concerns.
>>> FEATURED STOCK ARTICLE : Streak of Gains Lifts Sterling Infrastructure to New Highs - 7/3/2023 |
View all notes |
Set NEW NOTE alert |
Company Profile |
SEC
News |
Chart |
Request a new note
C
A
S
I |
FIX
-
NYSE
Comfort Systems USA
Bldg-A/C and Heating Prds
|
$167.09
|
+2.30
1.40% |
$167.46
|
143,777
62.51% of 50 DAV
50 DAV is 230,000
|
$172.02
-2.87%
|
4/27/2023
|
$148.85
|
PP = $152.23
|
|
MB = $159.84
|
Most Recent Note - 7/19/2023 6:27:35 PM
G - Pulled back today with below-average after hitting a new all-time high on the prior session. No resistance remains due to overhead supply. Its 50 DMA line ($157.48) defines important near-term support to watch on pullbacks. See the latest FSU analysis for more details and a new annotated graph.
>>> FEATURED STOCK ARTICLE : Pulled Back From High With Lighter Volume - 7/19/2023 |
View all notes |
Set NEW NOTE alert |
Company Profile |
SEC
News |
Chart |
Request a new note
C
A
S
I |
KOF
-
NYSE
Coca-Cola Femsa ADR
Beverages-Non-Alcoholic
|
$81.86
|
-1.47
-1.76% |
$83.49
|
272,568
165.19% of 50 DAV
50 DAV is 165,000
|
$91.23
-10.27%
|
6/9/2023
|
$88.61
|
PP = $91.33
|
|
MB = $95.90
|
Most Recent Note - 7/20/2023 1:18:11 PM
G - Pulling back with below-average volume behind recent losses. The longer it lingers below its 50 DMA line the worse its outlook gets. A rebound above the 50 DMA line ($85.81) is needed for its outlook to improve. Fundamentals remain strong.
>>> FEATURED STOCK ARTICLE : Slumping Below 50-Day Moving Average and Below Prior Low - 7/6/2023 |
View all notes |
Set NEW NOTE alert |
Company Profile |
SEC
News |
Chart |
Request a new note
C
A
S
I |
CLH
-
NYSE
Clean Harbors
Pollution Control
|
$169.32
|
+0.18
0.11% |
$170.26
|
310,381
81.25% of 50 DAV
50 DAV is 382,000
|
$172.54
-1.87%
|
3/10/2023
|
$136.89
|
PP = $136.74
|
|
MB = $143.58
|
Most Recent Note - 7/18/2023 5:55:58 PM
G - Volume totals have been cooling after a noted "negative reversal" at its all-time high. It is extended from any sound base. Its 50 DMA line ($152.82) defines important near-term support to watch on pullbacks. Fundamentals remain strong. See the latest FSU analysis for more details and a new annotated graph.
>>> FEATURED STOCK ARTICLE : Negative Reversal at High After +26% Rally in 4 Months - 7/18/2023 |
View all notes |
Set NEW NOTE alert |
Company Profile |
SEC
News |
Chart |
Request a new note
C
A
S
I |
SPSC
-
NASDAQ
SPS Commerce
Comp Sftwr-Spec Enterprs
|
$177.89
|
-3.50
-1.93% |
$182.55
|
218,497
109.80% of 50 DAV
50 DAV is 199,000
|
$196.39
-9.42%
|
4/24/2023
|
$150.01
|
PP = $157.56
|
|
MB = $165.44
|
Most Recent Note - 7/24/2023 5:43:40 PM
G - Pulled back nearly testing its 50 DMA line ($175) with today's 4th consecutive loss. Due to report Jun '23 quarterly results on 7/27/23. See the latest FSU analysis for more details and a new annotated graph.
>>> FEATURED STOCK ARTICLE : Pulled Back Abruptly to 50-Day Moving Average Line - 7/24/2023 |
View all notes |
Set NEW NOTE alert |
Company Profile |
SEC
News |
Chart |
Request a new note
C
A
S
I |
Symbol/Exchange
Company Name
Industry Group |
PRICE |
CHANGE
(%Change) |
Day High |
Volume
(% DAV)
(% 50 day avg vol) |
52 Wk Hi
% From Hi |
Featured
Date |
Price
Featured |
Pivot Featured |
|
Max Buy |
HUBB
-
NYSE
Hubbell
Electrical-Power/Equipmt
|
$333.78
|
+0.04
0.01% |
$336.62
|
542,622
145.09% of 50 DAV
50 DAV is 374,000
|
$340.06
-1.85%
|
4/25/2023
|
$262.85
|
PP = $257.51
|
|
MB = $270.39
|
Most Recent Note - 7/20/2023 1:19:24 PM
G - Touched another new all-time high today. Very extended from the prior base. Its 50 DMA line ($307) defines initial support to watch on pullbacks. Fundamentals remain strong.
>>> FEATURED STOCK ARTICLE : Hubbell on Track for 11th Weekly Gain - 6/22/2023 |
View all notes |
Set NEW NOTE alert |
Company Profile |
SEC
News |
Chart |
Request a new note
C
A
S
I |
NVR
-
NYSE
NVR
Bldg-Resident/Comml
|
$6,230.69
|
-14.00
-0.22% |
$6,298.03
|
14,645
63.67% of 50 DAV
50 DAV is 23,000
|
$6,474.53
-3.77%
|
4/25/2023
|
$5,882.18
|
PP = $5,978.25
|
|
MB = $6,277.16
|
Most Recent Note - 7/20/2023 1:13:57 PM
G - Due to report Jun '23 quarterly results. The Mar '23 quarter was noted as it raised fundamental concerns. Pulling back today undercutting its "max buy" level after recently wedging to a new all-time high. Its prior low ($6,009 on 7/06) and 50 DMA line ($5,984) define near-term support watch.
>>> FEATURED STOCK ARTICLE : New High Close for Strong Homebuilder - 6/30/2023 |
View all notes |
Set NEW NOTE alert |
Company Profile |
SEC
News |
Chart |
Request a new note
C
A
S
I |
PHM
-
NYSE
PulteGroup
Bldg-Resident/Comml
|
$78.53
|
+0.44
0.56% |
$78.59
|
2,840,809
104.21% of 50 DAV
50 DAV is 2,726,000
|
$82.97
-5.35%
|
4/25/2023
|
$65.17
|
PP = $64.01
|
|
MB = $67.21
|
Most Recent Note - 7/20/2023 12:57:08 PM
G - Gappped up and touched a new high but there was a quick "negative reversal" for a considerable loss with volume running at an above average pace. Very extended from any sound base. Reported earnings +28% for the Mar '23 quarter versus the year-ago period. Important support to watch is defined by its 50 DMA line ($73.20).
>>> FEATURED STOCK ARTICLE : Negative Reversal After Hitting Another New High - 6/26/2023 |
View all notes |
Set NEW NOTE alert |
Company Profile |
SEC
News |
Chart |
Request a new note
C
A
S
I |
AMPH
-
NASDAQ
Amphastar Pharm
Medical-Biomed/Biotech
|
$60.68
|
-0.94
-1.53% |
$62.46
|
298,529
62.98% of 50 DAV
50 DAV is 474,000
|
$63.72
-4.77%
|
5/15/2023
|
$43.56
|
PP = $44.15
|
|
MB = $46.36
|
Most Recent Note - 7/20/2023 5:12:29 PM
G - Posted a 6th consecutive gain. It did not form a sound base of sufficient length. Its 50 DMA line ($50.28) defines important support to watch above prior highs in the $44 area. Fundamentals remain strong. See the latest FSU analysis for more details and a new annotated graph.
>>> FEATURED STOCK ARTICLE : 6th Straight Gain for Amphastar - 7/20/2023 |
View all notes |
Set NEW NOTE alert |
Company Profile |
SEC
News |
Chart |
Request a new note
C
A
S
I |
ANET
-
NYSE
Arista Networks
Computer-Networking
|
$171.72
|
+0.08
0.05% |
$172.32
|
2,085,672
65.67% of 50 DAV
50 DAV is 3,176,000
|
$178.36
-3.72%
|
5/30/2023
|
$176.35
|
PP = $171.54
|
|
MB = $180.12
|
Most Recent Note - 7/21/2023 4:58:40 PM
G - Posted another gain today with below-average volume, leaving it perched near prior highs. It faces little near-term resistance due to overhead supply up to the $178 level. Fundamentals remain strong. Its 50 DMA line ($157.59) defines near-term support above the prior low ($148.32).
>>> FEATURED STOCK ARTICLE : Wedging Higher After Rebounding Above 50-Day Moving Average - 7/12/2023 |
View all notes |
Set NEW NOTE alert |
Company Profile |
SEC
News |
Chart |
Request a new note
C
A
S
I |
Symbol/Exchange
Company Name
Industry Group |
PRICE |
CHANGE
(%Change) |
Day High |
Volume
(% DAV)
(% 50 day avg vol) |
52 Wk Hi
% From Hi |
Featured
Date |
Price
Featured |
Pivot Featured |
|
Max Buy |
PANW
-
NASDAQ
Palo Alto Networks
Computer Sftwr-Security
|
$243.33
|
-0.49
-0.20% |
$245.99
|
2,502,364
37.28% of 50 DAV
50 DAV is 6,713,000
|
$258.88
-6.01%
|
6/5/2023
|
$228.35
|
PP = $213.73
|
|
MB = $224.42
|
Most Recent Note - 7/21/2023 5:00:53 PM
G - Posted a small gain today with average volume and it remains perched near its all-time high. Its 50 DMA line ($228) defines near-term support to watch. Fundamentals remain strong.
>>> FEATURED STOCK ARTICLE : Strength Continues for Network Security Leader - 6/27/2023 |
View all notes |
Set NEW NOTE alert |
Company Profile |
SEC
News |
Chart |
Request a new note
C
A
S
I |
LSCC
-
NASDAQ
Lattice Semiconductor
Elec-Semicondctor Fablss
|
$86.47
|
-0.98
-1.12% |
$88.53
|
1,069,587
45.85% of 50 DAV
50 DAV is 2,333,000
|
$98.18
-11.93%
|
6/13/2023
|
$91.73
|
PP = $96.92
|
|
MB = $101.77
|
Most Recent Note - 7/20/2023 1:11:10 PM
Y - Gapped down today, abruptly pulling back after it quietly touched a new 52-week high on Tuesday. Its 50 DMA line ($87) defines near-term support to watch. Subsequent gains above the pivot point backed by at least +40% above average volume may trigger a technical buy signal. Due to report Jun '23 quarterly results on 7/31/23.
>>> FEATURED STOCK ARTICLE : Perched Near Pivot Point After Best-Ever Close - 7/17/2023 |
View all notes |
Set NEW NOTE alert |
Company Profile |
SEC
News |
Chart |
Request a new note
C
A
S
I |
XPEL
-
NASDAQ
XPEL
Auto/Truck-Replace Parts
|
$79.49
|
-0.78
-0.97% |
$81.06
|
72,035
54.57% of 50 DAV
50 DAV is 132,000
|
$87.46
-9.11%
|
6/28/2023
|
$83.14
|
PP = $87.11
|
|
MB = $91.47
|
Most Recent Note - 7/20/2023 1:25:43 PM
Y - Volume totals have been cooling while consolidating after hitting a new 52-week high with volume-driven gains last week. Perched near the pivot point cited based on its 8/15/23 high plus 10 cents. Reported Mar '23 quarterly earnings +46% on +19% sales revenues versus the year ago period, its 3rd quarterly comparison above the +25% minimum earnings guideline (C criteria), helping it better match the winning models of the fact-based investment system.
>>> FEATURED STOCK ARTICLE : XPEL Returns to Featured Stocks List After Long Consolidation - 6/28/2023 |
View all notes |
Set NEW NOTE alert |
Company Profile |
SEC
News |
Chart |
Request a new note
C
A
S
I |
FTNT
-
NASDAQ
Fortinet
Computer Sftwr-Security
|
$77.27
|
-0.89
-1.14% |
$78.82
|
3,794,355
69.53% of 50 DAV
50 DAV is 5,457,000
|
$81.24
-4.89%
|
7/10/2023
|
$78.29
|
PP = $74.45
|
|
MB = $78.17
|
Most Recent Note - 7/24/2023 5:56:43 PM
Y - Color code is changed to yellow after pulling back with light volume below its "max buy" level. Its prior high in the $74 area defines support above its 50 DMA line ($72.22) Fundamentals remain strong.
>>> FEATURED STOCK ARTICLE : Fortinet Powered to New All-Time High - 7/10/2023 |
View all notes |
Set NEW NOTE alert |
Company Profile |
SEC
News |
Chart |
Request a new note
C
A
S
I |
PII
-
NYSE
Polaris
Leisure-Products
|
$134.53
|
+0.15
0.11% |
$136.55
|
734,225
133.98% of 50 DAV
50 DAV is 548,000
|
$135.83
-0.96%
|
7/11/2023
|
$126.92
|
PP = $123.97
|
|
MB = $130.17
|
Most Recent Note - 7/18/2023 6:09:18 PM
G - Color code is changed to green after rallying above its "max buy" level with today's volume-driven gain adding to a recent spurt higher. On pullbacks, the prior highs define initial support to watch above its 50 DMA line.
>>> FEATURED STOCK ARTICLE : Volume-Driven Breakout for Polaris - 7/11/2023 |
View all notes |
Set NEW NOTE alert |
Company Profile |
SEC
News |
Chart |
Request a new note
C
A
S
I |
Symbol/Exchange
Company Name
Industry Group |
PRICE |
CHANGE
(%Change) |
Day High |
Volume
(% DAV)
(% 50 day avg vol) |
52 Wk Hi
% From Hi |
Featured
Date |
Price
Featured |
Pivot Featured |
|
Max Buy |
ALGM
-
NASDAQ
Allegro MicroSystems
Elec-Semicondctor Fablss
|
$47.88
|
-1.67
-3.37% |
$49.82
|
1,834,812
120.63% of 50 DAV
50 DAV is 1,521,000
|
$53.05
-9.75%
|
7/13/2023
|
$49.86
|
PP = $48.82
|
|
MB = $51.26
|
Most Recent Note - 7/24/2023 6:03:56 PM
Y - Down today for a 4th consecutive loss with above-average volume, slumping from its all-time high and back below the pivot point raising concerns. Due to report Jun '23 quarterly earnings news on 7/27/23. Volume and volatility often increase near earnings news. Disciplined investors always limit losses by selling any stock that falls more than -8% from their purchase price.
>>> FEATURED STOCK ARTICLE : Volume Heavy Behind Considerable Breakout Gain - 7/13/2023 |
View all notes |
Set NEW NOTE alert |
Company Profile |
SEC
News |
Chart |
Request a new note
C
A
S
I |
ESQ
-
NASDAQ
Esquire Finl Hldgs
Finance-Commercial Loans
|
$49.93
|
+1.01
2.06% |
$49.97
|
21,081
72.69% of 50 DAV
50 DAV is 29,000
|
$49.38
1.11%
|
7/14/2023
|
$45.80
|
PP = $48.23
|
|
MB = $50.64
|
Most Recent Note - 7/24/2023 5:53:59 PM
Y - Posted a 3rd consecutive gain today with below-average volume, hitting a new all-time high and approaching its "max buy" level. Found support above its 50 DMA line on the recent pullback. Gains above the pivot point must be backed by at least +40% above average volume to trigger a proper technical buy signal.
>>> FEATURED STOCK ARTICLE : Esquire Perched Near Prior Highs - 7/14/2023 |
View all notes |
Set NEW NOTE alert |
Company Profile |
SEC
News |
Chart |
Request a new note
C
A
S
I |
|
|
|
THESE ARE NOT BUY RECOMMENDATIONS!
Comments contained in the body of this report are technical
opinions only. The material herein has been obtained
from sources believed to be reliable and accurate, however,
its accuracy and completeness cannot be guaranteed.
This site is not an investment advisor, hence it does
not endorse or recommend any securities or other investments.
Any recommendation contained in this report may not
be suitable for all investors and it is not to be deemed
an offer or solicitation on our part with respect to
the purchase or sale of any securities. All trademarks,
service marks and trade names appearing in this report
are the property of their respective owners, and are
likewise used for identification purposes only.
This report is a service available
only to active Paid Premium Members.
You may opt-out of receiving report notifications
at any time. Questions or comments may be submitted
by writing to Premium Membership Services 665 S.E. 10 Street, Suite 201 Deerfield Beach, FL 33441-5634 or by calling 1-800-965-8307
or 954-785-1121.
|
|
|