You are not logged in.
This means you
CAN ONLY VIEW reports that were published prior to Thursday, March 13, 2025.
You
MUST UPGRADE YOUR MEMBERSHIP if you want to see any current reports.
AFTER MARKET UPDATE - THURSDAY, JUNE 22ND, 2023
Previous After Market Report Next After Market Report >>>
|
|
|
|
DOW |
-4.81 |
33,946.71 |
-0.01% |
|
Volume |
844,288,036 |
-10% |
|
Volume |
4,524,582,900 |
-14% |
|
NASDAQ |
+128.41 |
13,630.61 |
+0.95% |
|
Advancers |
965 |
34% |
|
Advancers |
1,595 |
37% |
|
S&P 500 |
+16.20 |
4,381.89 |
+0.37% |
|
Decliners |
1,889 |
66% |
|
Decliners |
2,761 |
63% |
|
Russell 2000 |
-14.84 |
1,848.18 |
-0.80% |
|
52 Wk Highs |
51 |
|
|
52 Wk Highs |
69 |
|
|
S&P 600 |
-12.09 |
1,185.87 |
-1.01% |
|
52 Wk Lows |
34 |
|
|
52 Wk Lows |
126 |
|
|
 |
Tech-Heavy Nasdaq Composite Led as Major Indexes Ended Mixed
Kenneth J. Gruneisen - Passed the CAN SLIM® Master's Exam
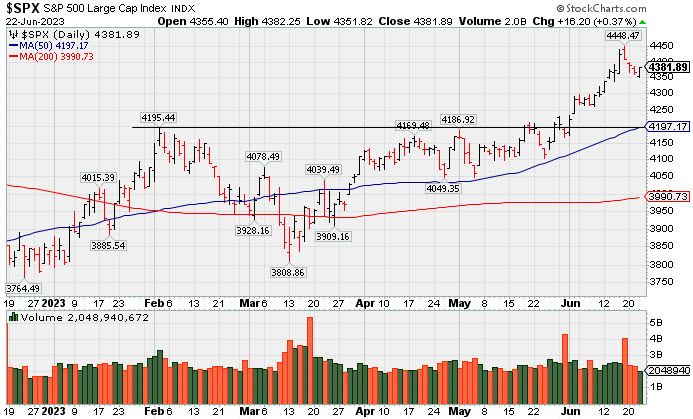
The Dow fell 4 points (-0.01%), while the S&P 500 rose 0.4% and the Nasdaq Composite advanced 1.0%. Volume totals reported were lighter on the NYSE and on the Nasdaq exchange versus the prior session. Breadth was negative as decliners led advancers by about a 2-1 margin on the NYSE and by more than a 3-2 margin on the Nasdaq exchange. Leadership thinned as there were 29 high-ranked companies from the Leaders List that hit a new 52-week high and were listed on the BreakOuts Page, versus the total of 54 on the prior session. New 52-week highs totals outnumbered new 52-week lows on the NYSE, but new lows outnumbered new highs for the 3rd consecutive session on the Nasdaq exchange. The major indices are in a confirmed uptrend (M criteria). Appropriate new buying efforts may be considered under the fact-based investment system.
PICTURED: The S&P 500 Index is consolidating after hitting a new 2023 high.
Five of 11 sectors rose while U.S. equities were mixed on Thursday, with the S&P 500 and Nasdaq Composite recovering from losses early in trading. Investors reacted to economic data and hawkish commentary from the Federal Reserve (Fed). Consumer Discretionary led the way, up 1.5%.
Treasuries weakened today. The yield on the 10-year note rose seven basis points (0.07%) to 3.79%, and the 30-year bond yield was up six basis points (0.06%) to 3.87%. Meanwhile, the yield on the two-year note climbed eight basis points (0.08%) to 4.78%.
On the data front today, initial jobless claims for the week ended June 17 came in higher than expected, holding steady at 264,000 from the prior week’s slight upward revision, suggesting the labor market is cooling somewhat. Continuing claims fell 13,000 to 1.759 million. On the housing data front, existing home sales beat expectations, increasing 0.2% to 4.3 million. Meanwhile, the Conference Board U.S. Leading Index of economic indicators fell 0.7% in May, continuing to signal an economic slowdown.
In the central bank arena, Fed Chair Jerome Powell wrapped up his testimony to the Senate Banking Panel where he reiterated that the Fed is not done hiking rates. Meanwhile in comments to the Cleveland Fed, Fed Governor Michelle Bowman reinforced that “additional policy-rate increases will be necessary to bring inflation down to our target over time.”
In commodities, West Texas Intermediate (WTI) crude fell 4.3% to $69.43/barrel on lingering demand concerns. |
 Kenneth J. Gruneisen started out as a licensed stockbroker in August 1987, a couple of months prior to the historic stock market crash that took the Dow Jones Industrial Average down -22.6% in a single day. He has published daily fact-based fundamental and technical analysis on high-ranked stocks online for two decades. Through FACTBASEDINVESTING.COM, Kenneth provides educational articles, news, market commentary, and other information regarding proven investment systems that work in good times and bad.
Comments contained in the body of this report are technical opinions only and are not necessarily those of Gruneisen Growth Corp. The material herein has been obtained from sources believed to be reliable and accurate, however, its accuracy and completeness cannot be guaranteed. Our firm, employees, and customers may effect transactions, including transactions contrary to any recommendation herein, or have positions in the securities mentioned herein or options with respect thereto. Any recommendation contained in this report may not be suitable for all investors and it is not to be deemed an offer or solicitation on our part with respect to the purchase or sale of any securities. |
|
 |
Retail Index Posts Standout Gain and Tech Indexes Edged Higher
Kenneth J. Gruneisen - Passed the CAN SLIM® Master's Exam
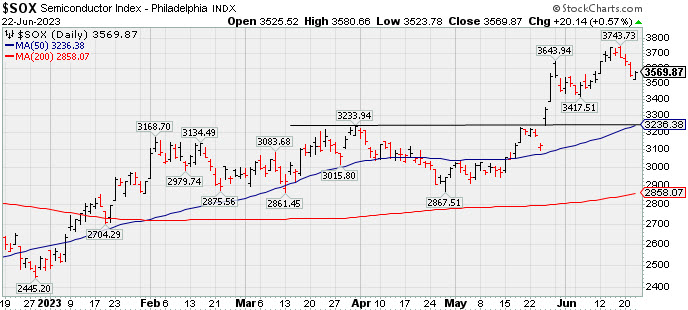
The Bank Index ($BKX -2.32%), Broker/Dealer Index ($XBD -1.44%) both lost ground while the Retail Index ($RLX +2.46%) helped offset the drag on the major averages as it posted a solid gain. The Semiconductor Index ($SOX +0.57%), Networking Index ($NWX +0.22%), and the Biotech Index ($BTK +0.23%) each posted modest gains. The energy-linked groups fell as the Integrated Oil Index ($XOI -1.42%) and the Oil Services Index ($OSX -1.66%) each lost ground, and the Gold & Silver Index ($XAU -0.27%) also edged lower.
PICTURED: The Semiconductor Index ($SOX +0.57%) is consolidating near its 2023 high after rallying well above prior highs and its 50-day moving average (DMA) line.
| Oil Services |
$OSX |
75.42 |
-1.27 |
-1.66% |
-10.06% |
| Integrated Oil |
$XOI |
1,622.85 |
-23.32 |
-1.42% |
-9.20% |
| Semiconductor |
$SOX |
3,569.87 |
+20.14 |
+0.57% |
+40.98% |
| Networking |
$NWX |
816.37 |
+1.79 |
+0.22% |
+4.22% |
| Broker/Dealer |
$XBD |
465.69 |
-6.81 |
-1.44% |
+3.69% |
| Retail |
$RLX |
3,423.44 |
+82.17 |
+2.46% |
+24.31% |
| Gold & Silver |
$XAU |
118.95 |
-0.32 |
-0.27% |
-1.58% |
| Bank |
$BKX |
78.44 |
-1.87 |
-2.32% |
-22.22% |
| Biotech |
$BTK |
5,446.77 |
+12.43 |
+0.23% |
+3.14% |
|
|
|
 |
Hubbell on Track for 11th Weekly Gain
Kenneth J. Gruneisen - Passed the CAN SLIM® Master's Exam
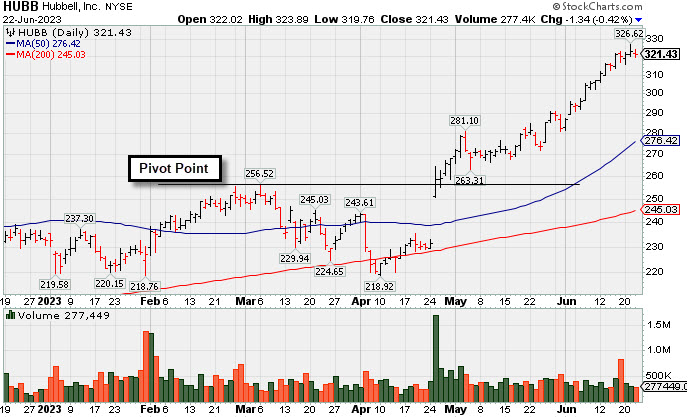
Hubbell (HUBB -$1.34 or -0.42% to $321.43) pulled back today with below-average volume following a new all-time high. It is very extended from the prior base and on track for an 11th consecutive weekly gain. Prior highs in the $263 area define initial support to watch on pullbacks. Fundamentals remain strong.
HUBB was highlighted yellow in the 4/25/23 mid-day report (read here) with pivot point cited based on its 3/06/23 high as it gapped up after a 4-month "double bottom" base. It was last shown in great detail in this FSU section on 6/01/23 with an annotated graph under the headline "Extended From Prior Base and Perched Near High". Strong action came after it reported strong Mar '23 quarterly earnings +70% on +11% sales revenues over the year-ago period. Its Mar, Jun, Sep, and Dec '22 quarterly earnings increases were above the +25% minimum (C criteria). Annual earnings history (A criteria) had a downturn in FY '20 like many companies during the pandemic. It has a 94 Earnings Per Share Rating, well above the 80+ minimum for buy candidates..The high-ranked Electrical-Power/Equipmt firm has 53.6 million shares outstanding (S criteria) which can contribute to greater price volatility in the event of institutional buying or selling. The number of top-rated funds owning its shares rose from 805 in Jun '22 to 1,335 in Mar '23, a reassuring sign concerning the I criteria. The current Up/Down Volume Ratio of 2.3 is an unbiased indication it has been under accumulation over the past 50 days. It has an A Timeliness Rating and a C Sponsorship Rating.
|
|
|
Color Codes Explained :
Y - Better candidates highlighted by our
staff of experts.
G - Previously featured
in past reports as yellow but may no longer be buyable under the
guidelines.
***Last / Change / Volume data in this table is the closing quote data***
Symbol/Exchange
Company Name
Industry Group |
PRICE |
CHANGE
(%Change) |
Day High |
Volume
(% DAV)
(% 50 day avg vol) |
52 Wk Hi
% From Hi |
Featured
Date |
Price
Featured |
Pivot Featured |
|
Max Buy |
 GPK
-
NYSE
GPK
-
NYSE
Graphic Packaging Hldg
CONSUMER NON-DURABLES - Packaging and Containers
|
$23.96
|
-0.45
-1.84% |
$24.22
|
5,525,571
129.86% of 50 DAV
50 DAV is 4,255,000
|
$27.56
-13.06%
|
10/25/2022
|
$22.75
|
PP = $24.17
|
|
MB = $25.38
|
 Most Recent Note - 6/22/2023 3:59:03 PM
G - Undercut the prior low (23.75) today while slumping near its 200 DMA line ($23.33). Violation of its 50 DMA line ($25.24) raised concerns following a noted "negative reversal" on 6/13/23. A rebound above the 50 DMA line is needed to help its outlook improve. It was repeatedly noted - "It did not form a sound new base of sufficient length but quickly recovered after testing its 4/27/23 low. Reported Mar '23 quarterly earnings +60% on +9% sales revenues versus the year-ago period."
>>> FEATURED STOCK ARTICLE : Graphic Packaging Hits New High With 6th Consecutive Gain - 6/8/2023 |
View all notes |
Set NEW NOTE alert |
Company Profile |
SEC
News |
Chart |
Request a new note
C
A
S
I |
STRL
-
NASDAQ
Sterling Infrastructure
Bldg-Heavy Construction
|
$52.99
|
+1.18
2.28% |
$53.36
|
293,758
108.00% of 50 DAV
50 DAV is 272,000
|
$54.44
-2.66%
|
12/14/2022
|
$32.41
|
PP = $33.72
|
|
MB = $35.41
|
Most Recent Note - 6/22/2023 5:27:54 PM
G - Posted a volume-driven gain today. It has been holding its ground stubbornly near its all-time high, extended from any sound base. Mar '23 quarterly earnings were below the +25% minimum guideline (C criteria) raising fundamental concerns.
>>> FEATURED STOCK ARTICLE : Impressive Streak of Gains for New Highs - 6/7/2023 |
View all notes |
Set NEW NOTE alert |
Company Profile |
SEC
News |
Chart |
Request a new note
C
A
S
I |
FIX
-
NYSE
Comfort Systems USA
Bldg-A/C and Heating Prds
|
$162.08
|
-2.27
-1.38% |
$164.93
|
183,942
66.89% of 50 DAV
50 DAV is 275,000
|
$165.05
-1.80%
|
4/27/2023
|
$148.85
|
PP = $152.23
|
|
MB = $159.84
|
Most Recent Note - 6/21/2023 7:09:49 PM
G - Posted a gain today with below-average volume for a best-ever close. It is extended from the prior base and no resistance remains due to overhead supply. Prior highs in the $152-156 area define initial support to watch above its 50 DMA line ($148).
>>> FEATURED STOCK ARTICLE : "Negative Reversal" Following Recent Volume-Driven Gains - 6/16/2023 |
View all notes |
Set NEW NOTE alert |
Company Profile |
SEC
News |
Chart |
Request a new note
C
A
S
I |
KOF
-
NYSE
Coca-Cola Femsa ADR
Beverages-Non-Alcoholic
|
$88.24
|
-0.13
-0.15% |
$88.52
|
91,017
51.13% of 50 DAV
50 DAV is 178,000
|
$91.23
-3.28%
|
6/9/2023
|
$88.61
|
PP = $91.33
|
|
MB = $95.90
|
Most Recent Note - 6/20/2023 5:42:55 PM
Y - Volume totals have been cooling while stubbornly holding its ground perched within striking distance of its 52-week high. Found support near its 50 DMA line ($86) during its recent consolidation. Subsequent gains above the pivot point backed by at least +40% above average volume may trigger a technical buy signal. Fundamentals remain strong.
>>> FEATURED STOCK ARTICLE : Coca-Cola Femsa Posts 7th Consecutive Gain - 6/9/2023 |
View all notes |
Set NEW NOTE alert |
Company Profile |
SEC
News |
Chart |
Request a new note
C
A
S
I |
CLH
-
NYSE
Clean Harbors
Pollution Control
|
$154.26
|
-5.28
-3.31% |
$158.98
|
524,179
136.50% of 50 DAV
50 DAV is 384,000
|
$160.50
-3.89%
|
3/10/2023
|
$136.89
|
PP = $136.74
|
|
MB = $143.58
|
Most Recent Note - 6/22/2023 3:52:29 PM
G - Pulling back from its all-time high with today's loss after 4 consecutive gains. Very extended from any sound base. Its 50 DMA line ($145.72) defines near-term support to watch on pullbacks. Fundamentals remain strong.
>>> FEATURED STOCK ARTICLE : Extended From Any Sound Base and Hovering Near High - 6/15/2023 |
View all notes |
Set NEW NOTE alert |
Company Profile |
SEC
News |
Chart |
Request a new note
C
A
S
I |
Symbol/Exchange
Company Name
Industry Group |
PRICE |
CHANGE
(%Change) |
Day High |
Volume
(% DAV)
(% 50 day avg vol) |
52 Wk Hi
% From Hi |
Featured
Date |
Price
Featured |
Pivot Featured |
|
Max Buy |
SPSC
-
NASDAQ
SPS Commerce
Comp Sftwr-Spec Enterprs
|
$183.66
|
+1.49
0.82% |
$184.80
|
133,507
79.94% of 50 DAV
50 DAV is 167,000
|
$185.99
-1.25%
|
4/24/2023
|
$150.01
|
PP = $157.56
|
|
MB = $165.44
|
Most Recent Note - 6/21/2023 7:12:30 PM
G - Pulled back slightly with lighter volume, stubbornly holding its ground near its 52-week high following an impressive streak of volume-driven gains, extended from the previously noted base. Reported Mar '23 quarterly earnings +22% on +20% versus the year-ago period, below the +25% minimum earnings guideline (C criteria) raising some fundamental concerns. See the latest FSU analysis for more details and a new annotated graph.
>>> FEATURED STOCK ARTICLE : Perched Near High Following Noted Volume-Driven Gains - 6/21/2023 |
View all notes |
Set NEW NOTE alert |
Company Profile |
SEC
News |
Chart |
Request a new note
C
A
S
I |
HUBB
-
NYSE
Hubbell
Electrical-Power/Equipmt
|
$321.43
|
-1.34
-0.42% |
$323.89
|
277,086
68.25% of 50 DAV
50 DAV is 406,000
|
$326.62
-1.59%
|
4/25/2023
|
$262.85
|
PP = $257.51
|
|
MB = $270.39
|
Most Recent Note - 6/22/2023 5:26:38 PM
G - Very extended from the prior base. Prior highs in the $263 area define initial support to watch on pullbacks. Fundamentals remain strong. See the latest FSU analysis for more details and a new annotated graph.
>>> FEATURED STOCK ARTICLE : Hubbell on Track for 11th Weekly Gain - 6/22/2023 |
View all notes |
Set NEW NOTE alert |
Company Profile |
SEC
News |
Chart |
Request a new note
C
A
S
I |
NVR
-
NYSE
NVR
Bldg-Resident/Comml
|
$6,062.57
|
+37.17
0.62% |
$6,062.98
|
18,091
75.38% of 50 DAV
50 DAV is 24,000
|
$6,079.06
-0.27%
|
4/25/2023
|
$5,882.18
|
PP = $5,978.25
|
|
MB = $6,277.16
|
Most Recent Note - 6/20/2023 5:40:52 PM
G - There was a "negative reversal" today after hitting a new all-time high, ending near the session low with a loss backed by +17% above-average volume. Its 50 DMA line ($5,781) defines near-term support above the recent low ($5,520 on 6/01/23). Reported Mar '23 quarterly earnings -14% on -3% sales revenues versus the year-ago period, below the +25% minimum earnings guideline (C criteria) raising fundamental concerns, and its color code was changed to green. Prior quarterly comparisons were well above the +25% minimum earnings guideline (C criteria). Annual earnings (A criteria) growth has been very strong.
>>> FEATURED STOCK ARTICLE : Rebounded Above 50 Day Average With Light Volume Gains - 6/6/2023 |
View all notes |
Set NEW NOTE alert |
Company Profile |
SEC
News |
Chart |
Request a new note
C
A
S
I |
PHM
-
NYSE
PulteGroup
Bldg-Resident/Comml
|
$76.05
|
+0.30
0.40% |
$76.32
|
2,357,745
77.74% of 50 DAV
50 DAV is 3,033,000
|
$75.93
0.16%
|
4/25/2023
|
$65.17
|
PP = $64.01
|
|
MB = $67.21
|
Most Recent Note - 6/20/2023 5:34:36 PM
G - Hit yet another new high with today's gain backed by below-average volume, getting more extended from any sound base. Reported earnings +28% for the Mar '23 quarter versus the year-ago period. Important support to watch is defined by its 50 DMA line ($67.06) and recent low.
>>> FEATURED STOCK ARTICLE : Rebounded Above "Max Buy" Level Toward Recent High - 6/2/2023 |
View all notes |
Set NEW NOTE alert |
Company Profile |
SEC
News |
Chart |
Request a new note
C
A
S
I |
COKE
-
NASDAQ
Coca-Cola Consolidated
Beverages-Non-Alcoholic
|
$676.97
|
+12.97
1.95% |
$676.97
|
31,899
83.94% of 50 DAV
50 DAV is 38,000
|
$694.20
-2.48%
|
5/4/2023
|
$646.66
|
PP = $656.21
|
|
MB = $689.02
|
Most Recent Note - 6/21/2023 7:16:46 PM
Y - Posted a small gain today with below-average volume. Recent lows in the $625 area define important near-term support above its 50 DMA line ($623). Fundamentals remain strong.
>>> FEATURED STOCK ARTICLE : Fell Below Pivot Point With Recent Volume-Driven Losses - 6/14/2023 |
View all notes |
Set NEW NOTE alert |
Company Profile |
SEC
News |
Chart |
Request a new note
C
A
S
I |
Symbol/Exchange
Company Name
Industry Group |
PRICE |
CHANGE
(%Change) |
Day High |
Volume
(% DAV)
(% 50 day avg vol) |
52 Wk Hi
% From Hi |
Featured
Date |
Price
Featured |
Pivot Featured |
|
Max Buy |
AMPH
-
NASDAQ
Amphastar Pharm
Medical-Biomed/Biotech
|
$58.38
|
+2.02
3.58% |
$58.70
|
574,554
125.45% of 50 DAV
50 DAV is 458,000
|
$56.61
3.13%
|
5/15/2023
|
$43.56
|
PP = $44.15
|
|
MB = $46.36
|
Most Recent Note - 6/22/2023 3:51:00 PM
G - Hitting yet another new high with today's 6th consecutive gain backed by above average volume, getting very extended from any sound base. Prior highs in the $44 area define initial support to watch above its 50 DMA line ($43.51) on pullbacks. Fundamentals remain strong.
>>> FEATURED STOCK ARTICLE : Hit Another New High With 4th Consecutive Volume-Driven Gain - 6/20/2023 |
View all notes |
Set NEW NOTE alert |
Company Profile |
SEC
News |
Chart |
Request a new note
C
A
S
I |
ANET
-
NYSE
Arista Networks
Computer-Networking
|
$153.24
|
+1.73
1.14% |
$153.39
|
3,313,875
96.05% of 50 DAV
50 DAV is 3,450,000
|
$178.36
-14.08%
|
5/30/2023
|
$176.35
|
PP = $171.54
|
|
MB = $180.12
|
Most Recent Note - 6/21/2023 7:15:08 PM
G - Color code is changed to green after slumping below its 50 DMA line ($153.62) with near-average volume behind today's 4th consecutive loss. Only a prompt rebound above the 50 DMA line would help its outlook improve. Fundamentals remain strong.
>>> FEATURED STOCK ARTICLE : Rebounding Near Recent High With 3 Consecutive Gains - 6/12/2023 |
View all notes |
Set NEW NOTE alert |
Company Profile |
SEC
News |
Chart |
Request a new note
C
A
S
I |
PANW
-
NASDAQ
Palo Alto Networks
Computer Sftwr-Security
|
$249.15
|
+10.23
4.28% |
$249.26
|
6,483,962
111.41% of 50 DAV
50 DAV is 5,820,000
|
$247.70
0.59%
|
6/5/2023
|
$228.35
|
PP = $213.73
|
|
MB = $224.42
|
Most Recent Note - 6/22/2023 3:53:47 PM
G - Hitting a new all-time high with today's gain backed by near-average volume. Very extended from the prior high ($213) which defines initial support to watch on pullbacks. Fundamentals remain strong.
>>> FEATURED STOCK ARTICLE : Palo Alto Powers to New Highs Again - 6/5/2023 |
View all notes |
Set NEW NOTE alert |
Company Profile |
SEC
News |
Chart |
Request a new note
C
A
S
I |
LSCC
-
NASDAQ
Lattice Semiconductor
Elec-Semicondctor Fablss
|
$88.30
|
+3.06
3.59% |
$88.38
|
1,821,016
74.30% of 50 DAV
50 DAV is 2,451,000
|
$96.82
-8.80%
|
6/13/2023
|
$91.73
|
PP = $96.92
|
|
MB = $101.77
|
Most Recent Note - 6/22/2023 4:00:47 PM
Y - Posting a solid gain today backed by light volume after testing its 50 DMA line ($84.79). More damaging losses would raise concerns. Subsequent gains above the pivot point backed by at least +40% above average volume may trigger a technical buy signal. Reported Mar '23 quarterly earnings +38% on +22% sales revenues versus the year-ago period, its 9th consecutive strong quarterly comparison above the +25% minimum earnings guideline (C criteria). Annual earnings history (A criteria) has been strong.
>>> FEATURED STOCK ARTICLE : Lattice Posts Volume-Driven Gains Approaching Prior High - 6/13/2023 |
View all notes |
Set NEW NOTE alert |
Company Profile |
SEC
News |
Chart |
Request a new note
C
A
S
I |
|
|
|
THESE ARE NOT BUY RECOMMENDATIONS!
Comments contained in the body of this report are technical
opinions only. The material herein has been obtained
from sources believed to be reliable and accurate, however,
its accuracy and completeness cannot be guaranteed.
This site is not an investment advisor, hence it does
not endorse or recommend any securities or other investments.
Any recommendation contained in this report may not
be suitable for all investors and it is not to be deemed
an offer or solicitation on our part with respect to
the purchase or sale of any securities. All trademarks,
service marks and trade names appearing in this report
are the property of their respective owners, and are
likewise used for identification purposes only.
This report is a service available
only to active Paid Premium Members.
You may opt-out of receiving report notifications
at any time. Questions or comments may be submitted
by writing to Premium Membership Services 665 S.E. 10 Street, Suite 201 Deerfield Beach, FL 33441-5634 or by calling 1-800-965-8307
or 954-785-1121.
|
|
|