You are not logged in.
This means you
CAN ONLY VIEW reports that were published prior to Thursday, March 20, 2025.
You
MUST UPGRADE YOUR MEMBERSHIP if you want to see any current reports.
AFTER MARKET UPDATE - TUESDAY, APRIL 27TH, 2021
Previous After Market Report Next After Market Report >>>
|
|
|
|
DOW |
+3.36 |
33,984.93 |
+0.01% |
|
Volume |
778,342,781 |
-4% |
|
Volume |
4,629,759,300 |
+4% |
|
NASDAQ |
-47.92 |
14,090.86 |
-0.34% |
|
Advancers |
1,611 |
50% |
|
Advancers |
1,904 |
46% |
|
S&P 500 |
-0.90 |
4,186.72 |
-0.02% |
|
Decliners |
1,618 |
50% |
|
Decliners |
2,276 |
54% |
|
Russell 2000 |
+3.26 |
2,301.27 |
+0.14% |
|
52 Wk Highs |
247 |
|
|
52 Wk Highs |
186 |
|
|
S&P 600 |
+3.69 |
1,360.89 |
+0.27% |
|
52 Wk Lows |
12 |
|
|
52 Wk Lows |
33 |
|
|
 |
Major Indices Indecisive on Mixed Session
Kenneth J. Gruneisen - Passed the CAN SLIM® Master's Exam
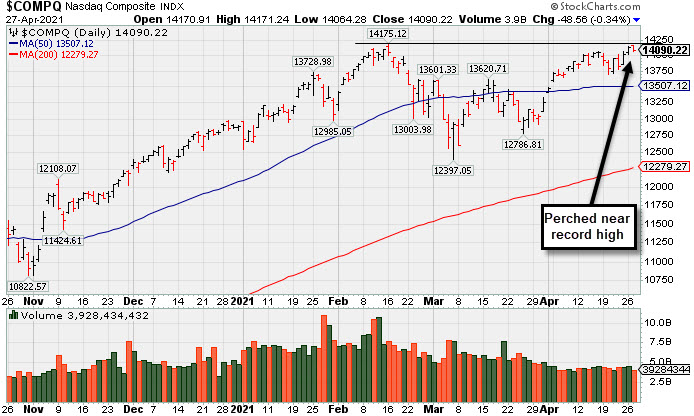
The S&P 500 finished just below the flat line, while the Nasdaq Composite fell 0.3%, after both benchmarks notched record closing levels on Monday. The Dow reversed early session losses, closing 3 points higher. The volume totals reported were mixed, lighter than the prior session on the NYSE and higher on the Nasdaq exchange. Decliners led advancers by a narrow margin on the Nasdaq exchange while the mix was even on the NYSE. There were 61 high-ranked companies from the Leaders List that hit new 52-week highs and were listed on the BreakOuts Page, versus the total of 87 on the prior session. New 52-week highs totals contracted yet still solidly outnumbered new 52-week lows on both the NYSE and the Nasdaq exchange. The major indices (M criteria) are in a confirmed uptrend. Investors are reminded to always make buying and selling decisions on case-by-case basis under the strict criteria and rules of the fact-based investment system.
PICTURED: The Nasdaq Composite Index is perched within close striking distance of a new record high.
U.S. stocks ended little changed on Tuesday as Wall Street assessed another deluge of corporate earnings results and economic data. The major averages traded in a narrow range as investors braced for a flurry of profit tallies from tech-industry heavyweights and the Federal Reserve’s policy decision on Wednesday.
On the data front, the Conference Board’s gauge of consumer confidence climbed for the fourth straight month in April, surging past expectations to a new pandemic high of 121.7. Separately, S&P CoreLogic Case Shiller’s measure of national home prices jumped 12% year-over-year in February, the largest increase since 2006. Treasuries weakened, with the yield on the 10-year note up six basis points to 1.62%, rising for a third straight session. In commodities, WTI crude jumped 2.1% to $63.22/barrel, while copper extended gains to the highest level in 10 years.
Eight of 11 S&P 500 sectors finished in negative territory, with Energy, Financials and Industrials bucking the downtrend. In earnings, Tesla (TSLA -4.53%) fell as its record profit in the first quarter topped projections due to sale of bitcoin, regulatory credits and tax benefits. United Parcel Service (UPS +10.31%) gapped up for a record high after easily topping consensus forecasts. Eli Lilly (LLY -2.73%) fell following a reduction to its full-year guidance. UBS Group (UBS -1.04%) fell after disclosing a $774 million loss related to the Archegos Capital Management fallout. |
 Kenneth J. Gruneisen started out as a licensed stockbroker in August 1987, a couple of months prior to the historic stock market crash that took the Dow Jones Industrial Average down -22.6% in a single day. He has published daily fact-based fundamental and technical analysis on high-ranked stocks online for two decades. Through FACTBASEDINVESTING.COM, Kenneth provides educational articles, news, market commentary, and other information regarding proven investment systems that work in good times and bad.
Comments contained in the body of this report are technical opinions only and are not necessarily those of Gruneisen Growth Corp. The material herein has been obtained from sources believed to be reliable and accurate, however, its accuracy and completeness cannot be guaranteed. Our firm, employees, and customers may effect transactions, including transactions contrary to any recommendation herein, or have positions in the securities mentioned herein or options with respect thereto. Any recommendation contained in this report may not be suitable for all investors and it is not to be deemed an offer or solicitation on our part with respect to the purchase or sale of any securities. |
|
 |
Bank, Retail, and Integrated Oil Indexes Rose
Kenneth J. Gruneisen - Passed the CAN SLIM® Master's Exam
The Bank Index ($BKX +1.01%) and Retail Index ($RLX +0.35%) posted gains but the Broker/Dealer Index ($XBD -0.16%) ended slightly in the red. The tech sector had a negative bias as the Biotech Index ($BTK -0.88%), Semiconductor Index ($SOX -0.79%), and the Networking Index ($NWX -0.34%) each ended lower. The Gold & Silver Index ($XAU -1.94%) also fell. Energy-linked groups were mixed as the Oil Services Index ($OSX -0.73%) edged lower while the Integrated Oil Index ($XOI +1.55%) posted a solid gain.
PICTURED: The Retail Index ($RLX +0.35%) is perched near its record high.
| Oil Services |
$OSX |
50.90 |
-0.37 |
-0.73% |
+14.81% |
| Integrated Oil |
$XOI |
1,000.64 |
+15.31 |
+1.55% |
+26.27% |
| Semiconductor |
$SOX |
3,224.67 |
-25.59 |
-0.79% |
+15.35% |
| Networking |
$NWX |
808.65 |
-2.78 |
-0.34% |
+12.76% |
| Broker/Dealer |
$XBD |
460.41 |
-0.73 |
-0.16% |
+21.93% |
| Retail |
$RLX |
3,942.69 |
+13.80 |
+0.35% |
+10.65% |
| Gold & Silver |
$XAU |
146.04 |
-2.89 |
-1.94% |
+1.28% |
| Bank |
$BKX |
125.59 |
+1.25 |
+1.01% |
+28.27% |
| Biotech |
$BTK |
5,688.80 |
-50.22 |
-0.88% |
-0.88% |
|
|
|
 |
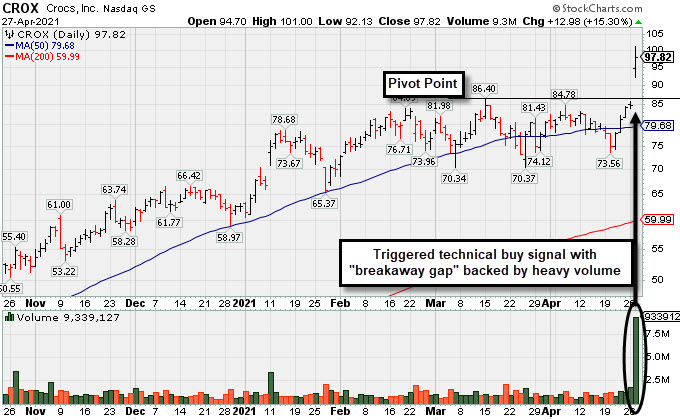
Powerful "Breakaway Gap" for CROX
Kenneth J. Gruneisen - Passed the CAN SLIM® Master's Exam
Crocs, Inc (CROX +$12.98 or +15.30% to $97.82) finished strong after highlighted in yellow in the earlier mid-day report (read here) with new pivot point cited based on its 3/15/21 high plus 10 cents. It hit new 52-week and all-time highs (N criteria) with today's big "breakaway gap" and 5th consecutive gain with increasing volume. The gain backed by +776% above average volume and strong close above the pivot point clinched a convincing new technical buy signal. A "breakaway gap" is the one noted exception to the fact-based investment system's rule of not chasing any stock more than 5% above the prior high. However, the risk increases of one being stopped out on an ordinary pullback of 7-8% whenever chasing any stock too far above any sound base pattern.
Bullish action came after it reported Mar '21 quarterly earnings +577% on +64% sales revenues versus the year ago period, its 3rd strong quarterly comparison after some negative comparisons. Annual earnings (A criteria) growth has been strong and steady following losses in FY '15 and '16. CROX has the highest possible Earnings Per Share Rating of 99.
The high-ranked Apparel - Shoes & Rel Mfg firm saw the number of top-rated funds owning its shares rise from 438 in Jun '20 to 575 in Mar '21, a reassuring sign of institutional buying demand (I criteria). Its current Up/Down Volume Ratio of 1.0 is an unbiased indication its shares have been neutral concerning accumulation/distribution over the past 50 days. Its Accumulation/Distribution Rating is C+ and Timeliness Rating is A, and its Sponsorship Rating is C. Its small supply of only 65.4 million shares outstanding can contribute to greater volatility in the event of institutional buying or selling.
|
|
|
Color Codes Explained :
Y - Better candidates highlighted by our
staff of experts.
G - Previously featured
in past reports as yellow but may no longer be buyable under the
guidelines.
***Last / Change / Volume data in this table is the closing quote data***
Symbol/Exchange
Company Name
Industry Group |
PRICE |
CHANGE
(%Change) |
Day High |
Volume
(% DAV)
(% 50 day avg vol) |
52 Wk Hi
% From Hi |
Featured
Date |
Price
Featured |
Pivot Featured |
|
Max Buy |
 SIVB
-
NASDAQ
SIVB
-
NASDAQ
S V B Financial Group
BANKING - Regional - Pacific Banks
|
$575.90
|
+2.97
0.52% |
$576.59
|
422,474
76.67% of 50 DAV
50 DAV is 551,000
|
$585.25
-1.60%
|
4/23/2021
|
$579.70
|
PP = $577.16
|
|
MB = $606.02
|
Most Recent Note - 4/23/2021 5:01:55 PM
Y - Posted a solid gain but did not close above the pivot point cited based on its 3/18/21 high plus 10 cents. Spiked to a new all-time high with today's volume-driven gain. Bullish action came after it reported earnings +293% on +64% sales revenues for the Mar '21 quarter versus the year ago period, its 3rd strong comparison. Completed a new Public Offering on 3/24/21. Went through a deep consolidation and made impressive progress since dropped from the Featured Stocks list on 10/23/18. See the latest FSU analysis for more details.
>>> FEATURED STOCK ARTICLE : Hit New High But Closed Below Pivot Point - 4/23/2021 |
View all notes |
Set NEW NOTE alert |
Company Profile |
SEC
News |
Chart |
Request a new note
C
A
S
I |
CROX
-
NASDAQ
Crocs Inc
CONSUMER NON-DURABLES - Textile - Apparel Footwear
|
$97.82
|
+12.98
15.30% |
$101.00
|
9,337,198
876.73% of 50 DAV
50 DAV is 1,065,000
|
$86.40
13.22%
|
4/27/2021
|
$99.81
|
PP = $86.50
|
|
MB = $90.83
|
 Most Recent Note - 4/27/2021 5:27:09 PM
Y - Finished strong today after highlighted in yellow with pivot point cited based on its 3/15/21 high plus 10 cents. Hit new 52-week and all-time highs with today's "breakaway gap" and 5th consecutive gain with increasing volume triggering a technical buy signal. Bullish action came after it reported Mar '21 quarterly earnings +577% on +64% sales revenues versus the year ago period, its 3rd strong quarterly comparison after some negative comparisons. Annual earnings (A criteria) growth has been strong and steady following losses in FY '15 and '16. See the latest FSU analysis for more details and a new annotated graph.
>>> FEATURED STOCK ARTICLE : Powerful "Breakaway Gap" for CROX - 4/27/2021 |
View all notes |
Set NEW NOTE alert |
Company Profile |
SEC
News |
Chart |
Request a new note
C
A
S
I |
CRL
-
NYSE
Charles River Labs Intl
DRUGS - Biotechnology
|
$334.37
|
-2.07
-0.62% |
$336.99
|
288,192
89.50% of 50 DAV
50 DAV is 322,000
|
$337.48
-0.92%
|
12/17/2020
|
$247.06
|
PP = $257.98
|
|
MB = $270.88
|
Most Recent Note - 4/26/2021 5:11:39 PM
G - Wedged to another new all-time high with today's 4th consecutive gain backed by lighter volume. Its 50 DMA line ($295) acted as support throughout its ongoing ascent. Its Relative Strength Rating is 84, above the 80+ minimum guideline for buy candidates. Dec '20 quarterly earnings rose +19% on +14% sales revenues versus the year ago period, below the +25% minimum earnings guideline (C criteria), raising fundamental concerns.
>>> FEATURED STOCK ARTICLE : Perched at Record High After Rally From 50-Day Moving Average - 4/9/2021 |
View all notes |
Set NEW NOTE alert |
Company Profile |
SEC
News |
Chart |
Request a new note
C
A
S
I |
BRKS
-
NASDAQ
Brooks Automation
ELECTRONICS - Semiconductor Equipment and Mate
|
$105.50
|
-1.22
-1.14% |
$108.72
|
677,429
93.18% of 50 DAV
50 DAV is 727,000
|
$107.35
-1.72%
|
4/5/2021
|
$99.31
|
PP = $91.88
|
|
MB = $96.47
|
Most Recent Note - 4/23/2021 5:04:03 PM
G - Posted a 3rd consecutive gain today with average volume for a best-ever close, getting extended from the prior base. Prior highs in the $91 area define initial support to watch above its 50 DMA line ($87.72).
>>> FEATURED STOCK ARTICLE : High Ranked Semiconductor Equipment Firm Powered Higher - 4/7/2021 |
View all notes |
Set NEW NOTE alert |
Company Profile |
SEC
News |
Chart |
Request a new note
C
A
S
I |
ENTG
-
NASDAQ
Entegris Inc
ELECTRONICS - Semiconductor Equipment and Mate
|
$114.78
|
-0.40
-0.35% |
$115.81
|
1,171,089
123.27% of 50 DAV
50 DAV is 950,000
|
$126.41
-9.20%
|
4/1/2021
|
$118.42
|
PP = $110.37
|
|
MB = $115.89
|
Most Recent Note - 4/27/2021 5:35:58 PM
Y - Recently found support while consolidating near the prior high in the $110 area which defines support to watch above its 50 DMA line ($108.73). More damaging losses would raise concerns and trigger technical sell signals.
>>> FEATURED STOCK ARTICLE : Negated Recent Breakout and Sputtering Near Prior High - 4/22/2021 |
View all notes |
Set NEW NOTE alert |
Company Profile |
SEC
News |
Chart |
Request a new note
C
A
S
I |
Symbol/Exchange
Company Name
Industry Group |
PRICE |
CHANGE
(%Change) |
Day High |
Volume
(% DAV)
(% 50 day avg vol) |
52 Wk Hi
% From Hi |
Featured
Date |
Price
Featured |
Pivot Featured |
|
Max Buy |
OPY
-
NYSE
Oppenheimer Holdings Inc
FINANCIAL SERVICES - Investment Brokerage - Regiona
|
$47.25
|
+0.29
0.62% |
$47.70
|
141,933
117.30% of 50 DAV
50 DAV is 121,000
|
$48.33
-2.23%
|
2/25/2021
|
$38.95
|
PP = $38.11
|
|
MB = $40.02
|
Most Recent Note - 4/23/2021 5:05:23 PM
G - Posted a big gain today with average volume for a new 52-week high. It is extended from any sound base. Its 50 DMA line ($41) and prior low define near-term support to watch on pullbacks.
>>> FEATURED STOCK ARTICLE : Negative Reversal After 7 Consecutive Gains - 4/20/2021 |
View all notes |
Set NEW NOTE alert |
Company Profile |
SEC
News |
Chart |
Request a new note
C
A
S
I |
LAD
-
NYSE
Lithia Motors Inc Cl A
SPECIALTY RETAIL - Auto Dealerships
|
$397.42
|
+10.23
2.64% |
$406.43
|
353,222
119.33% of 50 DAV
50 DAV is 296,000
|
$417.98
-4.92%
|
4/21/2021
|
$377.00
|
PP = $418.08
|
|
MB = $438.98
|
Most Recent Note - 4/27/2021 5:32:23 PM
Y - Posted a gain today with +19% above average volume. Stubbornly held its ground and wedged higher since highlighted in yellow in the 4/21/21 mid-day report with a pivot point cited based on its 3/17/21 high plus 10 cents. Subsequent gains above the pivot point backed by at least +40% above average volume may trigger a technical buy signal.
>>> FEATURED STOCK ARTICLE : Building a Base With Rebound Above 50-Day Moving Average - 4/21/2021 |
View all notes |
Set NEW NOTE alert |
Company Profile |
SEC
News |
Chart |
Request a new note
C
A
S
I |
CLFD
-
NASDAQ
Clearfield Inc
TELECOMMUNICATIONS - Cables / Satalite Equipment
|
$37.44
|
-2.61
-6.52% |
$40.00
|
283,507
192.86% of 50 DAV
50 DAV is 147,000
|
$40.26
-7.00%
|
4/26/2021
|
$39.68
|
PP = $38.85
|
|
MB = $40.79
|
Most Recent Note - 4/27/2021 5:28:42 PM
Y - Pulled back for a big loss today, retreating abruptly. Finished strong on the prior session after highlighted in yellow with new pivot point cited based on its 2/16/21 high plus 10 cents. The big gain for a new 52-week high and strong close above the pivot point backed by +273% above average volume clinched a convincing new technical buy signal. Rebounded above its 50 DMA line ($32.23) with a big gap up on the prior session. Bullish action came after it reported Mar '21 quarterly earnings +440% on +45% sales revenues versus the year ago period, continuing its strong earnings track record. Found support near prior highs in the $28 area since dropped from the Featured Stocks list on 3/29/21.
>>> FEATURED STOCK ARTICLE : Rallied Straight Up From Bottom of 10-Week Base - 4/26/2021 |
View all notes |
Set NEW NOTE alert |
Company Profile |
SEC
News |
Chart |
Request a new note
C
A
S
I |
EDUC
-
NASDAQ
Educational Development
WHOLESALE - Basic Materials Wholesale
|
$18.30
|
+1.00
5.78% |
$18.51
|
62,605
240.79% of 50 DAV
50 DAV is 26,000
|
$20.00
-8.50%
|
3/10/2021
|
$17.89
|
PP = $20.10
|
|
MB = $21.11
|
Most Recent Note - 4/27/2021 12:26:38 PM
Y - Tallying a big volume-driven gain today after 3 gains backed by light volume. Volume totals cooled while consolidating above its 50 DMA line ($17.14) which defines important near-term support. Met stubborn resistance in the $19-20 area. Subsequent gains above the pivot point backed by at least +40% above average volume are needed to trigger a proper technical buy signal.
>>> FEATURED STOCK ARTICLE : Finding Support During Consolidation Above 50-Day Moving Average - 4/16/2021 |
View all notes |
Set NEW NOTE alert |
Company Profile |
SEC
News |
Chart |
Request a new note
C
A
S
I |
SMPL
-
NASDAQ
Simply Good Foods Co
Food-Confectionery
|
$34.14
|
-0.18
-0.52% |
$34.43
|
298,116
41.75% of 50 DAV
50 DAV is 714,000
|
$35.25
-3.15%
|
12/28/2020
|
$30.40
|
PP = $31.44
|
|
MB = $33.01
|
Most Recent Note - 4/26/2021 5:21:36 PM
G - Posted a quiet gain today for its 2nd best ever close, still perched within close striking distance of its 52-week and all-time highs with volume totals cooling. Reported Feb '21 quarterly earnings +9% on +2% sales revenues versus the year ago period, below the +25% minimum earnings guideline (C criteria), raising fundamental concerns. Found prompt support near its 50 DMA line ($31.23) but its current Relative Strength Rating is 79, one notch below the 80+ minimum guideline for buy candidates.
>>> FEATURED STOCK ARTICLE : Perched Near High But Fundamental Concerns Were Raised - 4/14/2021 |
View all notes |
Set NEW NOTE alert |
Company Profile |
SEC
News |
Chart |
Request a new note
C
A
S
I |
Symbol/Exchange
Company Name
Industry Group |
PRICE |
CHANGE
(%Change) |
Day High |
Volume
(% DAV)
(% 50 day avg vol) |
52 Wk Hi
% From Hi |
Featured
Date |
Price
Featured |
Pivot Featured |
|
Max Buy |
IBP
-
NYSE
Installed Building Prod
DIVERSIFIED SERVICES - Business/Management Services
|
$133.00
|
+0.58
0.44% |
$135.63
|
114,707
51.21% of 50 DAV
50 DAV is 224,000
|
$134.16
-0.86%
|
4/19/2021
|
$131.15
|
PP = $130.21
|
|
MB = $136.72
|
Most Recent Note - 4/23/2021 12:41:11 PM
Y - Hovering near its all-time high with today's volume-driven gain. A gain and strong close above its pivot point may help clinch a convincing technical buy signal. Reported earnings +34% on +10% sales revenues for the Dec '20 quarter versus the year-ago period. Three of the past 4 consecutive quarterly comparisons were above the +25% minimum earnings guideline (C criteria). Annual earnings (A criteria) history has been strong.
>>> FEATURED STOCK ARTICLE : Steady Streak of Gains Into New High Territory - 4/19/2021 |
View all notes |
Set NEW NOTE alert |
Company Profile |
SEC
News |
Chart |
Request a new note
C
A
S
I |
QRVO
-
NASDAQ
Qorvo Inc
ELECTRONICS - Semiconductor - Integrated Cir
|
$198.38
|
-0.59
-0.30% |
$201.50
|
597,236
51.18% of 50 DAV
50 DAV is 1,167,000
|
$199.94
-0.78%
|
4/1/2021
|
$190.48
|
PP = $191.92
|
|
MB = $201.52
|
Most Recent Note - 4/23/2021 5:08:25 PM
Y - Posted a big gain today with light volume, rising from its 50 DMA line ($180.55). That important short-term average acted as support when it stalled after recently wedging up to new highs from a 9-week base. Its Relative Strength Rating has slumped to 77, below the 80+ minimum for buy candidates.
>>> FEATURED STOCK ARTICLE : Hit Another New High With Even Less Volume Conviction - 4/5/2021 |
View all notes |
Set NEW NOTE alert |
Company Profile |
SEC
News |
Chart |
Request a new note
C
A
S
I |
YETI
-
NYSE
Yeti Holdings Inc
Leisure-Products
|
$88.34
|
+0.35
0.40% |
$89.60
|
816,696
59.27% of 50 DAV
50 DAV is 1,378,000
|
$89.70
-1.52%
|
4/6/2021
|
$76.95
|
PP = $79.42
|
|
MB = $83.39
|
Most Recent Note - 4/27/2021 5:34:08 PM
G - Perched at its all-time high, extended from the latest base, it posted a 3rd consecutive gain today with lighter volume. Prior highs in the $80 area define initial support to watch on pullbacks.
>>> FEATURED STOCK ARTICLE : YETI Perched Within Striking Distance of High - 4/7/2021 |
View all notes |
Set NEW NOTE alert |
Company Profile |
SEC
News |
Chart |
Request a new note
C
A
S
I |
DT
-
NYSE
Dynatrace Inc
Computer Sftwr-Enterprse
|
$54.81
|
+0.38
0.70% |
$54.98
|
1,023,856
49.47% of 50 DAV
50 DAV is 2,069,700
|
$56.94
-3.74%
|
4/26/2021
|
$54.43
|
PP = $57.04
|
|
MB = $59.89
|
Most Recent Note - 4/26/2021 5:17:34 PM
Y - Today it posted a 4th consecutive gain on below average volume, rebounding above its 50 DMA line toward its 52-week high. Color code is changed to yellow with new pivot point cited based on its 3/16/21 high plus 10 cents. Subsequent gains above the pivot point backed by at least +40% above average volume may trigger a new (or add-on) technical buy signal. Recent lows in the $45 area define important near-term support to watch on pullbacks. Its Relative Strength Rating is 72, below the 80+ minimum guideline for buy candidates, however it is perched only -4.4% off its all-time high. Fundamentals remain strong after it reported Dec '20 earnings +70% on +28% sales revenues versus the year ago period.
>>> FEATURED STOCK ARTICLE : Gap Up Rebounding Further Above 50-Day Moving Average - 4/8/2021 |
View all notes |
Set NEW NOTE alert |
Company Profile |
SEC
News |
Chart |
Request a new note
C
A
S
I |
MRBK
-
NASDAQ
Meridian Corp
Banks-Northeast
|
$26.32
|
+1.58
6.39% |
$26.78
|
52,310
141.38% of 50 DAV
50 DAV is 37,000
|
$27.96
-5.87%
|
2/22/2021
|
$25.58
|
PP = $26.10
|
|
MB = $27.41
|
Most Recent Note - 4/27/2021 12:54:01 PM
Y - Color code is changed to yellow while rebounding above its 50 DMA line ($25.63). Reported Mar '21 earnings +323% on +93% sales revenues versus the year ago period, continuing its strong earnings track record. Recent low ($24.01 on 4/21/21) defines important near-term support where any violation may trigger a worrisome technical sell signal. Its Relative Strength Rating is 79, just below the 80+ minimum guideline.
>>> FEATURED STOCK ARTICLE : Encountering Distributional Pressure - 4/12/2021 |
View all notes |
Set NEW NOTE alert |
Company Profile |
SEC
News |
Chart |
Request a new note
C
A
S
I |
Symbol/Exchange
Company Name
Industry Group |
PRICE |
CHANGE
(%Change) |
Day High |
Volume
(% DAV)
(% 50 day avg vol) |
52 Wk Hi
% From Hi |
Featured
Date |
Price
Featured |
Pivot Featured |
|
Max Buy |
|
|
|
THESE ARE NOT BUY RECOMMENDATIONS!
Comments contained in the body of this report are technical
opinions only. The material herein has been obtained
from sources believed to be reliable and accurate, however,
its accuracy and completeness cannot be guaranteed.
This site is not an investment advisor, hence it does
not endorse or recommend any securities or other investments.
Any recommendation contained in this report may not
be suitable for all investors and it is not to be deemed
an offer or solicitation on our part with respect to
the purchase or sale of any securities. All trademarks,
service marks and trade names appearing in this report
are the property of their respective owners, and are
likewise used for identification purposes only.
This report is a service available
only to active Paid Premium Members.
You may opt-out of receiving report notifications
at any time. Questions or comments may be submitted
by writing to Premium Membership Services 665 S.E. 10 Street, Suite 201 Deerfield Beach, FL 33441-5634 or by calling 1-800-965-8307
or 954-785-1121.
|
|
|