You are not logged in.
This means you
CAN ONLY VIEW reports that were published prior to Thursday, April 10, 2025.
You
MUST UPGRADE YOUR MEMBERSHIP if you want to see any current reports.
AFTER MARKET UPDATE - FRIDAY, MARCH 3RD, 2023
Previous After Market Report Next After Market Report >>>
|
|
|
|
DOW |
+387.40 |
33,390.97 |
+1.17% |
|
Volume |
890,307,989 |
-4% |
|
Volume |
5,037,995,700 |
-6% |
|
NASDAQ |
+226.02 |
11,689.01 |
+1.97% |
|
Advancers |
2,382 |
81% |
|
Advancers |
3,141 |
70% |
|
S&P 500 |
+64.29 |
4,045.64 |
+1.61% |
|
Decliners |
562 |
19% |
|
Decliners |
1,339 |
30% |
|
Russell 2000 |
+25.60 |
1,928.26 |
+1.35% |
|
52 Wk Highs |
124 |
|
|
52 Wk Highs |
100 |
|
|
S&P 600 |
+14.35 |
1,269.75 |
+1.14% |
|
52 Wk Lows |
18 |
|
|
52 Wk Lows |
66 |
|
|
 |
Leadership Improved as Indices Rose With Lighter Volume Totals
Kenneth J. Gruneisen - Passed the CAN SLIM® Master's Exam
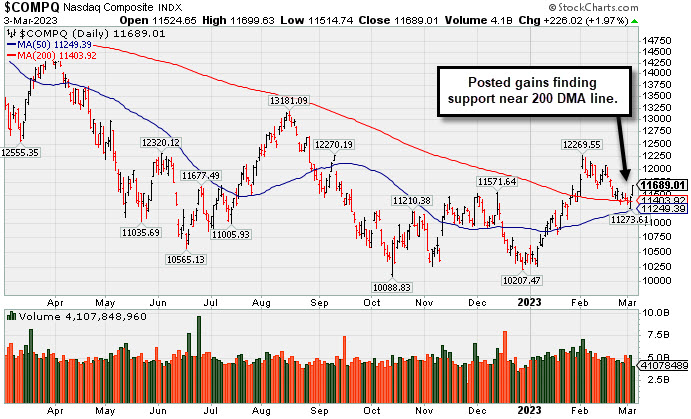
The Dow added 387 points, while the Nasdaq Composite increased 2%. The S&P 500 gained 1.6% with all eleven sectors finishing in positive territory. All three major averages notched weekly gains with the Dow up 1.8%, the NASDAQ up 2.6%, and the S&P 500 up 1.9%. Volume totals were lighter than the prior session on the NYSE and on the Nasdaq exchange, revealing lackluster buying demand from the institutional crowd. Breadth was positive as advancers led decliners by a 4-1 margin on the NYSE and by more than 2-1 on the Nasdaq exchange. Leadership improved as there were 54 high-ranked companies from the Leaders List that hit new 52-week highs and were listed on the BreakOuts Page, versus 29 on the prior session. New 52-week highs outnumbered new 52-week lows on the NYSE and on the Nasdaq exchange. The major indices are in an uptrend under pressure (M criteria). For any rally to be sustained there must be healthy leadership. It will be important to watch for further improvement in the new highs totals in the immediate days ahead. Stay tuned!
PICTURED: The Nasdaq Composite Index posted a quiet gain Friday and found support this week near its 200-day moving average (DMA) line.
U.S. equities finished the week on a high note as markets closed higher Friday following a better-than-expected reading on February’s U.S. services data. The closely watched metric signaled a resilient economy as the reading remains in expansionary territory against inflation and high interest rates.
On the data front, February’s finalized S&P Global US Services and Composite Purchasing Managers’ Index (PMI) readings remained relatively unchanged at 50.6 and 50.1. Meanwhile, February’s Institute of Supply Management (ISM) Services Index topped estimates by 0.6, coming in at 55.1, staying in expansionary territory. In corporate news, Costco Wholesale Corporation (COST -2.15%) reported it missed analyst’s revenue estimates for the company’s fiscal second quarter. Meanwhile, Dell Technologies Inc. (DELL -0.96%) sputtered after it topped Wall Street’s revenue and earnings estimates.
Treasuries strengthened, with the yield on the benchmark 10-year note decreasing ten basis points (0.10%) to 3.96% while the 30-year bond yield lost thirteen basis points (0.13%) to 4.87%. The yield on the two-year note declined two basis points (0.02%) to 4.86%. In commodities, West Texas Intermediate (WTI) crude increased 2% to $79.74/barrel as it recovered from false rumors over the United Arab Emirates potentially leaving the Organization of Petroleum Exporting Countries (OPEC). In the metals complex, gold closed the week 2.9% higher for its first weekly gain after four-consecutive weeks of decline.
|
 Kenneth J. Gruneisen started out as a licensed stockbroker in August 1987, a couple of months prior to the historic stock market crash that took the Dow Jones Industrial Average down -22.6% in a single day. He has published daily fact-based fundamental and technical analysis on high-ranked stocks online for two decades. Through FACTBASEDINVESTING.COM, Kenneth provides educational articles, news, market commentary, and other information regarding proven investment systems that work in good times and bad.
Comments contained in the body of this report are technical opinions only and are not necessarily those of Gruneisen Growth Corp. The material herein has been obtained from sources believed to be reliable and accurate, however, its accuracy and completeness cannot be guaranteed. Our firm, employees, and customers may effect transactions, including transactions contrary to any recommendation herein, or have positions in the securities mentioned herein or options with respect thereto. Any recommendation contained in this report may not be suitable for all investors and it is not to be deemed an offer or solicitation on our part with respect to the purchase or sale of any securities. |
|
 |
Retail, Financial, Tech and Commodity-Linked Groups Rose
Kenneth J. Gruneisen - Passed the CAN SLIM® Master's Exam
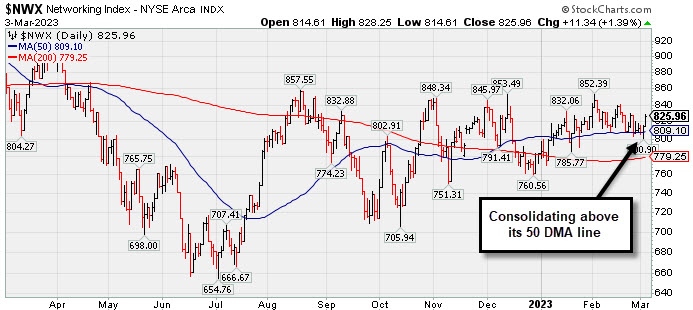
The Retail Index ($RLX +2.10%), Broker/Dealer Index ($XBD +1.77%), and Bank Index ($BKX +1.92%) posted influential gains underpinning the major averages' advance. The tech sector had a positive bias as the Semiconductor Index ($SOX +1.48%), Networking Index ($NWX +1.39%), and Biotech Index ($BTK +1.52%) each notched gains. Commodity-linked groups also rose as the Oil Services Index ($OSX +1.30%), Integrated Oil Index ($XOI +1.23%), and finished unanimously higher.
PICTURED: The Networking Index ($NWX +1.39%) recently slumped below its 50-day moving average (DMA) line.
| Oil Services |
$OSX |
92.31 |
+1.19 |
+1.30% |
+10.08% |
| Integrated Oil |
$XOI |
1,822.01 |
+22.17 |
+1.23% |
+1.95% |
| Semiconductor |
$SOX |
3,028.34 |
+44.22 |
+1.48% |
+19.60% |
| Networking |
$NWX |
825.96 |
+11.34 |
+1.39% |
+5.44% |
| Broker/Dealer |
$XBD |
498.61 |
+8.65 |
+1.77% |
+11.02% |
| Retail |
$RLX |
2,894.11 |
+59.47 |
+2.10% |
+5.19% |
| Gold & Silver |
$XAU |
118.90 |
+1.95 |
+1.67% |
-1.62% |
| Bank |
$BKX |
109.44 |
+2.06 |
+1.92% |
+8.52% |
| Biotech |
$BTK |
5,408.26 |
+81.19 |
+1.52% |
+2.41% |
|
|
|
 |
Rose Near 50-Day Moving Average Which May Act as Resistance
Kenneth J. Gruneisen - Passed the CAN SLIM® Master's Exam
Griffon Corporation (GFF+$0.40 or +1.06% to $38.01) posted a 2nd gain with lighter volume. A rebound above the 50-day moving average (DMA) line ($38.24) is needed for its outlook to improve. It violated its 50 DMA line with a damaging volume-driven loss triggering a technical sell signal on 2/21/23. More damaging losses below the recent low ($35.82 on 3/02/23) would raise greater concerns.
Fundamentals remain strong after it reported Dec '22 quarterly earnings +121% on +10% sales revenues versus the year ago period, continuing its strong earniongs track record. It has a 99 Earnings Per Share Rating. Annual earnings (A criteria) growth has been strong and steady.
The company has only 57.2 million shares outstanding (S criteria) which can contribute to greater volatility in the event of institutional buying or selling. The number of top-dated funds owning its shares rose from 331 in Mar '22 to 383 in Dec '22. Its current Up/Down Volume Ratio of 1.4 is an unbiased indication its shares have been under accumulation over the past 50 days. It has an A Timeliness rating and an A Sponsorship Rating.
|
|
|
Color Codes Explained :
Y - Better candidates highlighted by our
staff of experts.
G - Previously featured
in past reports as yellow but may no longer be buyable under the
guidelines.
***Last / Change / Volume data in this table is the closing quote data***
Symbol/Exchange
Company Name
Industry Group |
PRICE |
CHANGE
(%Change) |
Day High |
Volume
(% DAV)
(% 50 day avg vol) |
52 Wk Hi
% From Hi |
Featured
Date |
Price
Featured |
Pivot Featured |
|
Max Buy |
 CMC
-
NYSE
CMC
-
NYSE
Commercial Metals Co
METALS and MINING - Steel and Iron
|
$54.29
|
+1.73
3.29% |
$54.56
|
1,567,389
146.08% of 50 DAV
50 DAV is 1,073,000
|
$58.09
-6.54%
|
10/14/2022
|
$41.61
|
PP = $44.45
|
|
MB = $46.67
|
 Most Recent Note - 3/3/2023 5:44:12 PM
Y - Color code is changed to yellow after rebounding above its 50 DMA line ($53.15) with today's 3rd consecutive volume-driven gain helping its outlook improve. The recent low ($50.90 on 2/24/23) defines important near term support where any more damaging losses would raise greater concerns. Fundamentals remain strong.
>>> FEATURED STOCK ARTICLE : Metals Firm Extended From Base and Perched Near High - 2/6/2023 |
View all notes |
Set NEW NOTE alert |
Company Profile |
SEC
News |
Chart |
Request a new note
C
A
S
I |
GPK
-
NYSE
Graphic Packaging Hldg
CONSUMER NON-DURABLES - Packaging and Containers
|
$24.58
|
+0.15
0.61% |
$24.73
|
2,945,525
91.28% of 50 DAV
50 DAV is 3,227,000
|
$24.47
0.45%
|
10/25/2022
|
$22.75
|
PP = $24.17
|
|
MB = $25.38
|
Most Recent Note - 3/1/2023 1:36:48 PM
Y - Inching higher today for a 5th consecutive small gain, wedging into new all-time high territory with gains lacking great volume conviction. Showed resilience after briefly violating its 50 DMA line on 2/07/23. Members were reminded - "Disciplined investors know that gains above a stock's pivot point must be backed by at least +40% above average volume to trigger a proper technical buy signal."
>>> FEATURED STOCK ARTICLE : Quietly Lingering Near High With Strong Fundamentals - 2/27/2023 |
View all notes |
Set NEW NOTE alert |
Company Profile |
SEC
News |
Chart |
Request a new note
C
A
S
I |
GFF
-
NYSE
Griffon Corporation
MATERIALS and CONSTRUCTION - General Building Materials
|
$38.01
|
+0.40
1.06% |
$38.32
|
436,616
89.29% of 50 DAV
50 DAV is 489,000
|
$43.74
-13.10%
|
11/10/2022
|
$34.13
|
PP = $35.02
|
|
MB = $36.77
|
Most Recent Note - 3/3/2023 5:49:59 PM
G - Posted a 2nd consecutive gain with lighter volume. A rebound above the 50 DMA line ($38.24) is needed for its outlook to improve. More damaging losses below the recent low ($35.62 on 3/02/23) would raise greater concerns. See the latest FSU analysis for more details and a new annotated graph.
>>> FEATURED STOCK ARTICLE : Rose Near 50-Day Moving Average Which May Act as Resistance - 3/3/2023 |
View all notes |
Set NEW NOTE alert |
Company Profile |
SEC
News |
Chart |
Request a new note
C
A
S
I |
TITN
-
NASDAQ
Titan Machinery Inc
SPECIALTY RETAIL
|
$47.17
|
+0.68
1.46% |
$47.45
|
235,911
110.76% of 50 DAV
50 DAV is 213,000
|
$47.79
-1.30%
|
1/13/2023
|
$40.10
|
PP = $44.45
|
|
MB = $46.67
|
Most Recent Note - 3/3/2023 5:54:50 PM
G - Color code is changed to green after posting a 3rd consecutive gain rising above its "max buy" level for a best-ever close near its all-time high. Its 50 DMA line ($42.63) definies important near-term support to watch on pullbacks.
>>> FEATURED STOCK ARTICLE : Pulled Back from New All-Time High - 2/28/2023 |
View all notes |
Set NEW NOTE alert |
Company Profile |
SEC
News |
Chart |
Request a new note
C
A
S
I |
MYE
-
NYSE
Myers Industries Inc
Containers/Packaging
|
$21.25
|
+0.52
2.51% |
$21.57
|
360,232
239.04% of 50 DAV
50 DAV is 150,700
|
$26.49
-19.78%
|
12/8/2022
|
$23.94
|
PP = $25.65
|
|
MB = $26.93
|
Most Recent Note - 3/2/2023 6:48:40 PM
G - Suffered a 2nd consecutive damaging volume-driven loss triggering technical sell signals. Bearish action came after it reported Dec '22 quarterly earnings +39% on +7% sales revenues versus the year ago period. Volume and volatility often increase near earnings news. Abruptly retreating after 4 consecutive gains reaching new 52-week and all-time highs. See the latest FSU analysis for more details and a new annotated graph.
>>> FEATURED STOCK ARTICLE : Damaging Losses Triggered Technical Sell Signals - 3/2/2023 |
View all notes |
Set NEW NOTE alert |
Company Profile |
SEC
News |
Chart |
Request a new note
C
A
S
I |
Symbol/Exchange
Company Name
Industry Group |
PRICE |
CHANGE
(%Change) |
Day High |
Volume
(% DAV)
(% 50 day avg vol) |
52 Wk Hi
% From Hi |
Featured
Date |
Price
Featured |
Pivot Featured |
|
Max Buy |
BOX
-
NYSE
Box Inc Cl A
Computer Sftwr-Database
|
$28.53
|
-0.71
-2.43% |
$29.53
|
2,790,505
201.05% of 50 DAV
50 DAV is 1,388,000
|
$34.98
-18.44%
|
2/2/2023
|
$34.68
|
PP = $33.14
|
|
MB = $34.80
|
Most Recent Note - 3/3/2023 5:42:21 PM
Fell further today testing its 200 DMA line ($28.54) after a gap down on the prior session violating its 50 DMA line and undercutting prior highs in the $32 area triggering a technical sell signal. Weak action came after it reported Dec '22 quarterly earnings +54% on +10% sales revenues versus the year ago period. Volume and volatility often increase near earnings news. A rebound above the 50 DMA line is needed for its outlook to improve. It will be dropped from the Featured Stocks list tonight.
>>> FEATURED STOCK ARTICLE : Perched Near High After Recent Breakout - 2/7/2023 |
View all notes |
Set NEW NOTE alert |
Company Profile |
SEC
News |
Chart |
Request a new note
C
A
S
I |
STRL
-
NASDAQ
Sterling Infrastructure
MATERIALS and; CONSTRUCTION - Heavy Construction
|
$40.72
|
-0.15
-0.37% |
$41.30
|
370,624
137.78% of 50 DAV
50 DAV is 269,000
|
$41.31
-1.43%
|
12/14/2022
|
$32.41
|
PP = $33.72
|
|
MB = $35.41
|
Most Recent Note - 3/1/2023 1:34:47 PM
G - Perched at its all-time high today while on track for a 6th consecutive gain, extended from the previously noted base. Prior highs in the $34-33 area and its 50 DMA line ($34.54) define important near-term support to watch.
>>> FEATURED STOCK ARTICLE : Sterling Perched Near High, Extended From Prior Base - 2/24/2023 |
View all notes |
Set NEW NOTE alert |
Company Profile |
SEC
News |
Chart |
Request a new note
C
A
S
I |
PERI
-
NASDAQ
Perion Networks Ltd
Comml Svcs-Advertising
|
$34.78
|
+0.50
1.46% |
$34.84
|
600,992
88.25% of 50 DAV
50 DAV is 681,000
|
$35.16
-1.08%
|
1/25/2023
|
$31.79
|
PP = $33.19
|
|
MB = $34.85
|
Most Recent Note - 3/3/2023 5:52:39 PM
Y - Posted a gain with light volume today for a best-ever close challenging its "max buy" level and 52-week high. Stubbornly held ground and showed resilience. Important suppport to watch is its 50 DMA line ($30.68) and recent low ($29.83 on 2/08/23).
>>> FEATURED STOCK ARTICLE : Perion Stubbornly Holding Ground Near High After Spurt of Gains - 2/22/2023 |
View all notes |
Set NEW NOTE alert |
Company Profile |
SEC
News |
Chart |
Request a new note
C
A
S
I |
ALGM
-
NASDAQ
Allegro Microsystems Inc
Elec-Semiconductor Mfg
|
$45.40
|
+1.22
2.76% |
$45.67
|
1,460,246
102.98% of 50 DAV
50 DAV is 1,418,000
|
$45.99
-1.28%
|
1/31/2023
|
$37.80
|
PP = $38.38
|
|
MB = $40.30
|
Most Recent Note - 3/1/2023 4:45:45 PM
G - Stubbornly holding its ground with volume totals cooling after getting extended from the previously noted base. Prior high in the $38 area defines initial support to watch on pullbacks. See the latest FSU analysis for more details and a new annotated graph.
>>> FEATURED STOCK ARTICLE : Holding its Ground After Rallying From Previously Noted Base - 3/1/2023 |
View all notes |
Set NEW NOTE alert |
Company Profile |
SEC
News |
Chart |
Request a new note
C
A
S
I |
WCC
-
NYSE
Wesco International Inc
WHOLESALE - Electronics Wholesale
|
$172.69
|
+2.57
1.51% |
$173.00
|
387,003
84.68% of 50 DAV
50 DAV is 457,000
|
$172.91
-0.13%
|
2/10/2023
|
$148.50
|
PP = $147.15
|
|
MB = $154.51
|
Most Recent Note - 3/3/2023 5:55:59 PM
G - Posted a 3rd consecutive gain with below average volume and hit a new all-time high, getting more extended from the previously noted base. Prior highs in the $144-147 area define initial support to watch above its 50 DMA line ($144.88). Reported Dec '22 quarterly earnings +40% on +15% sales revenues versus the year ago period.
>>> FEATURED STOCK ARTICLE : Powered Higher After Recently Highlighted in Feb 10th Report - 2/21/2023 |
View all notes |
Set NEW NOTE alert |
Company Profile |
SEC
News |
Chart |
Request a new note
C
A
S
I |
Symbol/Exchange
Company Name
Industry Group |
PRICE |
CHANGE
(%Change) |
Day High |
Volume
(% DAV)
(% 50 day avg vol) |
52 Wk Hi
% From Hi |
Featured
Date |
Price
Featured |
Pivot Featured |
|
Max Buy |
FIX
-
NYSE
Comfort Systems U S A
MATERIALS and CONSTRUCTION - General Contractors
|
$151.04
|
+3.84
2.61% |
$152.13
|
236,271
108.88% of 50 DAV
50 DAV is 217,000
|
$148.89
1.44%
|
2/23/2023
|
$136.52
|
PP = $128.78
|
|
MB = $135.22
|
Most Recent Note - 3/3/2023 5:45:34 PM
G - Hit yet another new high with today's gain adding to an impressive spurt higher, getting more extended from the previously noted base. Prior highs in the $128 area define initial support to watch on pullbacks.
>>> FEATURED STOCK ARTICLE : Powerful Technical Breakout After Earnings Report - 2/23/2023 |
View all notes |
Set NEW NOTE alert |
Company Profile |
SEC
News |
Chart |
Request a new note
C
A
S
I |
|
|
|
THESE ARE NOT BUY RECOMMENDATIONS!
Comments contained in the body of this report are technical
opinions only. The material herein has been obtained
from sources believed to be reliable and accurate, however,
its accuracy and completeness cannot be guaranteed.
This site is not an investment advisor, hence it does
not endorse or recommend any securities or other investments.
Any recommendation contained in this report may not
be suitable for all investors and it is not to be deemed
an offer or solicitation on our part with respect to
the purchase or sale of any securities. All trademarks,
service marks and trade names appearing in this report
are the property of their respective owners, and are
likewise used for identification purposes only.
This report is a service available
only to active Paid Premium Members.
You may opt-out of receiving report notifications
at any time. Questions or comments may be submitted
by writing to Premium Membership Services 665 S.E. 10 Street, Suite 201 Deerfield Beach, FL 33441-5634 or by calling 1-800-965-8307
or 954-785-1121.
|
|
|