You are not logged in.
This means you
CAN ONLY VIEW reports that were published prior to Wednesday, April 9, 2025.
You
MUST UPGRADE YOUR MEMBERSHIP if you want to see any current reports.
AFTER MARKET UPDATE - THURSDAY, FEBRUARY 9TH, 2023
Previous After Market Report Next After Market Report >>>
|
|
|
|
DOW |
-249.13 |
33,699.88 |
-0.73% |
|
Volume |
894,064,680 |
+10% |
|
Volume |
5,489,674,700 |
+9% |
|
NASDAQ |
-120.94 |
11,789.58 |
-1.02% |
|
Advancers |
741 |
25% |
|
Advancers |
1,397 |
31% |
|
S&P 500 |
-36.36 |
4,081.50 |
-0.88% |
|
Decliners |
2,215 |
75% |
|
Decliners |
3,133 |
69% |
|
Russell 2000 |
-27.26 |
1,915.34 |
-1.40% |
|
52 Wk Highs |
87 |
|
|
52 Wk Highs |
93 |
|
|
S&P 600 |
-16.63 |
1,262.43 |
-1.30% |
|
52 Wk Lows |
10 |
|
|
52 Wk Lows |
67 |
|
|
 |
Major Indices Fell With an Increase in Volume Totals
Kenneth J. Gruneisen - Passed the CAN SLIM® Master's Exam
The Dow shed 249 points, while the Nasdaq Composite slid 1%. The S&P 500 lost 0.9% with all sectors finishing in negative territory.Volume totals were higher than the prior session on the NYSE and on the Nasdaq exchange, hinting that the weakness was due to an increase institutional selling pressure. Breadth was positive as advancers led decliners by 3-1 margin on the NYSE and more than 2-1 on the Nasdaq exchange. Leadership improved as there were 37 high-ranked companies from the Leaders List that hit new 52-week highs and were listed on the BreakOuts Page versus the total of 20 on the prior session. New 52-week highs totals outnumbered new 52-week lows totals on both the NYSE and the Nasdaq exchange. The major indices are in a confirmed uptrend (M criteria). Disciplined investors have a green light for making new buys only in stocks matching all key criteria of the fact-based investment system.
PICTURED: The S&P 500 Index pulled back for a 4th loss in the span of 5 sessions. It has recently been consolidating above its 50-day moving average line. Its 50-day moving average (DMA) line (blue line) recently converged and crosed above its 200 DMA line (red line), a bullish technical signal termed a "golden cross".
U.S. equities reversed earlier gains to close lower Thursday as investors remained concerned regarding the Federal Reserve’s (Fed) future monetary policy, offsetting the latest batch of better-than-expected corporate earnings. Roughly 70% of S&P 500 companies have reported earnings thus far and Wall Street announced it feels the results have been lackluster with the current beat rate below its three-year average of 79%.
On the data front, initial jobless claims for the week ended February 4 came in slightly higher than expected at 196,000 but remain at a historically low level despite recent company layoffs. In earnings news, Sonos Inc. reported a better-than-expected holiday quarter, driven by consumer demand. Mattel Inc. (MAT -10.68%) announced a drop of 22% in overall revenue as consumer demand weakened in the fourth quarter. Kellogg Co. (K -0.10%) saw a 12% jump in its fourth quarter sales.
Treasuries weakened as the yield curve saw the most inversion since 1981. The yield on the benchmark 10-year note added five basis points (0.05%) to 3.67%, while the 30-year bond yield increased five basis points (0.05%) to 3.73%. The yield on the policy sensitive two-year note gained six basis points (0.06%) to 4.49%. In commodities, West Texas Intermediate (WTI) crude declined 1% to $77.67/barrel amid U.S. crude inventories surging to their highest level since June 2021. Meanwhile, Turkey’s Ceyhan port in the Mediterranean has resumed its operations after being temporarily suspended due to the earthquake. |
 Kenneth J. Gruneisen started out as a licensed stockbroker in August 1987, a couple of months prior to the historic stock market crash that took the Dow Jones Industrial Average down -22.6% in a single day. He has published daily fact-based fundamental and technical analysis on high-ranked stocks online for two decades. Through FACTBASEDINVESTING.COM, Kenneth provides educational articles, news, market commentary, and other information regarding proven investment systems that work in good times and bad.
Comments contained in the body of this report are technical opinions only and are not necessarily those of Gruneisen Growth Corp. The material herein has been obtained from sources believed to be reliable and accurate, however, its accuracy and completeness cannot be guaranteed. Our firm, employees, and customers may effect transactions, including transactions contrary to any recommendation herein, or have positions in the securities mentioned herein or options with respect thereto. Any recommendation contained in this report may not be suitable for all investors and it is not to be deemed an offer or solicitation on our part with respect to the purchase or sale of any securities. |
|
 |
Commodity-Linked Groups Led Financial and Retail Indexes Lower
Kenneth J. Gruneisen - Passed the CAN SLIM® Master's Exam
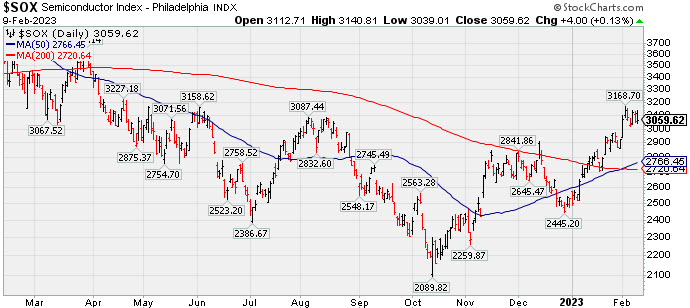
The Retail Index ($RLX -1.13%), Broker/Dealer Index ($XBD -1.45%), Bank Index ($BKX -1.50%) each lost ground and weighed on the major averages n Thursday. The Semiconductor Index ($SOX +0.13%) eked out a tiny gain but the Biotech Index ($BTK -0.73%) and Networking Index ($NWX -0.48%) both lost ground. The Gold & Silver Index ($XAU -2.00%), Oil Services Index ($OSX -3.09%), and Integrated Oil Index ($XOI -0.83%) ended unanimously lower.
PICTURED: The Semiconductor Index ($SOX +0.13%) recently roe above its August high. Its 50-day moving average (DMA) line recently rose above its 200 DMA line.
| Oil Services |
$OSX |
89.99 |
-2.87 |
-3.09% |
+7.31% |
| Integrated Oil |
$XOI |
1,793.93 |
-15.01 |
-0.83% |
+0.37% |
| Semiconductor |
$SOX |
3,059.62 |
+4.00 |
+0.13% |
+20.83% |
| Networking |
$NWX |
816.37 |
-3.91 |
-0.48% |
+4.22% |
| Broker/Dealer |
$XBD |
493.12 |
-7.26 |
-1.45% |
+9.79% |
| Retail |
$RLX |
2,998.68 |
-34.36 |
-1.13% |
+8.88% |
| Gold & Silver |
$XAU |
124.13 |
-2.53 |
-2.00% |
+2.71% |
| Bank |
$BKX |
112.55 |
-1.72 |
-1.50% |
+11.60% |
| Biotech |
$BTK |
5,483.64 |
-40.08 |
-0.73% |
+3.84% |
|
|
|
 |
Featured Stocks
Kenneth J. Gruneisen - Passed the CAN SLIM® Master's Exam
|
|
|
Color Codes Explained :
Y - Better candidates highlighted by our
staff of experts.
G - Previously featured
in past reports as yellow but may no longer be buyable under the
guidelines.
***Last / Change / Volume data in this table is the closing quote data***
Symbol/Exchange
Company Name
Industry Group |
PRICE |
CHANGE
(%Change) |
Day High |
Volume
(% DAV)
(% 50 day avg vol) |
52 Wk Hi
% From Hi |
Featured
Date |
Price
Featured |
Pivot Featured |
|
Max Buy |
 CMC
-
NYSE
CMC
-
NYSE
Commercial Metals Co
METALS and MINING - Steel and Iron
|
$54.99
|
-1.26
-2.24% |
$57.01
|
756,403
69.71% of 50 DAV
50 DAV is 1,085,000
|
$58.09
-5.34%
|
10/14/2022
|
$41.61
|
PP = $44.45
|
|
MB = $46.67
|
 Most Recent Note - 2/9/2023 4:56:37 PM
G - Pulled back today for a 2nd consecutive loss with lighter than average volume. It is extended from any sound base. Its 50 DMA line ($51.40) defines important near-term support to watch on pullbacks. Fundamentals remain strong.
>>> FEATURED STOCK ARTICLE : Metals Firm Extended From Base and Perched Near High - 2/6/2023 |
View all notes |
Set NEW NOTE alert |
Company Profile |
SEC
News |
Chart |
Request a new note
C
A
S
I |
GPK
-
NYSE
Graphic Packaging Hldg
CONSUMER NON-DURABLES - Packaging and Containers
|
$23.20
|
+0.07
0.30% |
$23.56
|
3,557,392
108.91% of 50 DAV
50 DAV is 3,266,400
|
$24.20
-4.13%
|
10/25/2022
|
$22.75
|
PP = $24.17
|
|
MB = $25.38
|
Most Recent Note - 2/8/2023 11:23:42 AM
Y - Color code is changed to yellow as it is promptly rebounding back above its 50 DMA line with today's gain helping its outlook improve. After challenging its pivot point last week members were again reminded - "Disciplined investors know that gains above a stock's pivot point must be backed by at least +40% above average volume to trigger a proper technical buy signal."
>>> FEATURED STOCK ARTICLE : Graphic Packaging Perched Near Pivot Point - 1/27/2023 |
View all notes |
Set NEW NOTE alert |
Company Profile |
SEC
News |
Chart |
Request a new note
C
A
S
I |
GFF
-
NYSE
Griffon Corporation
MATERIALS and CONSTRUCTION - General Building Materials
|
$39.03
|
-0.98
-2.45% |
$40.67
|
521,935
102.54% of 50 DAV
50 DAV is 509,000
|
$43.74
-10.77%
|
11/10/2022
|
$34.13
|
PP = $35.02
|
|
MB = $36.77
|
Most Recent Note - 2/9/2023 4:57:43 PM
G - Pulled back from its 52-week high with today's 4th consecutive loss backed by average volume, It is extended from any sound base. Its 50 DMA line ($37.39) defines near-term support to watch. Reported Dec '22 quarterly earnings +121 on +10% sales revenues versus the year ago period.
>>> FEATURED STOCK ARTICLE : Extended From Any Sound Base and Still Hitting New Highs - 2/2/2023 |
View all notes |
Set NEW NOTE alert |
Company Profile |
SEC
News |
Chart |
Request a new note
C
A
S
I |
TITN
-
NASDAQ
Titan Machinery Inc
SPECIALTY RETAIL
|
$43.37
|
-0.65
-1.48% |
$45.25
|
130,282
49.16% of 50 DAV
50 DAV is 265,000
|
$46.40
-6.53%
|
1/13/2023
|
$40.10
|
PP = $44.45
|
|
MB = $46.67
|
Most Recent Note - 2/6/2023 6:06:07 PM
Y - Pulled back today following a streak of 11 consecutive gains. Its 50 DMA line ($40.62) definies important near-term support to watch on pullbacks. It wedged into new high territory with gains lacking great volume conviction since a new pivot point was recently cited based on its 12/01/22 high plus 10 cents.
>>> FEATURED STOCK ARTICLE : 7th Consecutive Gain for Titan - 1/30/2023 |
View all notes |
Set NEW NOTE alert |
Company Profile |
SEC
News |
Chart |
Request a new note
C
A
S
I |
MYE
-
NYSE
Myers Industries Inc
Containers/Packaging
|
$23.37
|
-0.40
-1.68% |
$24.08
|
91,745
55.94% of 50 DAV
50 DAV is 164,000
|
$25.55
-8.53%
|
12/8/2022
|
$23.94
|
PP = $25.65
|
|
MB = $26.93
|
Most Recent Note - 2/8/2023 5:52:32 PM
Y - Pulled back toward its 50 DMA line with today's loss on light volume after 4 consecutive gains. Found support while testing its 50 DMA line ($23.38) in recent weeks. Faces little resistance due to overhead supply up to the $25.50 level.
>>> FEATURED STOCK ARTICLE : Perched Near High After Finding Support at 50 DMA - 2/3/2023 |
View all notes |
Set NEW NOTE alert |
Company Profile |
SEC
News |
Chart |
Request a new note
C
A
S
I |
Symbol/Exchange
Company Name
Industry Group |
PRICE |
CHANGE
(%Change) |
Day High |
Volume
(% DAV)
(% 50 day avg vol) |
52 Wk Hi
% From Hi |
Featured
Date |
Price
Featured |
Pivot Featured |
|
Max Buy |
BOX
-
NYSE
Box Inc Cl A
Computer Sftwr-Database
|
$34.21
|
+0.05
0.15% |
$34.98
|
826,086
57.85% of 50 DAV
50 DAV is 1,428,000
|
$34.90
-1.98%
|
2/2/2023
|
$34.68
|
PP = $33.14
|
|
MB = $34.80
|
Most Recent Note - 2/7/2023 5:52:56 PM
Y - Posted a gain today and it is near its "max buy" level. On 2/02/23 it broke out above a new pivot point cited based on its 4/20/22 high plus 10 cents. Prior highs in the $31 area define initial support to watch on pulllbacks. See the latest FSU analysis for more details and a new annotated graph.
>>> FEATURED STOCK ARTICLE : Perched Near High After Recent Breakout - 2/7/2023 |
View all notes |
Set NEW NOTE alert |
Company Profile |
SEC
News |
Chart |
Request a new note
C
A
S
I |
STRL
-
NASDAQ
Sterling Infrastructure
MATERIALS and; CONSTRUCTION - Heavy Construction
|
$35.92
|
-1.18
-3.18% |
$37.78
|
315,577
130.40% of 50 DAV
50 DAV is 242,000
|
$37.56
-4.37%
|
12/14/2022
|
$32.41
|
PP = $33.72
|
|
MB = $35.41
|
Most Recent Note - 2/9/2023 4:53:58 PM
G - There was a "negative reversal" today for a loss on higher volume after touching a new all-time high, Prior highs in the $34-33 area define initial support to watch above its 50 DMA line ($33.10).
>>> FEATURED STOCK ARTICLE : Gain With Average Volume While Perched Near Recent Highs - 1/26/2023 |
View all notes |
Set NEW NOTE alert |
Company Profile |
SEC
News |
Chart |
Request a new note
C
A
S
I |
PERI
-
NASDAQ
Perion Networks Ltd
Comml Svcs-Advertising
|
$31.07
|
+0.36
1.17% |
$32.12
|
979,115
173.60% of 50 DAV
50 DAV is 564,000
|
$35.16
-11.63%
|
1/25/2023
|
$31.79
|
PP = $33.19
|
|
MB = $34.85
|
Most Recent Note - 2/9/2023 12:28:34 PM
Y - Halting its slide with today's gain. Pulled back considerably on the prior session for a damaging 4th consecutive loss marked by above average volume. Color code was changed to yellow after slumping back below its "max buy" level, but it has also slumped below the prior high ($33) raising concerns. The next important suppport to watch is its 50 DMA line ($28.51).
>>> FEATURED STOCK ARTICLE : Spurt of Volume-Driven Gains Challenging Prior High - 1/25/2023 |
View all notes |
Set NEW NOTE alert |
Company Profile |
SEC
News |
Chart |
Request a new note
C
A
S
I |
ALGM
-
NASDAQ
Allegro Microsystems Inc
Elec-Semiconductor Mfg
|
$42.70
|
+0.16
0.38% |
$44.10
|
1,212,078
74.96% of 50 DAV
50 DAV is 1,617,000
|
$43.05
-0.81%
|
1/31/2023
|
$37.80
|
PP = $38.38
|
|
MB = $40.30
|
Most Recent Note - 2/7/2023 5:51:24 PM
G - Hit yet another new high with today's gain. Last week it posted 3 consecutive volume-driven gains and its color code was changed to green after rising above its "max buy" level. Prior high in the $38 area defines initial support to watch on pullbacks.
>>> FEATURED STOCK ARTICLE : Big Volume-Driven Gain for Best-Ever Close - 1/31/2023 |
View all notes |
Set NEW NOTE alert |
Company Profile |
SEC
News |
Chart |
Request a new note
C
A
S
I |
|
|
|
THESE ARE NOT BUY RECOMMENDATIONS!
Comments contained in the body of this report are technical
opinions only. The material herein has been obtained
from sources believed to be reliable and accurate, however,
its accuracy and completeness cannot be guaranteed.
This site is not an investment advisor, hence it does
not endorse or recommend any securities or other investments.
Any recommendation contained in this report may not
be suitable for all investors and it is not to be deemed
an offer or solicitation on our part with respect to
the purchase or sale of any securities. All trademarks,
service marks and trade names appearing in this report
are the property of their respective owners, and are
likewise used for identification purposes only.
This report is a service available
only to active Paid Premium Members.
You may opt-out of receiving report notifications
at any time. Questions or comments may be submitted
by writing to Premium Membership Services 665 S.E. 10 Street, Suite 201 Deerfield Beach, FL 33441-5634 or by calling 1-800-965-8307
or 954-785-1121.
|
|
|