You are not logged in.
This means you
CAN ONLY VIEW reports that were published prior to Wednesday, April 9, 2025.
You
MUST UPGRADE YOUR MEMBERSHIP if you want to see any current reports.
AFTER MARKET UPDATE - WEDNESDAY, FEBRUARY 8TH, 2023
Previous After Market Report Next After Market Report >>>
|
|
|
|
DOW |
-207.68 |
33,949.01 |
-0.61% |
|
Volume |
813,792,280 |
-11% |
|
Volume |
5,018,275,000 |
-12% |
|
NASDAQ |
-203.27 |
11,910.52 |
-1.68% |
|
Advancers |
958 |
33% |
|
Advancers |
1,352 |
30% |
|
S&P 500 |
-46.14 |
4,117.86 |
-1.11% |
|
Decliners |
1,967 |
67% |
|
Decliners |
3,223 |
70% |
|
Russell 2000 |
-30.01 |
1,942.60 |
-1.52% |
|
52 Wk Highs |
66 |
|
|
52 Wk Highs |
100 |
|
|
S&P 600 |
-19.47 |
1,279.06 |
-1.50% |
|
52 Wk Lows |
6 |
|
|
52 Wk Lows |
47 |
|
|
 |
Major Indices Fell With Lighter Volume Totals
Kenneth J. Gruneisen - Passed the CAN SLIM® Master's Exam
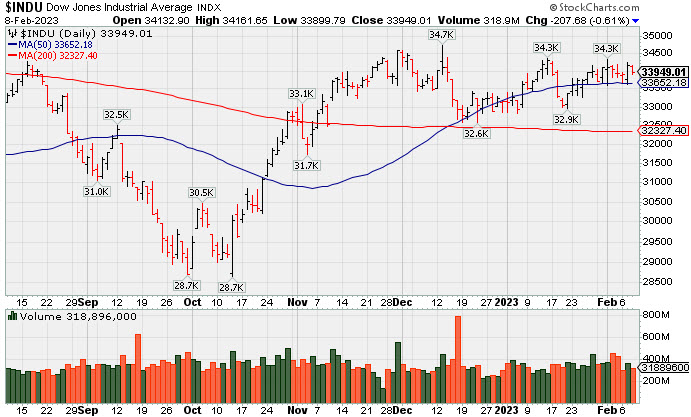
The Dow shed 207 points, while the Nasdaq Composite slid 1.7% amid a sell-off in technology shares. The S&P 500 lost 1.1% with all sectors finishing in negative territory. Volume totals were lighter than the prior session on the NYSE and on the Nasdaq exchange, hinting that the weakness was not due to institutional selling pressure. Breadth was negative as decliners led advancers by 2-1 margin on the NYSE and on the Nasdaq exchange. Leadership thinned as there were only 20 high-ranked companies from the Leaders List that hit new 52-week highs and were listed on the BreakOuts Page versus the total of 35 on the prior session. New 52-week highs totals contracted yet still outnumbered new 52-week lows totals on both the NYSE and the Nasdaq exchange. The major indices are in a confirmed uptrend (M criteria). Disciplined investors have a green light for making new buys only in stocks matching all key criteria of the fact-based investment system.
PICTURED: The Dow Jones Industrial Average pulled back with lighter volume. It has recently been consolidating above its 50-day moving average line.
U.S. equities finished lower Wednesday as investors digested a litany of hawkish rhetoric from Federal Reserve (Fed) officials. Notably, Fed Governor Christopher Waller said the central bank may need to hike rates higher than forecasted, while New York Fed President John Williams reiterated concerns over financial conditions loosening too much. The comments came after Fed Chair Jerome Powell’s speaking engagement yesterday where he reiterated the need for policy to be data driven and stated the path to bring inflation down may not be smooth.
On the data front, MBA mortgage applications for the week ended February 3 climbed 7.4% as declining mortgage rates heighten demand for new home loans and refinancing. Meanwhile, a final December update on wholesale inventories remained unchanged, climbing 0.1% month-over-month. Treasuries strengthened along the curve, with the yield on the benchmark 10-year note down six basis points (0.06%) to 3.62%, while the 30-year bond yield dipped three basis points (0.03%) to 3.68%. The yield on the two-year note, which is more sensitive to changes in monetary policy, shed four basis points (0.04%) to 4.43%. In commodities, West Texas Intermediate (WTI) crude climbed 1.7% to $78.41/barrel amid reports of a drop in domestic crude inventories. However, gains were capped after the Energy Information Administration reported U.S. oil production rose to its highest level since April 2020 last week.
|
 Kenneth J. Gruneisen started out as a licensed stockbroker in August 1987, a couple of months prior to the historic stock market crash that took the Dow Jones Industrial Average down -22.6% in a single day. He has published daily fact-based fundamental and technical analysis on high-ranked stocks online for two decades. Through FACTBASEDINVESTING.COM, Kenneth provides educational articles, news, market commentary, and other information regarding proven investment systems that work in good times and bad.
Comments contained in the body of this report are technical opinions only and are not necessarily those of Gruneisen Growth Corp. The material herein has been obtained from sources believed to be reliable and accurate, however, its accuracy and completeness cannot be guaranteed. Our firm, employees, and customers may effect transactions, including transactions contrary to any recommendation herein, or have positions in the securities mentioned herein or options with respect thereto. Any recommendation contained in this report may not be suitable for all investors and it is not to be deemed an offer or solicitation on our part with respect to the purchase or sale of any securities. |
|
 |
Retail and Tech Indexes Lost Ground
Kenneth J. Gruneisen - Passed the CAN SLIM® Master's Exam
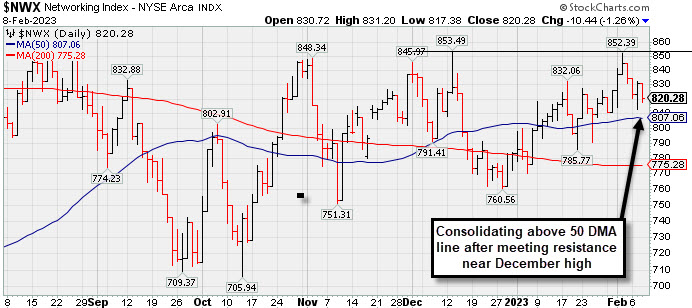
The Broker/Dealer Index ($XBD +0.36%) eked out a small gain while the Bank Index ($BKX -0.72%) edged lower and the Retail Index ($RLX -1.41%) suffered a larger loss. The tech sector had a negative bias as the Semiconductor Index ($SOX -2.19%), Biotech Index ($BTK -1.57%), and Networking Index ($NWX -1.26%) ended unanimously lower. The Oil Services Index ($OSX +1.16%) posted a gain while the Integrated Oil Index ($XOI -0.35%) and Gold & Silver Index ($XAU -0.78%) both ended lower.
PICTURED: The Networking Index ($NWX -1.26%) is consolidating above its 50-day moving average (DMA) line after meeting resistance near its December high.
| Oil Services |
$OSX |
92.86 |
+1.07 |
+1.16% |
+10.73% |
| Integrated Oil |
$XOI |
1,808.94 |
-6.36 |
-0.35% |
+1.21% |
| Semiconductor |
$SOX |
3,055.63 |
-68.52 |
-2.19% |
+20.68% |
| Networking |
$NWX |
820.28 |
-10.44 |
-1.26% |
+4.72% |
| Broker/Dealer |
$XBD |
500.38 |
+1.81 |
+0.36% |
+11.41% |
| Retail |
$RLX |
3,033.04 |
-43.39 |
-1.41% |
+10.13% |
| Gold & Silver |
$XAU |
126.66 |
-1.00 |
-0.78% |
+4.80% |
| Bank |
$BKX |
114.27 |
-0.83 |
-0.72% |
+13.31% |
| Biotech |
$BTK |
5,523.73 |
-88.37 |
-1.57% |
+4.59% |
|
|
|
 |
Featured Stocks
Kenneth J. Gruneisen - Passed the CAN SLIM® Master's Exam
|
|
|
Color Codes Explained :
Y - Better candidates highlighted by our
staff of experts.
G - Previously featured
in past reports as yellow but may no longer be buyable under the
guidelines.
***Last / Change / Volume data in this table is the closing quote data***
Symbol/Exchange
Company Name
Industry Group |
PRICE |
CHANGE
(%Change) |
Day High |
Volume
(% DAV)
(% 50 day avg vol) |
52 Wk Hi
% From Hi |
Featured
Date |
Price
Featured |
Pivot Featured |
|
Max Buy |
 CMC
-
NYSE
CMC
-
NYSE
Commercial Metals Co
METALS and MINING - Steel and Iron
|
$56.25
|
-0.79
-1.38% |
$57.42
|
914,535
85.47% of 50 DAV
50 DAV is 1,070,000
|
$58.09
-3.17%
|
10/14/2022
|
$41.61
|
PP = $44.45
|
|
MB = $46.67
|
Most Recent Note - 2/6/2023 6:01:30 PM
G - Pulled back today following a streak of 4 consecutive gains to a new high. It is extended from any sound base. Its 50 DMA line ($50.91) defines important near-term support to watch on pullbacks. Fundamentals remain strong. See the latest FSU analysis for more details and a new annotated graph.
>>> FEATURED STOCK ARTICLE : Metals Firm Extended From Base and Perched Near High - 2/6/2023 |
View all notes |
Set NEW NOTE alert |
Company Profile |
SEC
News |
Chart |
Request a new note
C
A
S
I |
GPK
-
NYSE
Graphic Packaging Hldg
CONSUMER NON-DURABLES - Packaging and Containers
|
$23.13
|
+0.99
4.47% |
$23.14
|
5,966,986
188.86% of 50 DAV
50 DAV is 3,159,500
|
$24.20
-4.42%
|
10/25/2022
|
$22.75
|
PP = $24.17
|
|
MB = $25.38
|
 Most Recent Note - 2/8/2023 11:23:42 AM
Y - Color code is changed to yellow as it is promptly rebounding back above its 50 DMA line with today's gain helping its outlook improve. After challenging its pivot point last week members were again reminded - "Disciplined investors know that gains above a stock's pivot point must be backed by at least +40% above average volume to trigger a proper technical buy signal."
>>> FEATURED STOCK ARTICLE : Graphic Packaging Perched Near Pivot Point - 1/27/2023 |
View all notes |
Set NEW NOTE alert |
Company Profile |
SEC
News |
Chart |
Request a new note
C
A
S
I |
GFF
-
NYSE
Griffon Corporation
MATERIALS and CONSTRUCTION - General Building Materials
|
$40.01
|
-0.63
-1.55% |
$40.73
|
393,257
78.03% of 50 DAV
50 DAV is 504,000
|
$43.74
-8.53%
|
11/10/2022
|
$34.13
|
PP = $35.02
|
|
MB = $36.77
|
Most Recent Note - 2/6/2023 6:03:29 PM
G - Pulled back from its 52-week high with today's loss on average volume following 4 consecutive gains backed by above average volume, It is extended from any sound base. Its 50 DMA line ($37.16) defines near-term support to watch on pullbacks. Reported Dec '22 quarterly earnings +121 on +10% sales revenues versus the year ago period.
>>> FEATURED STOCK ARTICLE : Extended From Any Sound Base and Still Hitting New Highs - 2/2/2023 |
View all notes |
Set NEW NOTE alert |
Company Profile |
SEC
News |
Chart |
Request a new note
C
A
S
I |
TITN
-
NASDAQ
Titan Machinery Inc
SPECIALTY RETAIL
|
$44.02
|
-0.24
-0.54% |
$44.05
|
140,508
53.43% of 50 DAV
50 DAV is 263,000
|
$46.40
-5.13%
|
1/13/2023
|
$40.10
|
PP = $44.45
|
|
MB = $46.67
|
Most Recent Note - 2/6/2023 6:06:07 PM
Y - Pulled back today following a streak of 11 consecutive gains. Its 50 DMA line ($40.62) definies important near-term support to watch on pullbacks. It wedged into new high territory with gains lacking great volume conviction since a new pivot point was recently cited based on its 12/01/22 high plus 10 cents.
>>> FEATURED STOCK ARTICLE : 7th Consecutive Gain for Titan - 1/30/2023 |
View all notes |
Set NEW NOTE alert |
Company Profile |
SEC
News |
Chart |
Request a new note
C
A
S
I |
MYE
-
NYSE
Myers Industries Inc
Containers/Packaging
|
$23.77
|
-0.80
-3.26% |
$24.39
|
102,638
62.97% of 50 DAV
50 DAV is 163,000
|
$25.55
-6.97%
|
12/8/2022
|
$23.94
|
PP = $25.65
|
|
MB = $26.93
|
Most Recent Note - 2/8/2023 5:52:32 PM
Y - Pulled back toward its 50 DMA line with today's loss on light volume after 4 consecutive gains. Found support while testing its 50 DMA line ($23.38) in recent weeks. Faces little resistance due to overhead supply up to the $25.50 level.
>>> FEATURED STOCK ARTICLE : Perched Near High After Finding Support at 50 DMA - 2/3/2023 |
View all notes |
Set NEW NOTE alert |
Company Profile |
SEC
News |
Chart |
Request a new note
C
A
S
I |
Symbol/Exchange
Company Name
Industry Group |
PRICE |
CHANGE
(%Change) |
Day High |
Volume
(% DAV)
(% 50 day avg vol) |
52 Wk Hi
% From Hi |
Featured
Date |
Price
Featured |
Pivot Featured |
|
Max Buy |
BOX
-
NYSE
Box Inc Cl A
Computer Sftwr-Database
|
$34.16
|
-0.42
-1.21% |
$34.73
|
558,696
39.29% of 50 DAV
50 DAV is 1,422,000
|
$34.90
-2.12%
|
2/2/2023
|
$34.68
|
PP = $33.14
|
|
MB = $34.80
|
Most Recent Note - 2/7/2023 5:52:56 PM
Y - Posted a gain today and it is near its "max buy" level. On 2/02/23 it broke out above a new pivot point cited based on its 4/20/22 high plus 10 cents. Prior highs in the $31 area define initial support to watch on pulllbacks. See the latest FSU analysis for more details and a new annotated graph.
>>> FEATURED STOCK ARTICLE : Perched Near High After Recent Breakout - 2/7/2023 |
View all notes |
Set NEW NOTE alert |
Company Profile |
SEC
News |
Chart |
Request a new note
C
A
S
I |
STRL
-
NASDAQ
Sterling Infrastructure
MATERIALS and; CONSTRUCTION - Heavy Construction
|
$37.10
|
-0.08
-0.22% |
$37.32
|
168,154
70.06% of 50 DAV
50 DAV is 240,000
|
$37.56
-1.22%
|
12/14/2022
|
$32.41
|
PP = $33.72
|
|
MB = $35.41
|
Most Recent Note - 2/8/2023 5:55:04 PM
G - Perched at its all-time high, above its "max buy" level, stubbornly holding its ground. Prior highs in the $34-33 area define initial support to watch above its 50 DMA line ($33.03).
>>> FEATURED STOCK ARTICLE : Gain With Average Volume While Perched Near Recent Highs - 1/26/2023 |
View all notes |
Set NEW NOTE alert |
Company Profile |
SEC
News |
Chart |
Request a new note
C
A
S
I |
PERI
-
NASDAQ
Perion Networks Ltd
Comml Svcs-Advertising
|
$30.71
|
-2.83
-8.44% |
$33.23
|
2,732,291
531.57% of 50 DAV
50 DAV is 514,000
|
$35.16
-12.66%
|
1/25/2023
|
$31.79
|
PP = $33.19
|
|
MB = $34.85
|
Most Recent Note - 2/8/2023 11:43:53 AM
Y - Pulling back considerably today for a damaging 4th consecutive loss marked by above average volume. Color code is changed to yellow after slumping back below its "max buy" level, but it has also slumped below the prior high ($33) raising concerns. The next important suppport to watch is its 50 DMA line ($28.40).
>>> FEATURED STOCK ARTICLE : Spurt of Volume-Driven Gains Challenging Prior High - 1/25/2023 |
View all notes |
Set NEW NOTE alert |
Company Profile |
SEC
News |
Chart |
Request a new note
C
A
S
I |
ALGM
-
NASDAQ
Allegro Microsystems Inc
Elec-Semiconductor Mfg
|
$42.54
|
-0.30
-0.70% |
$43.05
|
1,016,163
63.15% of 50 DAV
50 DAV is 1,609,000
|
$42.96
-0.98%
|
1/31/2023
|
$37.80
|
PP = $38.38
|
|
MB = $40.30
|
Most Recent Note - 2/7/2023 5:51:24 PM
G - Hit yet another new high with today's gain. Last week it posted 3 consecutive volume-driven gains and its color code was changed to green after rising above its "max buy" level. Prior high in the $38 area defines initial support to watch on pullbacks.
>>> FEATURED STOCK ARTICLE : Big Volume-Driven Gain for Best-Ever Close - 1/31/2023 |
View all notes |
Set NEW NOTE alert |
Company Profile |
SEC
News |
Chart |
Request a new note
C
A
S
I |
|
|
|
THESE ARE NOT BUY RECOMMENDATIONS!
Comments contained in the body of this report are technical
opinions only. The material herein has been obtained
from sources believed to be reliable and accurate, however,
its accuracy and completeness cannot be guaranteed.
This site is not an investment advisor, hence it does
not endorse or recommend any securities or other investments.
Any recommendation contained in this report may not
be suitable for all investors and it is not to be deemed
an offer or solicitation on our part with respect to
the purchase or sale of any securities. All trademarks,
service marks and trade names appearing in this report
are the property of their respective owners, and are
likewise used for identification purposes only.
This report is a service available
only to active Paid Premium Members.
You may opt-out of receiving report notifications
at any time. Questions or comments may be submitted
by writing to Premium Membership Services 665 S.E. 10 Street, Suite 201 Deerfield Beach, FL 33441-5634 or by calling 1-800-965-8307
or 954-785-1121.
|
|
|