You are not logged in.
This means you
CAN ONLY VIEW reports that were published prior to Thursday, April 10, 2025.
You
MUST UPGRADE YOUR MEMBERSHIP if you want to see any current reports.
AFTER MARKET UPDATE - THURSDAY, JANUARY 25TH, 2024
Previous After Market Report Next After Market Report >>>
|
|
|
|
DOW |
+242.74 |
38,049.13 |
+0.64% |
|
Volume |
926,792,689 |
+1% |
|
Volume |
5,329,156,100 |
+5% |
|
NASDAQ |
+28.58 |
15,510.50 |
+0.18% |
|
Advancers |
2,158 |
78% |
|
Advancers |
2,489 |
59% |
|
S&P 500 |
+25.61 |
4,894.16 |
+0.53% |
|
Decliners |
611 |
22% |
|
Decliners |
1,726 |
41% |
|
Russell 2000 |
+14.01 |
1,975.88 |
+0.71% |
|
52 Wk Highs |
118 |
|
|
52 Wk Highs |
139 |
|
|
S&P 600 |
+9.22 |
1,287.85 |
+0.72% |
|
52 Wk Lows |
20 |
|
|
52 Wk Lows |
136 |
|
|
 |
Major Indices Posted Solid Gains With Less Leadership
Kenneth J. Gruneisen - Passed the CAN SLIM® Master's Exam
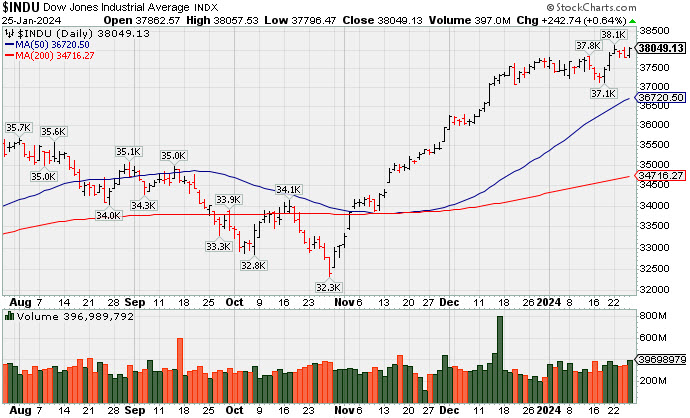
The major indices posted unanimous gains but the tech-heavy Nasdaq Composite Index lagged. Volume was reported higher than the prior session total on the NYSE and lighter on the Nasdaq exchange. Breadth was positive as advancers led decliners by more than a 3-1 margin on the NYSE and 4-3 on the Nasdaq exchange. There were 53 high-ranked companies from the Leaders List that hit new 52-week highs and were listed on the BreakOuts Page versus 90 on the prior session. New 52-week highs totals contracted yet still outnumbered new lows on the NYSE, meanwhile new highs and new lows were evenly matched on the Nasdaq exchange. The major indices are in a confirmed uptrend (M criteria). New buying efforts should be only made in stocks fitting all key criteria of the fact-based investment system.
PICTURED: The Dow Jones Industrial Average managed a best-ever close as it ended the session above the psychologically important 38,000 level.
There was an overall positive bias after the Advance Q4 GDP report showed that real GDP rose 3.3% versus an expected 2.0% and the GDP Price Deflator increased 1.5% versus an expected 2.8%. Friday's report on December Personal Income and Spending will reveal the Fed's preferred gauge on inflation (i.e. the PCE Price Indexes).
Gains were shown by nine of the S&P 500 sectors and the energy sector (+2.2%) saw the largest gain, climbing alongside oil prices ($77.36/bbl, +2.29, +3.1%). Meanwhile, the big loss in Tesla sent the S&P 500 consumer discretionary sector down -1.1%. Tesla (TSLA -12.13%) gapped down below its October 2023 low following disappointing earnings and guidance. The health care sector (-0.2%) was driven lower by shares of Humana (HUM -11.69%) after reporting disappointing quarterly results.
Knight-Swift Transportation (KNX +1.61%) managed a "positive reversal" to end the day higher. A sizable earnings-related gain in IBM (IBM +9.49%) was a big reason behind the outperformance of the Dow Jones Industrial Average.
Concerning US Treasuries, the 2-yr note yield rose five basis points to 4.32% and the 10-yr note yield climbed five basis points to 4.13%.
|
 Kenneth J. Gruneisen started out as a licensed stockbroker in August 1987, a couple of months prior to the historic stock market crash that took the Dow Jones Industrial Average down -22.6% in a single day. He has published daily fact-based fundamental and technical analysis on high-ranked stocks online for two decades. Through FACTBASEDINVESTING.COM, Kenneth provides educational articles, news, market commentary, and other information regarding proven investment systems that work in good times and bad.
Comments contained in the body of this report are technical opinions only and are not necessarily those of Gruneisen Growth Corp. The material herein has been obtained from sources believed to be reliable and accurate, however, its accuracy and completeness cannot be guaranteed. Our firm, employees, and customers may effect transactions, including transactions contrary to any recommendation herein, or have positions in the securities mentioned herein or options with respect thereto. Any recommendation contained in this report may not be suitable for all investors and it is not to be deemed an offer or solicitation on our part with respect to the purchase or sale of any securities. |
|
 |
Retail, Networking, and Commodity-Linked Groups Led Gainers
Kenneth J. Gruneisen - Passed the CAN SLIM® Master's Exam
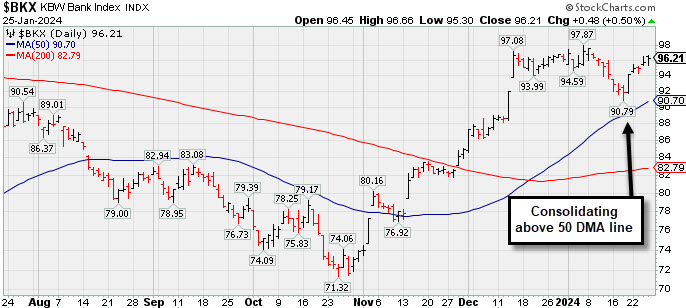
The financial indexes were mixed as the Broker/Dealer Index ($XBD -0.47%) fell and the Bank Index ($BKX +0.50%) posted a small gain. The Retail Index ($RLX +0.70%) finished higher. The tech sector was mixed as the Semiconductor Index ($SOX -0.25%) edged lower while the Biotech Index ($BTK +0.36%) and the Networking Index ($NWX +0.81%) both notched gains. Commodity-linked groups had a positive bias as the Gold & Silver Index ($XAU +1.30%), Oil Services Index ($OSX +1.13%) and the Integrated Oil Index ($XOI +2.25%) posted unanimous gains.
PICTURED: The Bank Index ($BKX +0.50%) posted a gain while consolidating above its 50-day moving average line.
| Oil Services |
$OSX |
83.53 |
+0.93 |
+1.13% |
-0.42% |
| Integrated Oil |
$XOI |
1,859.48 |
+41.01 |
+2.25% |
-0.16% |
| Semiconductor |
$SOX |
4,472.26 |
-11.07 |
-0.25% |
+7.11% |
| Networking |
$NWX |
862.86 |
+6.97 |
+0.81% |
+3.61% |
| Broker/Dealer |
$XBD |
546.98 |
-2.56 |
-0.47% |
-1.85% |
| Retail |
$RLX |
3,987.87 |
+27.61 |
+0.70% |
+2.55% |
| Gold & Silver |
$XAU |
114.16 |
+1.46 |
+1.30% |
-9.17% |
| Bank |
$BKX |
96.21 |
+0.48 |
+0.50% |
+0.20% |
| Biotech |
$BTK |
5,193.96 |
+18.62 |
+0.36% |
-4.15% |
|
|
|
 |
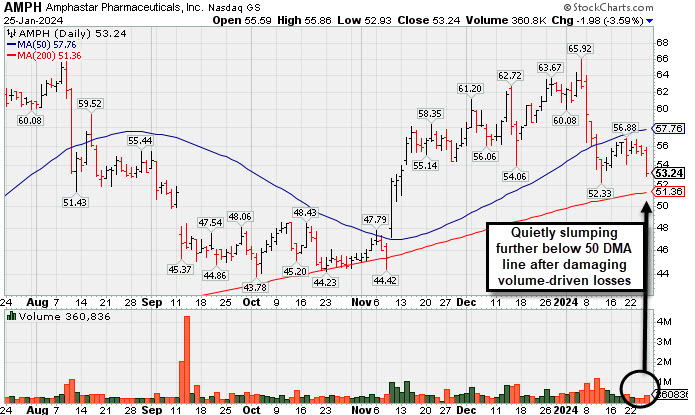
Quietly Sinking Toward 200-Day Moving Average Line
Kenneth J. Gruneisen - Passed the CAN SLIM® Master's Exam
Amphastar Pharm (AMPH -$1.98 or -3.59% to $53.24) fell further below its 50-day moving average (DMA) line toward its 200 DMA line. After damaging volume-driven losses, a rebound above the 50 DMA line ($57.76) is needed for its outlook to improve. Fundamentals remain strong.
AMPH was highlighted in yellow in the 12/04/23 mid-day report (read here) with pivot point cited based on its 11/21/23 high after a cup-with-handle base. It was last covered in great detailon 12/21/23 with an annotated graph under the headline "Consolidating Above Pivot Point With Volume Cooling".
AMPH has a highest possible 99 Earnings Per Share Rating, well above the 80+ minimum guideline for buy candidates. The 4 latest quarterly comparisons through Sep '23 have been well above the +25% minimum earnings guideline (C criteria). Annual earnings history (A criteria) has been strong. It hails from the Medical-Biomed/Biotech group which is currently ranked 3rd on the 197 Industry Groups list (L criteria).
The number of top-rated funds owning its shares reportedly rose from 435 in Mar '23 to 470 in Sep '23, a reassuring sign concerning the I criteria. Its current Up/Down Volume Ratio of 1.1 is an unbiased indication its shares have been under slight accumulation over the past 50 days.
|
|
|
Color Codes Explained :
Y - Better candidates highlighted by our
staff of experts.
G - Previously featured
in past reports as yellow but may no longer be buyable under the
guidelines.
***Last / Change / Volume data in this table is the closing quote data***
Symbol/Exchange
Company Name
Industry Group |
PRICE |
CHANGE
(%Change) |
Day High |
Volume
(% DAV)
(% 50 day avg vol) |
52 Wk Hi
% From Hi |
Featured
Date |
Price
Featured |
Pivot Featured |
|
Max Buy |
 ANET
-
NYSE
ANET
-
NYSE
Arista Networks
Computer-Networking
|
$264.42
|
+1.95
0.74% |
$270.02
|
1,606,889
97.51% of 50 DAV
50 DAV is 1,648,000
|
$270.63
-2.29%
|
10/31/2023
|
$188.84
|
PP = $198.80
|
|
MB = $208.74
|
Most Recent Note - 1/24/2024 7:11:55 PM
G - Churned higher volume today while hovering near its all-time high, extended from any sound base. Its 50 DMA line ($231.59) defines near-term support above the prior low ($226.60 on 1/04/24) area. Fundamentals remain strong.
>>> FEATURED STOCK ARTICLE : Extended From Base and Hovering at All-Time High - 12/26/2023 |
View all notes |
Set NEW NOTE alert |
Company Profile |
SEC
News |
Chart |
Request a new note
C
A
S
I |
NVO
-
NYSE
Novo Nordisk ADR
Medical-Ethical Drugs
|
$105.68
|
+0.47
0.45% |
$105.73
|
2,257,882
54.58% of 50 DAV
50 DAV is 4,137,000
|
$108.98
-3.03%
|
11/2/2023
|
$100.97
|
PP = $104.10
|
|
MB = $109.31
|
Most Recent Note - 1/24/2024 6:54:17 PM
Y - Volume was light today while consolidating near its all-time high, testing prior highs in the $105 area that define initial support above its 50 DMA line ($102.40).
>>> FEATURED STOCK ARTICLE : Gap Up Gain on Prior Session Triggered Technical Buy Signal - 1/5/2024 |
View all notes |
Set NEW NOTE alert |
Company Profile |
SEC
News |
Chart |
Request a new note
C
A
S
I |
QLYS
-
NASDAQ
Qualys
Computer Sftwr-Security
|
$193.10
|
-3.23
-1.65% |
$199.37
|
299,154
83.56% of 50 DAV
50 DAV is 358,000
|
$206.35
-6.42%
|
1/24/2024
|
$196.27
|
PP = $206.45
|
|
MB = $216.77
|
Most Recent Note - 1/24/2024 7:06:03 PM
Y - Recently wedging toward its prior high after finding support above its 50 DMA line ($189). Color code is changed to yellow with new pivot point cited based upon its 12/19/23 high plus 10 cents.
>>> FEATURED STOCK ARTICLE : Posted Light Volume Gain Finding Support at 50-Day Moving Average - 1/8/2024 |
View all notes |
Set NEW NOTE alert |
Company Profile |
SEC
News |
Chart |
Request a new note
C
A
S
I |
AXON
-
NASDAQ
Axon Enterprise
Security/Sfty
|
$252.69
|
+1.45
0.58% |
$253.93
|
225,620
56.55% of 50 DAV
50 DAV is 399,000
|
$262.95
-3.90%
|
11/8/2023
|
$127.84
|
PP = $223.30
|
|
MB = $234.47
|
Most Recent Note - 1/22/2024 5:46:57 PM
G - Posted a 4th consecutive gain with below-average volume and hit a new all-time high. Its 50-day moving average (DMA) line ($241) defines near-term support above prior highs in the $229-231 area.
>>> FEATURED STOCK ARTICLE : Consolidating Well Above Near-Term Support - 1/9/2024 |
View all notes |
Set NEW NOTE alert |
Company Profile |
SEC
News |
Chart |
Request a new note
C
A
S
I |
TDG
-
NYSE
TransDigm Group
Aerospace/Defense
|
$1,078.87
|
+18.95
1.79% |
$1,080.95
|
260,671
128.41% of 50 DAV
50 DAV is 203,000
|
$1,077.54
0.12%
|
12/12/2023
|
$1,000.39
|
PP = $1,013.18
|
|
MB = $1,063.84
|
 Most Recent Note - 1/25/2024 5:44:15 PM
G - Posted again today and color code is changed to green as it rose above its "max buy" level for a new all-time high with a volume-driven gain. Prior highs in the $1,013-1,015 area define near-term support to watch on pullbacks.
>>> FEATURED STOCK ARTICLE : Inching to New Highs With 6th Consecutive Gain - 1/11/2024 |
View all notes |
Set NEW NOTE alert |
Company Profile |
SEC
News |
Chart |
Request a new note
C
A
S
I |
Symbol/Exchange
Company Name
Industry Group |
PRICE |
CHANGE
(%Change) |
Day High |
Volume
(% DAV)
(% 50 day avg vol) |
52 Wk Hi
% From Hi |
Featured
Date |
Price
Featured |
Pivot Featured |
|
Max Buy |
PANW
-
NASDAQ
Palo Alto Networks
Computer Sftwr-Security
|
$340.19
|
-0.05
-0.01% |
$344.46
|
3,446,446
79.23% of 50 DAV
50 DAV is 4,350,000
|
$350.60
-2.97%
|
1/10/2024
|
$313.65
|
PP = $318.00
|
|
MB = $333.90
|
Most Recent Note - 1/24/2024 6:58:39 PM
Y - Perched near its all-time high, stubbornly holding its ground with recent volume totals below average. A valid secondary buy point exists up to 5% above the prior high after finding support at its 10 WMA line since the prior breakout. Fundamentals remain strong.
>>> FEATURED STOCK ARTICLE : Paused After 6 Gains to a New All-Time High - 1/17/2024 |
View all notes |
Set NEW NOTE alert |
Company Profile |
SEC
News |
Chart |
Request a new note
C
A
S
I |
URI
-
NYSE
United Rentals
Comml Svcs-Leasing
|
$651.64
|
+74.74
12.96% |
$658.51
|
2,652,066
396.42% of 50 DAV
50 DAV is 669,000
|
$591.67
10.14%
|
1/24/2024
|
$576.90
|
PP = $585.60
|
|
MB = $614.88
|
Most Recent Note - 1/25/2024 5:45:18 PM
C - Color code is changed to green after it gapped up today and rallied to a new all-time high (and above the "max buy" level) with heavy volume triggering a technical buy signal. Reported Dec '23 quarterly earnings +16% on +13% sales revenues versus the year-ago period, below the +25% minimum earnings guideline (C criteria) raising fundamental concerns. Its prior low ($533.70) and 50 DMA line define near-term support to watch.
>>> FEATURED STOCK ARTICLE : Negative Reversal After New High for United Rentals - 1/24/2024 |
View all notes |
Set NEW NOTE alert |
Company Profile |
SEC
News |
Chart |
Request a new note
C
A
S
I |
AMPH
-
NASDAQ
Amphastar Pharm
Medical-Biomed/Biotech
|
$53.24
|
-1.98
-3.59% |
$55.86
|
361,036
74.59% of 50 DAV
50 DAV is 484,000
|
$67.66
-21.31%
|
12/4/2023
|
$60.84
|
PP = $58.35
|
|
MB = $61.27
|
Most Recent Note - 1/25/2024 5:39:07 PM
G - Quietly slumped further below its 50 DMA line toward its 200 DMA line. A rebound above the 50 DMA line ($57.76) is needed for its outlook to improve. Fundamentals remain strong. See the latest FSU analysis for more details and a new annotated graph.
>>> FEATURED STOCK ARTICLE : Quietly Sinking Toward 200-Day Moving Average Line - 1/25/2024 |
View all notes |
Set NEW NOTE alert |
Company Profile |
SEC
News |
Chart |
Request a new note
C
A
S
I |
TBBK
-
NASDAQ
The Bancorp
Banks-Northeast
|
$40.49
|
-0.73
-1.77% |
$42.08
|
783,636
194.93% of 50 DAV
50 DAV is 402,000
|
$42.46
-4.64%
|
1/22/2024
|
$40.87
|
PP = $42.56
|
|
MB = $44.69
|
Most Recent Note - 1/24/2024 7:08:07 PM
Y - Posted a 6th consecutive gain today and challenged its all-time high. Due to report Dec '23 quarterly results. Volume and volatility often increase near earnings news. Subsequent gains above the pivot point backed by at least +40% above average volume may trigger a technical buy signal.
>>> FEATURED STOCK ARTICLE : Negative Reversals are Signs of Distributional Pressure - 12/22/2023 |
View all notes |
Set NEW NOTE alert |
Company Profile |
SEC
News |
Chart |
Request a new note
C
A
S
I |
LULU
-
NASDAQ
lululemon athletica
Retail-Apparel/Shoes/Acc
|
$474.30
|
-0.54
-0.11% |
$476.94
|
958,347
63.01% of 50 DAV
50 DAV is 1,521,000
|
$516.39
-8.15%
|
12/8/2023
|
$490.61
|
PP = $485.93
|
|
MB = $510.23
|
Most Recent Note - 1/23/2024 8:11:28 PM
Y - Still consolidating just above its 50 DMA line ($471) which defines important near-term support to watch. Retreat below its 2021 high of $485 raised concerns, negating its recent breakout from a 2+ year base.
>>> FEATURED STOCK ARTICLE : Perched at All-Time High With Volume Totals Cooling - 12/27/2023 |
View all notes |
Set NEW NOTE alert |
Company Profile |
SEC
News |
Chart |
Request a new note
C
A
S
I |
Symbol/Exchange
Company Name
Industry Group |
PRICE |
CHANGE
(%Change) |
Day High |
Volume
(% DAV)
(% 50 day avg vol) |
52 Wk Hi
% From Hi |
Featured
Date |
Price
Featured |
Pivot Featured |
|
Max Buy |
CRWD
-
NASDAQ
CrowdStrike Holdings
Computer Sftwr-Security
|
$293.45
|
-6.83
-2.27% |
$306.30
|
4,172,162
123.15% of 50 DAV
50 DAV is 3,388,000
|
$307.55
-4.58%
|
1/2/2024
|
$246.42
|
PP = $261.91
|
|
MB = $275.01
|
Most Recent Note - 1/25/2024 5:40:57 PM
G - Extended from any sound base and it pulled back from its all-time high with today's volume-driven loss. Prior high in the $261 area defines initial support to watch above its 50 DMA line ($249). Fundamentals remain strong.
>>> FEATURED STOCK ARTICLE : CrowdStrike Holdings Pulling Back After "3-Weeks Tight" Pattern - 1/3/2024 |
View all notes |
Set NEW NOTE alert |
Company Profile |
SEC
News |
Chart |
Request a new note
C
A
S
I |
ELF
-
NYSE
e.l.f. Beauty
Cosmetics/Personal Care
|
$156.55
|
+1.68
1.08% |
$159.99
|
925,964
63.29% of 50 DAV
50 DAV is 1,463,000
|
$164.71
-4.95%
|
1/2/2024
|
$138.23
|
PP = $153.63
|
|
MB = $161.31
|
Most Recent Note - 1/22/2024 12:28:29 PM
Y - Rebounded from the early low today but pulled back below the pivot point with recent losses raising some concerns. Fundamentals remain strong.
>>> FEATURED STOCK ARTICLE : Pulled Back After Closing 3 Weeks Tight - 1/2/2024 |
View all notes |
Set NEW NOTE alert |
Company Profile |
SEC
News |
Chart |
Request a new note
C
A
S
I |
KOF
-
NYSE
Coca Cola Femsa Sab Ads
FOOD and BEVERAGE - Beverages - Soft Drinks
|
$90.97
|
+1.09
1.21% |
$91.16
|
130,978
94.64% of 50 DAV
50 DAV is 138,400
|
$99.34
-8.43%
|
1/12/2024
|
$93.38
|
PP = $99.34
|
|
MB = $104.31
|
Most Recent Note - 1/22/2024 5:52:23 PM
Y - Pulled back with light volume testing its 50 DMA line ($89.56). Color code was changed to yellow as a valid secondary buy point was noted up to +5% above the recent high since finding support at its 10 WMA line after an earlier breakout. Its Relative Strength Rating is currently 80, right at the 80+ minimum guideline for buy candidates.
>>> FEATURED STOCK ARTICLE : Secondary Buy Point Noted After Finding Support - 1/12/2024 |
View all notes |
Set NEW NOTE alert |
Company Profile |
SEC
News |
Chart |
Request a new note
C
A
S
I |
PCAR
-
NASDAQ
Paccar
Trucks and Parts-Hvy Duty
|
$102.01
|
+1.18
1.17% |
$103.40
|
2,265,830
99.07% of 50 DAV
50 DAV is 2,287,000
|
$102.22
-0.21%
|
1/23/2024
|
$100.35
|
PP = $98.57
|
|
MB = $103.50
|
Most Recent Note - 1/24/2024 7:02:14 PM
Y - Paused today after 6 consecutive gains. Triggered a technical buy signal on the prior session with a considerable gain backed by +153% above average volume. Reported Dec '23 quarterly earnings +53% on +11% sales revenues versus the year-ago period, its 9th quarterly comparison with better than the +25% minimum earnings guideline (C criteria). There was a downturn in FY' 20 annual earnings (A criteria) like many companies during the pandemic.
>>> FEATURED STOCK ARTICLE : Volume-Driven Breakout for Paccar - 1/23/2024 |
View all notes |
Set NEW NOTE alert |
Company Profile |
SEC
News |
Chart |
Request a new note
C
A
S
I |
|
|
|
THESE ARE NOT BUY RECOMMENDATIONS!
Comments contained in the body of this report are technical
opinions only. The material herein has been obtained
from sources believed to be reliable and accurate, however,
its accuracy and completeness cannot be guaranteed.
This site is not an investment advisor, hence it does
not endorse or recommend any securities or other investments.
Any recommendation contained in this report may not
be suitable for all investors and it is not to be deemed
an offer or solicitation on our part with respect to
the purchase or sale of any securities. All trademarks,
service marks and trade names appearing in this report
are the property of their respective owners, and are
likewise used for identification purposes only.
This report is a service available
only to active Paid Premium Members.
You may opt-out of receiving report notifications
at any time. Questions or comments may be submitted
by writing to Premium Membership Services 665 S.E. 10 Street, Suite 201 Deerfield Beach, FL 33441-5634 or by calling 1-800-965-8307
or 954-785-1121.
|
|
|