You are not logged in.
This means you
CAN ONLY VIEW reports that were published prior to Wednesday, April 9, 2025.
You
MUST UPGRADE YOUR MEMBERSHIP if you want to see any current reports.
AFTER MARKET UPDATE - WEDNESDAY, JANUARY 12TH, 2022
Previous After Market Report Next After Market Report >>>
|
|
|
|
DOW |
+38.30 |
36,290.32 |
+0.11% |
|
Volume |
854,036,636 |
+0% |
|
Volume |
4,320,402,600 |
-1% |
|
NASDAQ |
+34.94 |
15,188.39 |
+0.23% |
|
Advancers |
1,662 |
52% |
|
Advancers |
1,877 |
42% |
|
S&P 500 |
+13.28 |
4,726.35 |
+0.28% |
|
Decliners |
1,563 |
48% |
|
Decliners |
2,634 |
58% |
|
Russell 2000 |
-17.95 |
2,176.06 |
-0.82% |
|
52 Wk Highs |
128 |
|
|
52 Wk Highs |
97 |
|
|
S&P 600 |
-6.38 |
1,381.88 |
-0.46% |
|
52 Wk Lows |
64 |
|
|
52 Wk Lows |
170 |
|
|
 |
Leadership Improved as Major Indices Inched Higher
Kenneth J. Gruneisen - Passed the CAN SLIM® Master's Exam
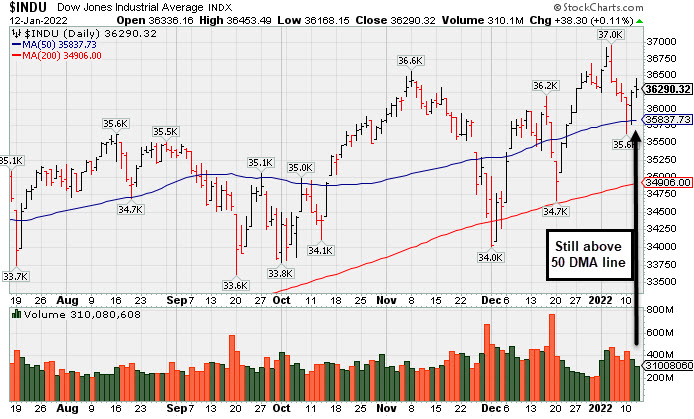
The S&P 500 added 0.3% after yesterday snapping a five-session losing streak. The Dow gained 38 points, while the Nasdaq Composite rose 0.2%. Volume totals reported were just slightly higher than the prior session on the NYSE and just lower on the Nasdaq exchange. Advancers led decliners by a very narrow margin on the NYSE but decliners outnumbered advancers by about 3-2 on the Nasdaq exchange. There were 52 high-ranked companies from the Leaders List that hit new 52-week highs and were listed on the BreakOuts Page, doubling the total of 26 on the prior session. New 52-week highs outnumbered new 52-week lows on the NYSE, but new lows still outnumbered new highs on the Nasdaq exchange. The market averages (M criteria) have an uptrend that is currently under pressure. New buying efforts are to be carefully made under the fact-based investment system's strict criteria. PICTURED: The Dow Jones Industrial Average pulled back with higher volume but has been quietly finding support above its 50-day moving average (DMA) line.
U.S. stocks closed modestly higher on Wednesday after the latest update on inflation matched consensus estimates. As expected, the Consumer Price Index (CPI) jumped 7% year-over-year last month, marking the fastest pace since June 1982. The headline reading reflected a 0.5% increase in December, topping expectations of a 0.4% gain but slowing from the prior 0.8% advance. Core CPI (excluding food and energy) jumped 5.5% year-over-year, the most since 1991.
Treasuries continued to stabilize from last week’s rout. The yield on the 10-year note dipped one basis point (0.01%) to 1.73% after a generally solid auction of the maturity. However, the two-year note yield breached 0.90% for the first time since March 2020 as market participants continued to brace for a potential Federal Reserve rate hike in March. In commodities, WTI crude climbed 1.8% to $82.69/barrel after domestic stockpiles hit their lowest level since October 2018. Also supporting oil prices, a gauge of the U.S. dollar slumped 0.7%, suffering its worst session since May.
Ten of 11 S&P 500 sectors closed in positive territory, with Materials notably outperforming. Miner Freeport-McMoran Inc. (FCX +5.02%) rallied as copper prices touched their highest level since October amid tight supply. Health Care lagged, with Biogen Inc. (BIIB -6.70%) sliding on news Medicare would restrict access to its Alzheimer’s drug to patients enrolled in clinical trials. In earnings, Jefferies Financial Group Inc. (JEF -9.27%) fell as a sharp drop in trading revenue weighed on its quarterly results. |
 Kenneth J. Gruneisen started out as a licensed stockbroker in August 1987, a couple of months prior to the historic stock market crash that took the Dow Jones Industrial Average down -22.6% in a single day. He has published daily fact-based fundamental and technical analysis on high-ranked stocks online for two decades. Through FACTBASEDINVESTING.COM, Kenneth provides educational articles, news, market commentary, and other information regarding proven investment systems that work in good times and bad.
Comments contained in the body of this report are technical opinions only and are not necessarily those of Gruneisen Growth Corp. The material herein has been obtained from sources believed to be reliable and accurate, however, its accuracy and completeness cannot be guaranteed. Our firm, employees, and customers may effect transactions, including transactions contrary to any recommendation herein, or have positions in the securities mentioned herein or options with respect thereto. Any recommendation contained in this report may not be suitable for all investors and it is not to be deemed an offer or solicitation on our part with respect to the purchase or sale of any securities. |
|
 |
Gold & Silver, Bank, and Semiconductor Indexes Led Group Gainers
Kenneth J. Gruneisen - Passed the CAN SLIM® Master's Exam
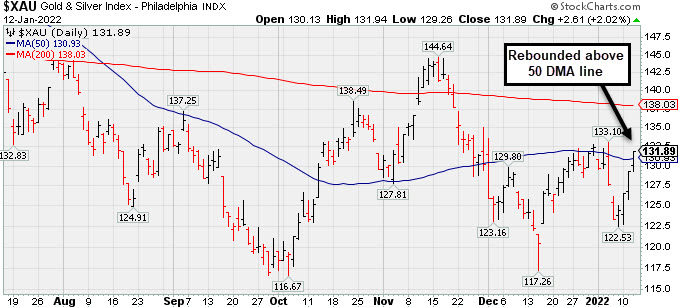
The Bank Index ($BKX +0.51%) edged higher while the Broker/Dealer Index ($XBD -0.81%) lost ground and the Retail Index ($RLX -0.01%) finished flat. The tech sector was mixed as the Semiconductor Index ($SOX +0.66%) posted a modest gain while the Biotech Index ($BTK -1.37%) and Networking Index ($NWX -1.06%) both lost ground. The Oil Services Index ($OSX -0.49%) edged lower while the Integrated Oil Index ($XOI +0.79%) rose. PICTURED: The Gold & Silver Index ($XAU +2.02%) posted a standout gain as it rebounded above its 50 DMA line.
| Oil Services |
$OSX |
62.52 |
-0.31 |
-0.49% |
+18.59% |
| Integrated Oil |
$XOI |
1,353.07 |
+10.55 |
+0.79% |
+14.84% |
| Semiconductor |
$SOX |
3,901.21 |
+25.76 |
+0.66% |
-1.14% |
| Networking |
$NWX |
937.04 |
-10.04 |
-1.06% |
-3.51% |
| Broker/Dealer |
$XBD |
503.96 |
-4.12 |
-0.81% |
+3.51% |
| Retail |
$RLX |
4,108.54 |
-0.61 |
-0.01% |
-2.79% |
| Gold & Silver |
$XAU |
131.89 |
+2.61 |
+2.02% |
-0.42% |
| Bank |
$BKX |
147.28 |
+0.74 |
+0.51% |
+11.39% |
| Biotech |
$BTK |
5,247.77 |
-72.98 |
-1.37% |
-4.90% |
|
|
|
 |
Powerful Volume-Driven Gain for New High
Kenneth J. Gruneisen - Passed the CAN SLIM® Master's Exam
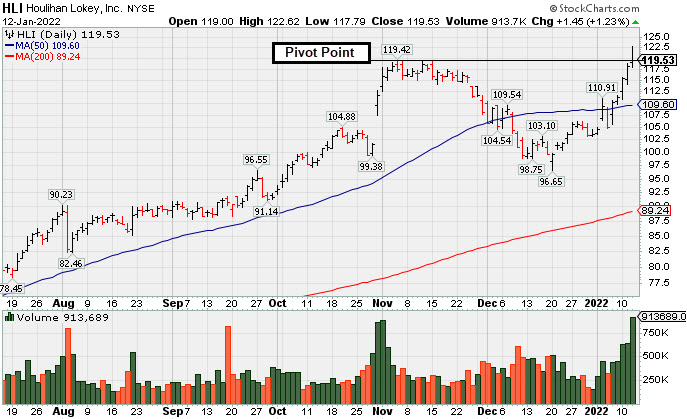
Houlihan Lokey Inc (HLI +$1.45 or +1.23% to $119.53) was highlighted in yellow with new pivot point cited based on its 11/04/21 high plus 10 cents in the earlier mid-day report (read here). It hit a new all-time high as its 5th consecutive gain was backed by +146% above average volume. The gain and close above the pivot point triggered a technical buy signal, however, it ended well off the session high, a sign it was encountering some distributional pressure.
The Finance - Invest Bank/Broker firm has a highest-possible 99 Earnings Per Share Rating. The Sep '21 quarter showed earnings +128% on +95% sales revenues versus the year ago period, marking its 4th quarterly comparison above the +25% minimum earnings guideline (C criteria).
It completed new Public Offerings on 5/20/20 and on 3/12/18 following a 10/26/17 Secondary Offering. It was dropped from the Featured Stocks list on 3/28/18 whenlast shown in this FSU section with an annotated graph under the headline, "Faltering Fundamentally and Technically". Its annual earnings growth (A criteria) history is still a good match with the fact-based investment system's guidelines.
Its current Up/Down Volume Ratio of 1.4 is an unbiased indication its shares have been under accumulation over the past 50 days. It has a current Timeliness rating of A and a Sponsorship rating of C. The number of top-rated funds owning its shares rose from 227 in Mar '17 to 565 in Dec '21, a reassuring sign concerning the I criteria. Its small supply of only 50.5 million shares (S criteria) in the public float can contribute to greater price volatility in the event of institutional buying or selling.
|
|
|
Color Codes Explained :
Y - Better candidates highlighted by our
staff of experts.
G - Previously featured
in past reports as yellow but may no longer be buyable under the
guidelines.
***Last / Change / Volume data in this table is the closing quote data***
Symbol/Exchange
Company Name
Industry Group |
PRICE |
CHANGE
(%Change) |
Day High |
Volume
(% DAV)
(% 50 day avg vol) |
52 Wk Hi
% From Hi |
Featured
Date |
Price
Featured |
Pivot Featured |
|
Max Buy |
 BLDR
-
NYSE
BLDR
-
NYSE
Builders Firstsource Inc
Bldg-Constr Prds/Misc
|
$81.18
|
+0.69
0.86% |
$82.97
|
2,118,602
75.66% of 50 DAV
50 DAV is 2,800,000
|
$86.48
-6.13%
|
8/12/2021
|
$52.38
|
PP = $54.09
|
|
MB = $56.79
|
Most Recent Note - 1/10/2022 5:22:41 PM
G - Managed a positive reversal today. Very extended from any sound base. Reported Sep '21 quarterly earnings +308% on +140% sales revenues versus the year ago period. Its 50 DMA line ($73.99) and prior low ($72.60 on 12/20/21) define important near-term support to watch. See the latest FSU analysis for more details and a new annotated graph.
>>> FEATURED STOCK ARTICLE : Pulling Back After Getting Very Extended From Any Sound Base - 1/10/2022 |
View all notes |
Set NEW NOTE alert |
Company Profile |
SEC
News |
Chart |
Request a new note
C
A
S
I |
KFRC
-
NASDAQ
Kforce Inc
Comml Svcs-Staffing
|
$69.86
|
-0.47
-0.67% |
$71.55
|
171,985
144.53% of 50 DAV
50 DAV is 119,000
|
$81.47
-14.25%
|
9/10/2021
|
$59.53
|
PP = $64.48
|
|
MB = $67.70
|
Most Recent Note - 1/7/2022 5:32:33 PM
G - Sank well below its 50 DMA line ($74.69) today and near the prior low ($71.05 on 12/14/21) which defines important near-term support to watch. Recently reported Sep '21 quarterly earnings +8% on +10% sales revenues versus the year ago period, below the +25% minimum earnings guideline (C criteria), raising fundamental concerns.
>>> FEATURED STOCK ARTICLE : Consolidating Above its 50-Day Moving Average Line - 12/29/2021 |
View all notes |
Set NEW NOTE alert |
Company Profile |
SEC
News |
Chart |
Request a new note
C
A
S
I |
REGN
-
NASDAQ
Regeneron Pharmaceutical
DRUGS - Biotechnology
|
$631.44
|
+5.35
0.85% |
$632.39
|
584,503
78.67% of 50 DAV
50 DAV is 743,000
|
$686.62
-8.04%
|
12/13/2021
|
$647.95
|
PP = $686.72
|
|
MB = $721.06
|
Most Recent Note - 1/11/2022 5:38:14 PM
G - Posted a 4th consecutive gain today, and a rebound above the 50 DMA line ($635) still is needed for its outlook to improve. See the latest FSU analysis for more details and a new annotated graph.
>>> FEATURED STOCK ARTICLE : Regeneron Still Lingering Below 50-Day Moving Average Line - 1/11/2022 |
View all notes |
Set NEW NOTE alert |
Company Profile |
SEC
News |
Chart |
Request a new note
C
A
S
I |
LLY
-
NYSE
Eli Lilly & Co
Medical-Diversified
|
$255.92
|
-6.40
-2.44% |
$257.44
|
6,559,949
213.33% of 50 DAV
50 DAV is 3,075,000
|
$283.91
-9.86%
|
12/16/2021
|
$279.28
|
PP = $275.97
|
|
MB = $289.77
|
 Most Recent Note - 1/12/2022 12:50:12 PM
G - Color code is changed to green after slumping well below its 50 DMA line ($261) with today's big volume-driven loss raising greater concerns and triggering a technical sell signal. A prompt rebound above the 50 DMA line is needed for its outlook to improve.
>>> FEATURED STOCK ARTICLE : Eli Lilly & Co Powered to New Highs With Volume - 12/16/2021 |
View all notes |
Set NEW NOTE alert |
Company Profile |
SEC
News |
Chart |
Request a new note
C
A
S
I |
CAMT
-
NASDAQ
Camtek Ltd
ELECTRONICS - Scientific and Technical Instrum
|
$42.62
|
+0.25
0.59% |
$44.32
|
346,745
127.48% of 50 DAV
50 DAV is 272,000
|
$49.60
-14.07%
|
11/9/2021
|
$45.43
|
PP = $46.11
|
|
MB = $48.42
|
Most Recent Note - 1/7/2022 5:38:36 PM
G - Sank further below its 50 DMA line ($44) with today's loss on lighter volume. Only a prompt rebound above the 50 DMA line would help its outlook improve.
>>> FEATURED STOCK ARTICLE : Closed Above 50-Day Average After Big Gain With Light Volume - 12/15/2021 |
View all notes |
Set NEW NOTE alert |
Company Profile |
SEC
News |
Chart |
Request a new note
C
A
S
I |
Symbol/Exchange
Company Name
Industry Group |
PRICE |
CHANGE
(%Change) |
Day High |
Volume
(% DAV)
(% 50 day avg vol) |
52 Wk Hi
% From Hi |
Featured
Date |
Price
Featured |
Pivot Featured |
|
Max Buy |
AMD
-
NASDAQ
Advanced Micro Devices
ELECTRONICS - Semiconductor - Broad Line
|
$137.47
|
+0.16
0.12% |
$140.57
|
69,568,602
114.44% of 50 DAV
50 DAV is 60,788,000
|
$164.46
-16.41%
|
10/27/2021
|
$124.91
|
PP = $122.59
|
|
MB = $128.72
|
Most Recent Note - 1/11/2022 5:41:13 PM
G - Posted a volume-driven gain today but remains below its 50 DMA line ($144) after damaging losses last week triggered a technical sell signal and also undercut the prior low ($130.60). Fundamentals remain strong after it reported Sep '21 quarterly earnings +78% on +54% sales revenues versus the year ago period.
>>> FEATURED STOCK ARTICLE : Violation of 50-Day Moving Average Triggered Technical Sell Signal - 1/5/2022 |
View all notes |
Set NEW NOTE alert |
Company Profile |
SEC
News |
Chart |
Request a new note
C
A
S
I |
UMC
-
NYSE
United Microelectrnc Adr
ELECTRONICS - Semiconductor - Integrated Cir
|
$11.26
|
-0.12
-1.05% |
$11.36
|
5,312,536
73.52% of 50 DAV
50 DAV is 7,226,000
|
$12.68
-11.20%
|
12/1/2021
|
$12.60
|
PP = $12.72
|
|
MB = $13.36
|
Most Recent Note - 1/10/2022 5:25:19 PM
G - Halted its slide today after recently slumping below its 50 DMA line ($11.37) testing recent lows and its color code was changed to green. More damaging losses would raise concerns and trigger a technical sell signal. A gain and solid close above the pivot point may help clinch a proper new (or add-on) technical buy signal. Reported Sep '21 quarterly earnings +100% on +30% sales revenues versus the year ago period.
>>> FEATURED STOCK ARTICLE : Testing Support and Perched Not Far From Prior Highs - 1/4/2022 |
View all notes |
Set NEW NOTE alert |
Company Profile |
SEC
News |
Chart |
Request a new note
C
A
S
I |
ENTG
-
NASDAQ
Entegris Inc
ELECTRONICS - Semiconductor Equipment and Mate
|
$135.16
|
+0.07
0.05% |
$137.84
|
903,206
74.65% of 50 DAV
50 DAV is 1,210,000
|
$158.00
-14.46%
|
8/4/2021
|
$125.33
|
PP = $126.51
|
|
MB = $132.84
|
Most Recent Note - 1/11/2022 5:42:50 PM
G - Halted its slide recently above its 200 DMA line, but a rebound above the 50 DMA line ($143.98) still is needed for its outlook to improve. Fundamentals remain strong after it recently reported Sep '21 quarterly earnings +37% on +20% sales revenues versus the year ago period.
>>> FEATURED STOCK ARTICLE : Still Below 50-Day Moving Average - 1/3/2022 |
View all notes |
Set NEW NOTE alert |
Company Profile |
SEC
News |
Chart |
Request a new note
C
A
S
I |
DHR
-
NYSE
Danaher Corp
Medical-Diversified
|
$306.38
|
+1.05
0.34% |
$308.34
|
2,614,965
95.58% of 50 DAV
50 DAV is 2,736,000
|
$333.96
-8.26%
|
12/16/2021
|
$321.36
|
PP = $334.06
|
|
MB = $350.76
|
Most Recent Note - 1/11/2022 5:49:24 PM
G - Halted its slide above its 200 DMA line ($289) with recent gains, but still needs to rebound above its 50 DMA line ($313) for its outlook to improve. Subsequent gains above the pivot point with at least +40% above average volume may trigger a technical buy signal. Fundamentals remain strong.
>>> FEATURED STOCK ARTICLE : Consolidating Near Prior Highs Above 50-Day Moving Average - 12/17/2021 |
View all notes |
Set NEW NOTE alert |
Company Profile |
SEC
News |
Chart |
Request a new note
C
A
S
I |
SKY
-
NYSE
Skyline Champion Corp
Bldg-Mobile/Mfg andamp; RV
|
$69.91
|
-1.48
-2.07% |
$72.80
|
337,213
64.35% of 50 DAV
50 DAV is 524,000
|
$85.92
-18.63%
|
11/3/2021
|
$72.19
|
PP = $66.92
|
|
MB = $70.27
|
Most Recent Note - 1/12/2022 5:53:40 PM
G - Concerns remain and grow worse the longer it lingers below its 50 DMA line ($76.82). A rebound above the 50 DMA line is needed for its outlook to improve. Fundamentals remain strong.
>>> FEATURED STOCK ARTICLE : Pulling Back From All-Time High After Recent Rally - 12/14/2021 |
View all notes |
Set NEW NOTE alert |
Company Profile |
SEC
News |
Chart |
Request a new note
C
A
S
I |
Symbol/Exchange
Company Name
Industry Group |
PRICE |
CHANGE
(%Change) |
Day High |
Volume
(% DAV)
(% 50 day avg vol) |
52 Wk Hi
% From Hi |
Featured
Date |
Price
Featured |
Pivot Featured |
|
Max Buy |
DHI
-
NYSE
D R Horton Inc
MATERIALS and CONSTRUCTION - Residential Construction
|
$99.43
|
+0.70
0.71% |
$100.54
|
2,687,688
88.03% of 50 DAV
50 DAV is 3,053,000
|
$110.45
-9.98%
|
12/6/2021
|
$104.40
|
PP = $106.99
|
|
MB = $112.34
|
Most Recent Note - 1/7/2022 5:36:30 PM
G - Color code is changed to green after a damaging 3rd consecutive volume-driven loss violated its 50-day moving average (DMA) line ($100.77) triggering a technical sell signal. Only a prompt rebound above the 50 DMA line would help its outlook improve. See the latest FSU analysis for more details and an annotated graph.
>>> FEATURED STOCK ARTICLE : Pullback Testing Support at 50-Day Moving Average Line - 1/6/2022 |
View all notes |
Set NEW NOTE alert |
Company Profile |
SEC
News |
Chart |
Request a new note
C
A
S
I |
TITN
-
NASDAQ
Titan Machinery Inc
SPECIALTY RETAIL
|
$32.73
|
+0.12
0.37% |
$33.37
|
114,243
62.77% of 50 DAV
50 DAV is 182,000
|
$38.58
-15.16%
|
11/23/2021
|
$36.22
|
PP = $35.34
|
|
MB = $37.11
|
Most Recent Note - 1/10/2022 5:23:56 PM
G - Pulled back today with lighter volume undercutting its 50 DMA line ($32.86). It has not formed a sound base and faces resistance due to overhead supply up to the $38 level. Reported Oct '21 quarterly earnings +81% on +26% sales revenues over the year ago period, its 4th strong quarterly comparison.
>>> FEATURED STOCK ARTICLE : Recently Found Support at 50-Day Moving Average Line - 12/31/2021 |
View all notes |
Set NEW NOTE alert |
Company Profile |
SEC
News |
Chart |
Request a new note
C
A
S
I |
CLFD
-
NASDAQ
Clearfield Inc
TELECOMMUNICATIONS - Cables / Satalite Equipment
|
$72.67
|
+3.97
5.78% |
$73.07
|
256,152
151.57% of 50 DAV
50 DAV is 169,000
|
$86.71
-16.19%
|
12/16/2021
|
$72.76
|
PP = $72.10
|
|
MB = $75.71
|
Most Recent Note - 1/12/2022 5:51:41 PM
G - Posted a volume-driven gain today, finding prompt support near the prior high ($72) and its 50 DMA line ($69.44). More damaging losses would raise concerns. Reported Sep '21 quarterly earnings +141% on +66% sales revenues above the year ago period.
>>> FEATURED STOCK ARTICLE : Negative Reversal After Hitting a New All Time High - 12/30/2021 |
View all notes |
Set NEW NOTE alert |
Company Profile |
SEC
News |
Chart |
Request a new note
C
A
S
I |
POOL
-
NASDAQ
Pool Corp
WHOLESALE - Basic Materials Wholesale
|
$512.81
|
+10.75
2.14% |
$520.60
|
468,429
180.86% of 50 DAV
50 DAV is 259,000
|
$582.27
-11.93%
|
12/27/2021
|
$555.44
|
PP = $582.37
|
|
MB = $611.49
|
Most Recent Note - 1/12/2022 1:00:19 PM
G - Halted its slide above its 200 DMA line ($475) after a damaging streak of 6 losses. A rebound above the 50 DMA line is ($547) is needed for its outlook to improve. Fundamentals remain strong.
>>> FEATURED STOCK ARTICLE : Forming New Base After Finding Prompt Support at 50 DMA - 12/27/2021 |
View all notes |
Set NEW NOTE alert |
Company Profile |
SEC
News |
Chart |
Request a new note
C
A
S
I |
SMPL
-
NASDAQ
Simply Good Foods Co
Food-Confectionery
|
$38.52
|
-0.52
-1.33% |
$39.07
|
897,996
185.54% of 50 DAV
50 DAV is 484,000
|
$43.17
-10.77%
|
12/22/2021
|
$40.04
|
PP = $41.45
|
|
MB = $43.52
|
Most Recent Note - 1/10/2022 12:58:38 PM
G - Color code is changed to green while slumping below its 50 DMA line ($39.22) with a loss today raising greater concerns. Its 200 DMA line ($36.13) and prior low ($35.60 on 12/02/21) define the next important near-term support. Reported Nov '21 quarterly earnings +48% on +22% sales revenues versus the year ago period.
>>> FEATURED STOCK ARTICLE : Formed New 5-Week Base and Perched Near Pivot Point - 12/22/2021 |
View all notes |
Set NEW NOTE alert |
Company Profile |
SEC
News |
Chart |
Request a new note
C
A
S
I |
Symbol/Exchange
Company Name
Industry Group |
PRICE |
CHANGE
(%Change) |
Day High |
Volume
(% DAV)
(% 50 day avg vol) |
52 Wk Hi
% From Hi |
Featured
Date |
Price
Featured |
Pivot Featured |
|
Max Buy |
HLI
-
NYSE
Houlihan Lokey Inc Cl A
Finance-Invest Bnk/Bkrs
|
$119.53
|
+1.45
1.23% |
$122.62
|
930,253
250.74% of 50 DAV
50 DAV is 371,000
|
$119.89
-0.30%
|
1/12/2022
|
$118.49
|
PP = $119.99
|
|
MB = $125.99
|
Most Recent Note - 1/12/2022 5:49:42 PM
Y - Closed above the new pivot point cited with today's 5th consecutive gain triggering a technical buy signal. Reported Sep '21 quarterly earnings +128% on +95% sales revenues versus the year ago period, marking its 4th quarterly comparison above the +25% minimum earnings guideline (C criteria). Completed a new Public Offering on 5/20/20. See the latest FSU analysis for more details and a new annotated graph.
>>> FEATURED STOCK ARTICLE : Powerful Volume-Driven Gain for New High - 1/12/2022 |
View all notes |
Set NEW NOTE alert |
Company Profile |
SEC
News |
Chart |
Request a new note
C
A
S
I |
AVTR
-
NYSE
Avantor Inc
Medical-Research Eqp/Svc
|
$39.20
|
+0.89
2.32% |
$39.37
|
7,343,160
195.43% of 50 DAV
50 DAV is 3,757,400
|
$44.37
-11.65%
|
12/27/2021
|
$41.96
|
PP = $44.47
|
|
MB = $46.69
|
Most Recent Note - 1/10/2022 5:27:38 PM
G - Managed an impressive "positive reversal" today for a volume-driven gain, rallying from its 200 DMA line ($36.88) after briefly undercutting prior lows in the $36 area. A rebound above the 50 DMA line is needed for its outlook to improve. Reported Sep '21 quarterly earnings +46% above the year ago period.
>>> FEATURED STOCK ARTICLE : Rebounding With Volume-Driven Gains - 12/21/2021 |
View all notes |
Set NEW NOTE alert |
Company Profile |
SEC
News |
Chart |
Request a new note
C
A
S
I |
|
|
|
THESE ARE NOT BUY RECOMMENDATIONS!
Comments contained in the body of this report are technical
opinions only. The material herein has been obtained
from sources believed to be reliable and accurate, however,
its accuracy and completeness cannot be guaranteed.
This site is not an investment advisor, hence it does
not endorse or recommend any securities or other investments.
Any recommendation contained in this report may not
be suitable for all investors and it is not to be deemed
an offer or solicitation on our part with respect to
the purchase or sale of any securities. All trademarks,
service marks and trade names appearing in this report
are the property of their respective owners, and are
likewise used for identification purposes only.
This report is a service available
only to active Paid Premium Members.
You may opt-out of receiving report notifications
at any time. Questions or comments may be submitted
by writing to Premium Membership Services 665 S.E. 10 Street, Suite 201 Deerfield Beach, FL 33441-5634 or by calling 1-800-965-8307
or 954-785-1121.
|
|
|