You are not logged in.
This means you
CAN ONLY VIEW reports that were published prior to Sunday, March 30, 2025.
You
MUST UPGRADE YOUR MEMBERSHIP if you want to see any current reports.
AFTER MARKET UPDATE - MONDAY, JANUARY 10TH, 2022
Previous After Market Report Next After Market Report >>>
|
|
|
|
DOW |
-162.79 |
36,068.87 |
-0.45% |
|
Volume |
1,007,056,959 |
+12% |
|
Volume |
5,273,570,000 |
+26% |
|
NASDAQ |
+6.93 |
14,942.83 |
+0.05% |
|
Advancers |
1,179 |
36% |
|
Advancers |
1,575 |
35% |
|
S&P 500 |
-6.74 |
4,670.29 |
-0.14% |
|
Decliners |
2,069 |
64% |
|
Decliners |
2,888 |
65% |
|
Russell 2000 |
-8.66 |
2,171.15 |
-0.40% |
|
52 Wk Highs |
95 |
|
|
52 Wk Highs |
87 |
|
|
S&P 600 |
-5.37 |
1,379.07 |
-0.39% |
|
52 Wk Lows |
205 |
|
|
52 Wk Lows |
740 |
|
|
 |
Breadth Negative as Major Indices Ended Mixed
Kenneth J. Gruneisen - Passed the CAN SLIM® Master's Exam
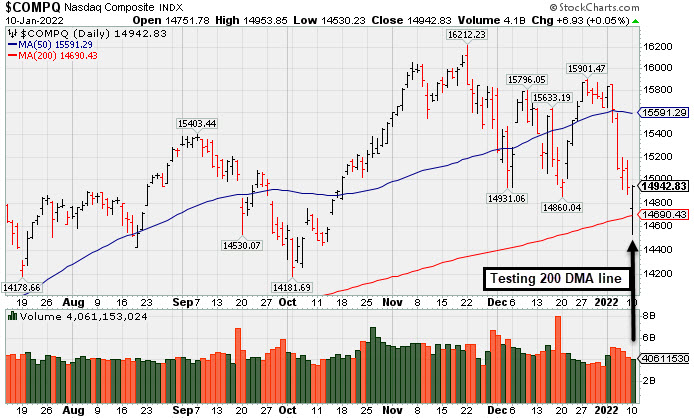
The Dow lost 162 points, while the S&P 500 edged 0.1% lower for its fifth straight daily decline, matching a losing streak not seen since September. Meanwhile, some investors emerged to buy the dip in big tech shares. The Nasdaq Composite rose less than 0.1%, erasing an earlier drop of over 2% following its worst week since February 2021 (-4.5%). The mega-cap Nasdaq 100 also climbed back from an early session loss of roughly 2.7% to end modestly higher (+0.1%). Monday's volume totals reported were higher than the prior session on the NYSE and on the Nasdaq exchange. There was a negative bias as decliners led advancers by almost a 2-1 margin on the NYSE and on the Nasdaq exchange. There were 51 high-ranked companies from the Leaders List that hit new 52-week highs and were listed on the BreakOuts Page, versus the total of 60 on the prior session. New 52-week lows totals expanded and outnumbered new 52-week highs on the NYSE and on the Nasdaq exchange. The market averages (M criteria) have an uptrend that is currently under pressure. New buying efforts are to be carefully made under the fact-based investment system's strict criteria. PICTURED: The Nasdaq Composite Index has pulled back testing its 200-day moving average (DMA) line.
U.S. stocks finished mixed on Monday as investors continued to monitor risks related to rising yields, persistent inflation, and prospects of faster-than-anticipated monetary policy tightening. Treasuries found support, with the yield on the 10-year note holding steady at 1.76%, though still perched at its highest level since January 2020. The benchmark yield surged 25 basis points (0.25%) in the first week of 2022 as the minutes from the Federal Reserve’s (Fed) December meeting revealed policymakers contemplated a rate hike “sooner or at a faster pace” than originally anticipated. Consequently, all eyes will be on Fed Chair Jerome Powell tomorrow, as he speaks during his nomination hearing in Washington. Additionally, an update on the Consumer Price Index (CPI) will be closely watched on Wednesday.
Eight of 11 S&P 500 sectors closed in negative territory, with the more cyclical Industrials and Materials groups leading decliners. Health Care shares outperformed with Moderna Inc. (MRNA +9.28%) rising on upbeat sales estimates. In M&A news, Take-Two Interactive Software Inc. (TTWO -13.13%) fell after agreeing to purchases online game maker Zynga Inc. (ZNGA +40.67%) for roughly $12.7 billion. |
 Kenneth J. Gruneisen started out as a licensed stockbroker in August 1987, a couple of months prior to the historic stock market crash that took the Dow Jones Industrial Average down -22.6% in a single day. He has published daily fact-based fundamental and technical analysis on high-ranked stocks online for two decades. Through FACTBASEDINVESTING.COM, Kenneth provides educational articles, news, market commentary, and other information regarding proven investment systems that work in good times and bad.
Comments contained in the body of this report are technical opinions only and are not necessarily those of Gruneisen Growth Corp. The material herein has been obtained from sources believed to be reliable and accurate, however, its accuracy and completeness cannot be guaranteed. Our firm, employees, and customers may effect transactions, including transactions contrary to any recommendation herein, or have positions in the securities mentioned herein or options with respect thereto. Any recommendation contained in this report may not be suitable for all investors and it is not to be deemed an offer or solicitation on our part with respect to the purchase or sale of any securities. |
|
 |
Gold & Silver and Tech Indexes Rose
Kenneth J. Gruneisen - Passed the CAN SLIM® Master's Exam
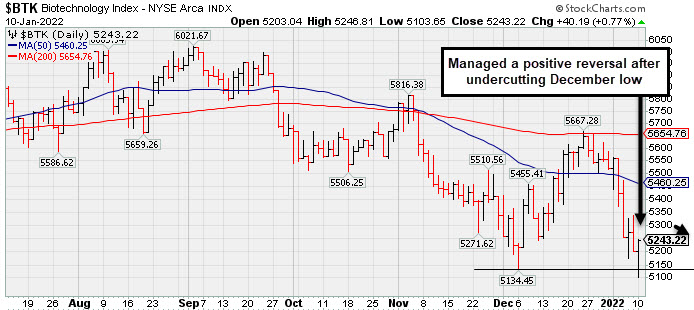
The Broker/Dealer Index ($XBD -0.07%) and Bank Index ($BKX -0.22%) both ended slightly lower while the Retail Index ($RLX -1.08%) suffered a larger loss. The Semiconductor Index ($SOX +0.24%), Biotech Index ($BTK +0.77%), and Networking Index ($NWX +0.79%) posted unanimous gains. The Gold & Silver Index ($XAU +1.65%) posted a solid gain while the Oil Services Index ($OSX -0.14%) and Integrated Oil Index ($XOI -0.32%) both edged lower. PICTURED: The Biotech Index ($BTK +0.77%) managed a "positive reversal" on Monday after undercutting its December low.
| Oil Services |
$OSX |
60.24 |
-0.08 |
-0.14% |
+14.26% |
| Integrated Oil |
$XOI |
1,297.04 |
-4.13 |
-0.32% |
+10.09% |
| Semiconductor |
$SOX |
3,805.39 |
+9.06 |
+0.24% |
-3.57% |
| Networking |
$NWX |
938.03 |
+7.35 |
+0.79% |
-3.40% |
| Broker/Dealer |
$XBD |
499.23 |
-0.37 |
-0.07% |
+2.54% |
| Retail |
$RLX |
4,050.70 |
-44.31 |
-1.08% |
-4.16% |
| Gold & Silver |
$XAU |
126.49 |
+2.05 |
+1.65% |
-4.50% |
| Bank |
$BKX |
145.25 |
-0.32 |
-0.22% |
+9.86% |
| Biotech |
$BTK |
5,243.22 |
+40.19 |
+0.77% |
-4.99% |
|
|
|
 |
Pulling Back After Getting Very Extended From Any Sound Base
Kenneth J. Gruneisen - Passed the CAN SLIM® Master's Exam
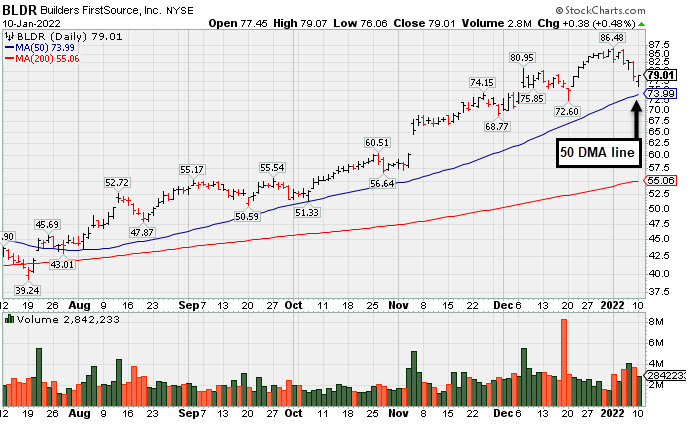
Builders Firstsource Inc (BLDR +$0.38 or +0.48% to $79.01) managed a positive reversal after today's early weakness. It has been pulling back from its all-time high after getting very extended from any sound base. Its 50-day moving average (DMA) line ($73.99) and prior low ($72.60 on 12/20/21) define important near-term support to watch.
BLDR has highest possible Earnings Per Share Rating of 99. Recently it reported Sep '21 quarterly earnings +308% on +140% sales revenues versus the year ago period, continuing its strong earning track record. Quarterly comparisons show impressive sales revenues growth. Annual earning growth has been strong and steady (A criteria).
BLDR rose as much as +65% since highlighted in yellow with pivot point cited based on its 5/10/21 high plus 10 cents in the 8/12/21 mid-day report (read here). It was last shown in greater detail in this FSU section on 12/10/21 with an annotated graph under the headline, "Perched at Record High After +52% Rally in 4 Months".
The number of top-rated funds owning its shares rose from 642 in Dec '20 to 743 in Sep '21, a reassuring sign concerning the I criteria. Its current Up/Down Volume Ratio of 1.7 is an unbiased indication its shares have been under accumulation over the past 50 days. The Bldg-Constr Prds/Misc group is ranked 18th on the 197 Industry Groups list (L criteria). It has a Timelines Rating of A and a Sponsorship Rating of C.
|
|
|
Color Codes Explained :
Y - Better candidates highlighted by our
staff of experts.
G - Previously featured
in past reports as yellow but may no longer be buyable under the
guidelines.
***Last / Change / Volume data in this table is the closing quote data***
Symbol/Exchange
Company Name
Industry Group |
PRICE |
CHANGE
(%Change) |
Day High |
Volume
(% DAV)
(% 50 day avg vol) |
52 Wk Hi
% From Hi |
Featured
Date |
Price
Featured |
Pivot Featured |
|
Max Buy |
 BLDR
-
NYSE
BLDR
-
NYSE
Builders Firstsource Inc
Bldg-Constr Prds/Misc
|
$79.01
|
+0.38
0.48% |
$79.07
|
2,844,730
103.63% of 50 DAV
50 DAV is 2,745,000
|
$86.48
-8.64%
|
8/12/2021
|
$52.38
|
PP = $54.09
|
|
MB = $56.79
|
 Most Recent Note - 1/10/2022 5:22:41 PM
G - Managed a positive reversal today. Very extended from any sound base. Reported Sep '21 quarterly earnings +308% on +140% sales revenues versus the year ago period. Its 50 DMA line ($73.99) and prior low ($72.60 on 12/20/21) define important near-term support to watch. See the latest FSU analysis for more details and a new annotated graph.
>>> FEATURED STOCK ARTICLE : Pulling Back After Getting Very Extended From Any Sound Base - 1/10/2022 |
View all notes |
Set NEW NOTE alert |
Company Profile |
SEC
News |
Chart |
Request a new note
C
A
S
I |
KFRC
-
NASDAQ
Kforce Inc
Comml Svcs-Staffing
|
$69.95
|
-1.22
-1.71% |
$70.87
|
127,034
109.51% of 50 DAV
50 DAV is 116,000
|
$81.47
-14.14%
|
9/10/2021
|
$59.53
|
PP = $64.48
|
|
MB = $67.70
|
Most Recent Note - 1/7/2022 5:32:33 PM
G - Sank well below its 50 DMA line ($74.69) today and near the prior low ($71.05 on 12/14/21) which defines important near-term support to watch. Recently reported Sep '21 quarterly earnings +8% on +10% sales revenues versus the year ago period, below the +25% minimum earnings guideline (C criteria), raising fundamental concerns.
>>> FEATURED STOCK ARTICLE : Consolidating Above its 50-Day Moving Average Line - 12/29/2021 |
View all notes |
Set NEW NOTE alert |
Company Profile |
SEC
News |
Chart |
Request a new note
C
A
S
I |
REGN
-
NASDAQ
Regeneron Pharmaceutical
DRUGS - Biotechnology
|
$621.27
|
+17.54
2.91% |
$621.61
|
822,073
109.03% of 50 DAV
50 DAV is 754,000
|
$686.62
-9.52%
|
12/13/2021
|
$647.95
|
PP = $686.72
|
|
MB = $721.06
|
Most Recent Note - 1/10/2022 5:29:11 PM
G - Posted a 3rd consecutive gain today. A prompt rebound above the 50 DMA line ($635) is needed for its outlook to improve.
>>> FEATURED STOCK ARTICLE : Consolidating Near All-Time High With Little Resistance Remaining - 12/13/2021 |
View all notes |
Set NEW NOTE alert |
Company Profile |
SEC
News |
Chart |
Request a new note
C
A
S
I |
LLY
-
NYSE
Eli Lilly & Co
Medical-Diversified
|
$260.11
|
+0.61
0.24% |
$260.16
|
2,527,795
81.33% of 50 DAV
50 DAV is 3,108,000
|
$283.91
-8.38%
|
12/16/2021
|
$279.28
|
PP = $275.97
|
|
MB = $289.77
|
Most Recent Note - 1/5/2022 8:26:21 PM
Y - Suffered a 5th consecutive loss today testing the recent low ($260) and its 50 DMA line ($260.21). More damaging losses would raise greater concerns and trigger a technical sell signal.
>>> FEATURED STOCK ARTICLE : Eli Lilly & Co Powered to New Highs With Volume - 12/16/2021 |
View all notes |
Set NEW NOTE alert |
Company Profile |
SEC
News |
Chart |
Request a new note
C
A
S
I |
CAMT
-
NASDAQ
Camtek Ltd
ELECTRONICS - Scientific and Technical Instrum
|
$41.34
|
-0.32
-0.77% |
$41.43
|
347,102
130.00% of 50 DAV
50 DAV is 267,000
|
$49.60
-16.65%
|
11/9/2021
|
$45.43
|
PP = $46.11
|
|
MB = $48.42
|
Most Recent Note - 1/7/2022 5:38:36 PM
G - Sank further below its 50 DMA line ($44) with today's loss on lighter volume. Only a prompt rebound above the 50 DMA line would help its outlook improve.
>>> FEATURED STOCK ARTICLE : Closed Above 50-Day Average After Big Gain With Light Volume - 12/15/2021 |
View all notes |
Set NEW NOTE alert |
Company Profile |
SEC
News |
Chart |
Request a new note
C
A
S
I |
Symbol/Exchange
Company Name
Industry Group |
PRICE |
CHANGE
(%Change) |
Day High |
Volume
(% DAV)
(% 50 day avg vol) |
52 Wk Hi
% From Hi |
Featured
Date |
Price
Featured |
Pivot Featured |
|
Max Buy |
AMD
-
NASDAQ
Advanced Micro Devices
ELECTRONICS - Semiconductor - Broad Line
|
$132.00
|
+0.00
0.00% |
$132.42
|
83,749,845
140.57% of 50 DAV
50 DAV is 59,578,000
|
$164.46
-19.74%
|
10/27/2021
|
$124.91
|
PP = $122.59
|
|
MB = $128.72
|
Most Recent Note - 1/5/2022 8:14:28 PM
G - Today's 2nd consecutive big loss violated its 50 DMA line ($143.21) triggering a technical sell signal. Prior low ($130.60) defines the next important chart support level to watch. Fundamentals remain strong after it reported Sep '21 quarterly earnings +78% on +54% sales revenues versus the year ago period. See the latest FSU analysis for more details and a new annotated graph.
>>> FEATURED STOCK ARTICLE : Violation of 50-Day Moving Average Triggered Technical Sell Signal - 1/5/2022 |
View all notes |
Set NEW NOTE alert |
Company Profile |
SEC
News |
Chart |
Request a new note
C
A
S
I |
UMC
-
NYSE
United Microelectrnc Adr
ELECTRONICS - Semiconductor - Integrated Cir
|
$11.14
|
+0.12
1.09% |
$11.14
|
9,070,087
121.58% of 50 DAV
50 DAV is 7,460,000
|
$12.68
-12.15%
|
12/1/2021
|
$12.60
|
PP = $12.72
|
|
MB = $13.36
|
Most Recent Note - 1/10/2022 5:25:19 PM
G - Halted its slide today after recently slumping below its 50 DMA line ($11.37) testing recent lows and its color code was changed to green. More damaging losses would raise concerns and trigger a technical sell signal. A gain and solid close above the pivot point may help clinch a proper new (or add-on) technical buy signal. Reported Sep '21 quarterly earnings +100% on +30% sales revenues versus the year ago period.
>>> FEATURED STOCK ARTICLE : Testing Support and Perched Not Far From Prior Highs - 1/4/2022 |
View all notes |
Set NEW NOTE alert |
Company Profile |
SEC
News |
Chart |
Request a new note
C
A
S
I |
ENTG
-
NASDAQ
Entegris Inc
ELECTRONICS - Semiconductor Equipment and Mate
|
$133.91
|
+1.90
1.44% |
$134.08
|
1,485,497
124.73% of 50 DAV
50 DAV is 1,191,000
|
$158.00
-15.25%
|
8/4/2021
|
$125.33
|
PP = $126.51
|
|
MB = $132.84
|
Most Recent Note - 1/5/2022 8:23:51 PM
G - Slumped further below its 50 DMA line ($144.21) with a big loss today on higher volume. A rebound above the 50 DMA line is needed for its outlook to improve. Fundamentals remain strong after it recently reported Sep '21 quarterly earnings +37% on +20% sales revenues versus the year ago period.
>>> FEATURED STOCK ARTICLE : Still Below 50-Day Moving Average - 1/3/2022 |
View all notes |
Set NEW NOTE alert |
Company Profile |
SEC
News |
Chart |
Request a new note
C
A
S
I |
DHR
-
NYSE
Danaher Corp
Medical-Diversified
|
$303.03
|
+7.36
2.49% |
$303.23
|
3,360,746
124.90% of 50 DAV
50 DAV is 2,690,700
|
$333.96
-9.26%
|
12/16/2021
|
$321.36
|
PP = $334.06
|
|
MB = $350.76
|
Most Recent Note - 1/6/2022 5:17:42 PM
G - Color code is changed to green after slumping below its 50 DMA line ($313.09) during a streak of 4 consecutive losses after it was perched within close striking distance of its 52-week high. Highlighted in yellow with pivot point cited base on its 9/10/21 high plus 10 cents in the 12/16/21 mid-day report. A rebound above the 50 DMA line is needed for its outlook to improve. Subsequent gains above the pivot point with at least +40% above average volume may trigger a technical buy signal. Fundamentals remain strong.
>>> FEATURED STOCK ARTICLE : Consolidating Near Prior Highs Above 50-Day Moving Average - 12/17/2021 |
View all notes |
Set NEW NOTE alert |
Company Profile |
SEC
News |
Chart |
Request a new note
C
A
S
I |
SKY
-
NYSE
Skyline Champion Corp
Bldg-Mobile/Mfg andamp; RV
|
$70.16
|
+0.25
0.36% |
$70.20
|
489,818
94.38% of 50 DAV
50 DAV is 519,000
|
$85.92
-18.34%
|
11/3/2021
|
$72.19
|
PP = $66.92
|
|
MB = $70.27
|
Most Recent Note - 1/7/2022 5:30:31 PM
G - Suffered another big loss today on higher (near average) volume while sinking further below its 50 DMA line ($76.44) again raising concerns. Prior low ($68.54) defines the next important support level. Fundamentals remain strong.
>>> FEATURED STOCK ARTICLE : Pulling Back From All-Time High After Recent Rally - 12/14/2021 |
View all notes |
Set NEW NOTE alert |
Company Profile |
SEC
News |
Chart |
Request a new note
C
A
S
I |
Symbol/Exchange
Company Name
Industry Group |
PRICE |
CHANGE
(%Change) |
Day High |
Volume
(% DAV)
(% 50 day avg vol) |
52 Wk Hi
% From Hi |
Featured
Date |
Price
Featured |
Pivot Featured |
|
Max Buy |
DHI
-
NYSE
D R Horton Inc
MATERIALS and CONSTRUCTION - Residential Construction
|
$95.72
|
+0.48
0.50% |
$95.85
|
4,172,355
140.48% of 50 DAV
50 DAV is 2,970,000
|
$110.45
-13.34%
|
12/6/2021
|
$104.40
|
PP = $106.99
|
|
MB = $112.34
|
Most Recent Note - 1/7/2022 5:36:30 PM
G - Color code is changed to green after a damaging 3rd consecutive volume-driven loss violated its 50-day moving average (DMA) line ($100.77) triggering a technical sell signal. Only a prompt rebound above the 50 DMA line would help its outlook improve. See the latest FSU analysis for more details and an annotated graph.
>>> FEATURED STOCK ARTICLE : Pullback Testing Support at 50-Day Moving Average Line - 1/6/2022 |
View all notes |
Set NEW NOTE alert |
Company Profile |
SEC
News |
Chart |
Request a new note
C
A
S
I |
TITN
-
NASDAQ
Titan Machinery Inc
SPECIALTY RETAIL
|
$32.42
|
-1.03
-3.08% |
$33.56
|
134,714
74.43% of 50 DAV
50 DAV is 181,000
|
$38.58
-15.97%
|
11/23/2021
|
$36.22
|
PP = $35.34
|
|
MB = $37.11
|
Most Recent Note - 1/10/2022 5:23:56 PM
G - Pulled back today with lighter volume undercutting its 50 DMA line ($32.86). It has not formed a sound base and faces resistance due to overhead supply up to the $38 level. Reported Oct '21 quarterly earnings +81% on +26% sales revenues over the year ago period, its 4th strong quarterly comparison.
>>> FEATURED STOCK ARTICLE : Recently Found Support at 50-Day Moving Average Line - 12/31/2021 |
View all notes |
Set NEW NOTE alert |
Company Profile |
SEC
News |
Chart |
Request a new note
C
A
S
I |
CLFD
-
NASDAQ
Clearfield Inc
TELECOMMUNICATIONS - Cables / Satalite Equipment
|
$69.59
|
-2.15
-3.00% |
$70.75
|
255,307
155.68% of 50 DAV
50 DAV is 164,000
|
$86.71
-19.74%
|
12/16/2021
|
$72.76
|
PP = $72.10
|
|
MB = $75.71
|
Most Recent Note - 1/7/2022 5:34:16 PM
G - Suffered yet another big volume-driven loss today finishing near the prior high ($72) which defines initial support to watch above its 50 DMA line ($68.66). Reported Sep '21 quarterly earnings +141% on +66% sales revenues above the year ago period.
>>> FEATURED STOCK ARTICLE : Negative Reversal After Hitting a New All Time High - 12/30/2021 |
View all notes |
Set NEW NOTE alert |
Company Profile |
SEC
News |
Chart |
Request a new note
C
A
S
I |
ODFL
-
NASDAQ
Old Dominion Fght Line
TRANSPORTATION - Trucking
|
$330.17
|
-2.43
-0.73% |
$330.61
|
900,381
142.24% of 50 DAV
50 DAV is 633,000
|
$373.58
-11.62%
|
12/7/2021
|
$365.61
|
PP = $364.17
|
|
MB = $382.38
|
Most Recent Note - 1/5/2022 8:28:24 PM
G - Color code is changed to green after slumping below its 50 DMA line ($351) with another volume-driven loss. A prompt rebound above the 50 DMA line is needed for its outlook to improve. Faces very little near term resistance up to the $373 level..
>>> FEATURED STOCK ARTICLE : Slump Below 50 DMA Line Hurt Outlook - 1/7/2022 |
View all notes |
Set NEW NOTE alert |
Company Profile |
SEC
News |
Chart |
Request a new note
C
A
S
I |
POOL
-
NASDAQ
Pool Corp
WHOLESALE - Basic Materials Wholesale
|
$496.31
|
-6.86
-1.36% |
$497.25
|
541,597
218.39% of 50 DAV
50 DAV is 248,000
|
$582.27
-14.76%
|
12/27/2021
|
$555.44
|
PP = $582.37
|
|
MB = $611.49
|
Most Recent Note - 1/10/2022 5:31:37 PM
G -Slumped further below its 50 DMA line ($548) with higher volume behind today's 6th consecutive loss. A rebound above the 50 DMA line is needed for its outlook to improve. Subsequent gains above the pivot point backed by at least +40% above average volume may trigger a new technical buy signal. Reported strong Sep '21 quarterly results.
>>> FEATURED STOCK ARTICLE : Forming New Base After Finding Prompt Support at 50 DMA - 12/27/2021 |
View all notes |
Set NEW NOTE alert |
Company Profile |
SEC
News |
Chart |
Request a new note
C
A
S
I |
Symbol/Exchange
Company Name
Industry Group |
PRICE |
CHANGE
(%Change) |
Day High |
Volume
(% DAV)
(% 50 day avg vol) |
52 Wk Hi
% From Hi |
Featured
Date |
Price
Featured |
Pivot Featured |
|
Max Buy |
SMPL
-
NASDAQ
Simply Good Foods Co
Food-Confectionery
|
$37.67
|
-1.64
-4.17% |
$39.15
|
992,973
213.54% of 50 DAV
50 DAV is 465,000
|
$43.17
-12.74%
|
12/22/2021
|
$40.04
|
PP = $41.45
|
|
MB = $43.52
|
Most Recent Note - 1/10/2022 12:58:38 PM
G - Color code is changed to green while slumping below its 50 DMA line ($39.22) with a loss today raising greater concerns. Its 200 DMA line ($36.13) and prior low ($35.60 on 12/02/21) define the next important near-term support. Reported Nov '21 quarterly earnings +48% on +22% sales revenues versus the year ago period.
>>> FEATURED STOCK ARTICLE : Formed New 5-Week Base and Perched Near Pivot Point - 12/22/2021 |
View all notes |
Set NEW NOTE alert |
Company Profile |
SEC
News |
Chart |
Request a new note
C
A
S
I |
AVTR
-
NYSE
Avantor Inc
Medical-Research Eqp/Svc
|
$38.28
|
+1.67
4.56% |
$38.31
|
7,046,681
185.21% of 50 DAV
50 DAV is 3,804,800
|
$44.37
-13.73%
|
12/27/2021
|
$41.96
|
PP = $44.47
|
|
MB = $46.69
|
Most Recent Note - 1/10/2022 5:27:38 PM
G - Managed an impressive "positive reversal" today for a volume-driven gain, rallying from its 200 DMA line ($36.88) after briefly undercutting prior lows in the $36 area. A rebound above the 50 DMA line is needed for its outlook to improve. Reported Sep '21 quarterly earnings +46% above the year ago period.
>>> FEATURED STOCK ARTICLE : Rebounding With Volume-Driven Gains - 12/21/2021 |
View all notes |
Set NEW NOTE alert |
Company Profile |
SEC
News |
Chart |
Request a new note
C
A
S
I |
|
|
|
THESE ARE NOT BUY RECOMMENDATIONS!
Comments contained in the body of this report are technical
opinions only. The material herein has been obtained
from sources believed to be reliable and accurate, however,
its accuracy and completeness cannot be guaranteed.
This site is not an investment advisor, hence it does
not endorse or recommend any securities or other investments.
Any recommendation contained in this report may not
be suitable for all investors and it is not to be deemed
an offer or solicitation on our part with respect to
the purchase or sale of any securities. All trademarks,
service marks and trade names appearing in this report
are the property of their respective owners, and are
likewise used for identification purposes only.
This report is a service available
only to active Paid Premium Members.
You may opt-out of receiving report notifications
at any time. Questions or comments may be submitted
by writing to Premium Membership Services 665 S.E. 10 Street, Suite 201 Deerfield Beach, FL 33441-5634 or by calling 1-800-965-8307
or 954-785-1121.
|
|
|