You are not logged in.
This means you
CAN ONLY VIEW reports that were published prior to Saturday, April 5, 2025.
You
MUST UPGRADE YOUR MEMBERSHIP if you want to see any current reports.
AFTER MARKET UPDATE - FRIDAY, OCTOBER 14TH, 2022
Previous After Market Report Next After Market Report >>>
|
|
|
|
DOW |
-403.89 |
29,634.83 |
-1.34% |
|
Volume |
957,888,966 |
-11% |
|
Volume |
4,356,271,500 |
-17% |
|
NASDAQ |
-327.76 |
10,321.39 |
-3.08% |
|
Advancers |
581 |
20% |
|
Advancers |
1,217 |
29% |
|
S&P 500 |
-86.84 |
3,583.07 |
-2.37% |
|
Decliners |
2,392 |
80% |
|
Decliners |
2,978 |
71% |
|
Russell 2000 |
-46.01 |
1,682.40 |
-2.66% |
|
52 Wk Highs |
29 |
|
|
52 Wk Highs |
61 |
|
|
S&P 600 |
-25.75 |
1,091.05 |
-2.31% |
|
52 Wk Lows |
218 |
|
|
52 Wk Lows |
349 |
|
|
The market (M criteria) is still in a correction. Disciplined investors know to protect cash by avoiding any new buys until a new uptrend is confirmed with a proper follow-through day.
|
 |
Major Averages Fell With Lighter Volume Totals
Kenneth J. Gruneisen - Passed the CAN SLIM® Master's Exam
The Dow lost 403 points, but ended the week 1.2% higher, while the Nasdaq Composite shed 3.1% and notched a 3.1% weekly decline. The S&P 500 fell 2.4% and slipped 1.6% for the week. The volume totals reported were lighter than the prior session on the NYSE and on the Nasdaq exchange, indicative of less institutional selling pressure behind the losses. Breadth was negative as decliners led advancers by more than a 4-1 margin on the NYSE and by 5-2 on the Nasdaq exchange. There were 13 high-ranked companies from the Leaders List that hit new 52-week highs and were listed on the BreakOuts Page, versus the total of 9 on the prior session. New 52-week lows totals still solidly outnumbered new 52-week highs totals on both the NYSE and the Nasdaq exchange. The market is still in a correction (M criteria). Caution and patience remain paramount. Disciplined investors know to watch for a follow-through day of big gains to confirm a new uptrend.
Chart courtesy of www.stockcharts.com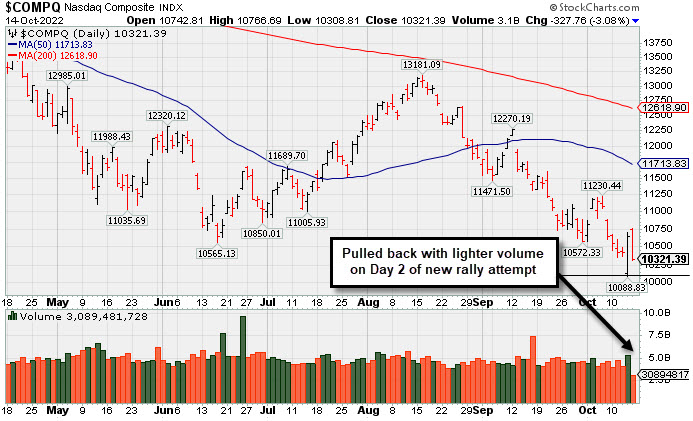 PICTURED: The Nasdaq Composite Index pulled back on Day 2 of a new rally attempt. A solid follow-through day (ideally on Day 4-7) is needed as confirmation of a new market uptrend.
U.S. equities reversed earlier gains and finished lower Friday as investors digested fresh economic data. Stocks were whipsawed this week as market participants digested hotter-than expected inflation data and mixed earnings results from major U.S. banks. All sectors in the S&P 500 finished in negative territory today, with Consumer Discretionary and Energy leading laggards.
On the data front, retail sales were little changed in September after seeing a 0.4% gain in August. The report cited high inflation and rising interest rates as the drivers behind the stagnant figure. Import prices declined 1.2% month-over-month in September, while export prices notched a 0.8% monthly fall. The preliminary October reading of the University of Michigan Consumer Sentiment Index rose to 59.8, a six-month high, indicating more favorable buying conditions. Meanwhile, the report’s year-ahead inflation expectations unexpectedly climbed to 5.1%, increasing for the first time in seven months, while long-term inflation expectations rose to 2.9%.
Treasuries weakened along the curve, with the yield on the benchmark 10-year note adding six basis points (0.06%) to 4.02% to settle above 4% for the first time since October 2008, while the 30-year bond gained five basis points (0.05%) to 3.99%. The yield on the two-year note climbed two basis point (0.02%) to 4.50%. In commodities, West Texas Intermediate (WTI) crude shed 3.7% to $85.80/barrel amid demand concerns. WTI crude notched a 7.4% weekly loss as recessionary worries outweighed tight supply conditions. |
 Kenneth J. Gruneisen started out as a licensed stockbroker in August 1987, a couple of months prior to the historic stock market crash that took the Dow Jones Industrial Average down -22.6% in a single day. He has published daily fact-based fundamental and technical analysis on high-ranked stocks online for two decades. Through FACTBASEDINVESTING.COM, Kenneth provides educational articles, news, market commentary, and other information regarding proven investment systems that work in good times and bad.
Comments contained in the body of this report are technical opinions only and are not necessarily those of Gruneisen Growth Corp. The material herein has been obtained from sources believed to be reliable and accurate, however, its accuracy and completeness cannot be guaranteed. Our firm, employees, and customers may effect transactions, including transactions contrary to any recommendation herein, or have positions in the securities mentioned herein or options with respect thereto. Any recommendation contained in this report may not be suitable for all investors and it is not to be deemed an offer or solicitation on our part with respect to the purchase or sale of any securities. |
|
 |
Commodity-Linked Groups, Retail, Financial, and Tech Fell
Kenneth J. Gruneisen - Passed the CAN SLIM® Master's Exam
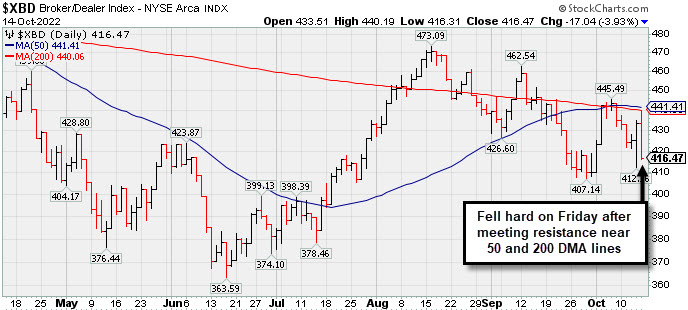
The Retail Index ($RLX -3.80%) and Broker/Dealer Index ($XBD -3.93%) created a big drag on the major averages and the Bank Index ($BKX -1.39%) also fell. Commodity-linked groups suffered big losses on Friday as the Gold & Silver Index ($XAU -4.50%), Oil Services Index ($OSX -4.15%), and Integrated Oil Index ($XOI -3.76%) unanimously slumped. Meanwhile, the Semiconductor Index ($SOX -4.46%) led the tech sector lower as the Networking Index ($NWX -1.83%) and Biotech Index ($BTK -1.11%) also lost ground.
PICTURED: The Broker/Dealer Index ($XBD -3.93%) fell hard on Friday after meeting resistance near its 50-day and 200-day moving average (DMA) lines.
| Oil Services |
$OSX |
66.72 |
-2.89 |
-4.15% |
+26.55% |
| Integrated Oil |
$XOI |
1,658.67 |
-64.77 |
-3.76% |
+40.78% |
| Semiconductor |
$SOX |
2,162.32 |
-100.92 |
-4.46% |
-45.20% |
| Networking |
$NWX |
727.70 |
-13.59 |
-1.83% |
-25.06% |
| Broker/Dealer |
$XBD |
416.47 |
-17.04 |
-3.93% |
-14.46% |
| Retail |
$RLX |
2,891.83 |
-114.33 |
-3.80% |
-31.58% |
| Gold & Silver |
$XAU |
96.42 |
-4.54 |
-4.50% |
-27.20% |
| Bank |
$BKX |
98.19 |
-1.38 |
-1.39% |
-25.73% |
| Biotech |
$BTK |
4,615.01 |
-52.03 |
-1.11% |
-16.37% |
|
|
|
 |
Little Resistance Remains for Strong Steel/Metal Products Firm
Kenneth J. Gruneisen - Passed the CAN SLIM® Master's Exam
Commercial Metals Co (CMC -$0.83 or -1.97% to $41.22) finished the day lower after highlighted in yellow with pivot point cited based on its 8/11/22 high plus 10 cents in the earlier mid-day report (read here). Subsequent gains above the pivot point backed by at least +40% above average volume may trigger a technical buy signal. It rebounded above its 50 and 200 DMA lines with recent volume-driven gains and faces little resistance due to overhead supply up to the $46 level. However, members are again reminded - The market is in a correction (M criteria) and disciplined investors know to avoid new buying efforts until a new rally confirmed with a follow-through day.
CMC reported Aug '22 quarterly earnings +94% on +19% sales revenues versus the year ago period and prior quarterly comparisons were well above the +25% minimum earnings guideline (C criteria) of the fact-based investment system. Annual earnings growth has been strong. It hails from the Metal Proc & Fabrication group which is currently ranked 24th on the 197 Industry Groups list (L criteria).
The company has 120.5 million shares outstanding (S criteria). The number of top-rated funds owning its shares rose from 586 in Dec '21 to 626 in Sep '22. However, its current Up/Down Volume Ratio of 0.8 is an unbiased indication its shares have been under some distributional pressure over the past 50 days. It has a Timeliness Rating of A and a Sponsorship Rating of B.
|
|
|
Color Codes Explained :
Y - Better candidates highlighted by our
staff of experts.
G - Previously featured
in past reports as yellow but may no longer be buyable under the
guidelines.
***Last / Change / Volume data in this table is the closing quote data***
Symbol/Exchange
Company Name
Industry Group |
PRICE |
CHANGE
(%Change) |
Day High |
Volume
(% DAV)
(% 50 day avg vol) |
52 Wk Hi
% From Hi |
Featured
Date |
Price
Featured |
Pivot Featured |
|
Max Buy |
 CI
-
NYSE
CI
-
NYSE
Cigna Corp
Medical-Managed Care
|
$295.30
|
-2.34
-0.79% |
$300.75
|
2,500,635
126.68% of 50 DAV
50 DAV is 1,974,000
|
$299.12
-1.28%
|
7/7/2022
|
$276.55
|
PP = $273.68
|
|
MB = $287.36
|
 Most Recent Note - 10/14/2022 12:35:31 PM
G - Reversed into the red today after an early gain. Posted a gain with average volume and hit a new all-time high on the prior session. Its 50 DMA line ($287.57) defines near-term support above the prior low ($273). Fundamental concerns also remain after the Jun '22 quarter rose +19% on +5% sales revenues versus the year ago period, breaking a streak of 3 quarterly earnings increases above the +25% minimum guideline (C criteria).
>>> FEATURED STOCK ARTICLE : No Resistance Remains Due to Overhead Supply - 10/4/2022 |
View all notes |
Set NEW NOTE alert |
Company Profile |
SEC
News |
Chart |
Request a new note
C
A
S
I |
ESQ
-
NASDAQ
Esquire Financial Hldgs
Finance-Commercial Loans
|
$38.42
|
-0.08
-0.21% |
$38.95
|
24,208
100.87% of 50 DAV
50 DAV is 24,000
|
$41.68
-7.82%
|
7/26/2022
|
$37.74
|
PP = $39.19
|
|
MB = $41.15
|
Most Recent Note - 10/13/2022 4:56:21 PM
G - Posted a volume-driven gain today and rebounded above the 50 DMA line ($38.27) helping its outlook to improve. Faces some near-term resistance due to overhead supply up to the $41 level. The market is in a correction (M criteria) and disciplined investors know to avoid new buying efforts until a new rally confirmed with a follow-through day.
>>> FEATURED STOCK ARTICLE : Rebound Above 50-Day Moving Average Needed for Outlook to Improve - 10/7/2022 |
View all notes |
Set NEW NOTE alert |
Company Profile |
SEC
News |
Chart |
Request a new note
C
A
S
I |
CCRN
-
NASDAQ
Cross Country Healthcare
DIVERSIFIED SERVICES - Staffing and Outsourcing Service
|
$32.07
|
-1.18
-3.55% |
$34.69
|
613,237
66.37% of 50 DAV
50 DAV is 924,000
|
$34.98
-8.32%
|
9/9/2022
|
$27.32
|
PP = $30.61
|
|
MB = $32.14
|
Most Recent Note - 10/14/2022 5:42:58 PM
G - There was a "negative reversal" today after early gains had it poised for a best ever close. Prior highs in the $30.50 area define initial support to watch above its 50 DMA line ($27.12). The market is in a correction (M criteria) and disciplined investors know to avoid new buying efforts until a new rally confirmed with a follow-through day.
>>> FEATURED STOCK ARTICLE : Powerful Breakout While Market Rally Still Needs Confirmation - 10/3/2022 |
View all notes |
Set NEW NOTE alert |
Company Profile |
SEC
News |
Chart |
Request a new note
C
A
S
I |
CMC
-
NYSE
Commercial Metals Co
METALS and MINING - Steel and Iron
|
$41.22
|
-0.83
-1.97% |
$43.07
|
1,317,056
148.32% of 50 DAV
50 DAV is 888,000
|
$46.68
-11.70%
|
10/14/2022
|
$41.61
|
PP = $44.45
|
|
MB = $46.67
|
Most Recent Note - 10/14/2022 5:41:25 PM
Y - There was a "negative reversal" today while it was color coded yellow in the earlier mid-day report with pivot point cited based on its 8/11/22 high plus 10 cents. Subsequent gains above the pivot point backed by at least +40% above average volume may trigger a technical buy signal. Rebounded above its 50 and 200 DMA lines with recent volume-driven gains. Faces little resistance due to overhead supply up to the $46 level. Reported Aug '22 quarterly earnings +94% on +19% sales revenues versus the year ago period and prior quarterly comparisons were well above the +25% minimum earnings guideline (C criteria) of the fact-based investment system. Annual earnings growth has been strong. The market is in a correction (M criteria) and disciplined investors know to avoid new buying efforts until a new rally confirmed with a follow-through day. See the latest FSU analysis for more details and an annotated graph.
>>> FEATURED STOCK ARTICLE : Little Resistance Remains for Strong Steel/Metal Products Firm - 10/14/2022 |
View all notes |
Set NEW NOTE alert |
Company Profile |
SEC
News |
Chart |
Request a new note
C
A
S
I |
|
|
|
THESE ARE NOT BUY RECOMMENDATIONS!
Comments contained in the body of this report are technical
opinions only. The material herein has been obtained
from sources believed to be reliable and accurate, however,
its accuracy and completeness cannot be guaranteed.
This site is not an investment advisor, hence it does
not endorse or recommend any securities or other investments.
Any recommendation contained in this report may not
be suitable for all investors and it is not to be deemed
an offer or solicitation on our part with respect to
the purchase or sale of any securities. All trademarks,
service marks and trade names appearing in this report
are the property of their respective owners, and are
likewise used for identification purposes only.
This report is a service available
only to active Paid Premium Members.
You may opt-out of receiving report notifications
at any time. Questions or comments may be submitted
by writing to Premium Membership Services 665 S.E. 10 Street, Suite 201 Deerfield Beach, FL 33441-5634 or by calling 1-800-965-8307
or 954-785-1121.
|
|
|