You are not logged in.
This means you
CAN ONLY VIEW reports that were published prior to Saturday, April 5, 2025.
You
MUST UPGRADE YOUR MEMBERSHIP if you want to see any current reports.
AFTER MARKET UPDATE - MONDAY, OCTOBER 17TH, 2022
Previous After Market Report Next After Market Report >>>
|
|
|
|
DOW |
+550.99 |
30,185.82 |
+1.86% |
|
Volume |
960,856,905 |
+0% |
|
Volume |
4,383,829,000 |
+1% |
|
NASDAQ |
+354.41 |
10,675.80 |
+3.43% |
|
Advancers |
2,516 |
82% |
|
Advancers |
3,068 |
71% |
|
S&P 500 |
+94.88 |
3,677.95 |
+2.65% |
|
Decliners |
551 |
18% |
|
Decliners |
1,237 |
29% |
|
Russell 2000 |
+53.35 |
1,735.75 |
+3.17% |
|
52 Wk Highs |
43 |
|
|
52 Wk Highs |
70 |
|
|
S&P 600 |
-25.75 |
1,121.13 |
-2.25% |
|
52 Wk Lows |
120 |
|
|
52 Wk Lows |
208 |
|
|
The market (M criteria) is still in a correction. Disciplined investors know to protect cash by avoiding any new buys until a new uptrend is confirmed with a proper follow-through day.
|
 |
Major Averages Rose With Higher Volume on Day 3 of Rally Attempt
Kenneth J. Gruneisen - Passed the CAN SLIM® Master's Exam
The Dow added 550 points, while the Nasdaq Composite climbed 3.4%. The S&P 500 advanced 2.7%. The volume totals reported were higher than the prior session on the NYSE and on the Nasdaq exchange, indicative of an increase in institutional buying demand behind the gains. Breadth was positive as advancers led decliners by almost a 5-1 margin on the NYSE and by 5-2 on the Nasdaq exchange. There were 5 high-ranked companies from the Leaders List that hit new 52-week highs and were listed on the BreakOuts Page, versus the total of 13 on the prior session. New 52-week lows totals contracted but still outnumbered new 52-week highs totals on both the NYSE and the Nasdaq exchange. The market is still in a correction (M criteria). Caution and patience remain paramount. Disciplined investors know to watch for a follow-through day of big gains to confirm a new uptrend.
Chart courtesy of www.stockcharts.com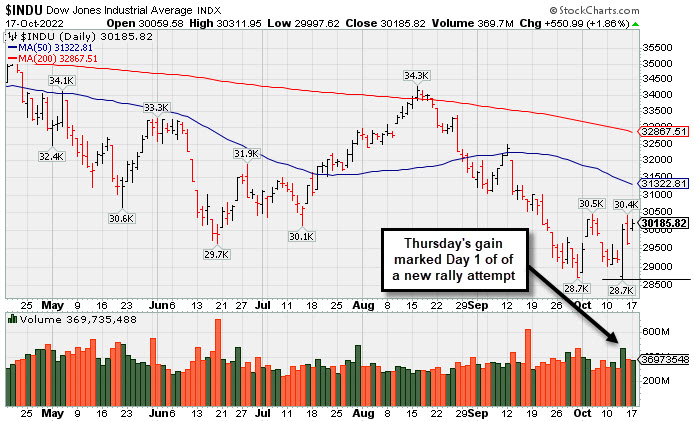 PICTURED: The Dow Jones Industrial Average rose on Day 3 of a new rally attempt. A solid follow-through day (ideally on Day 4-7) is needed as confirmation of a new market uptrend.
U.S. equities gained momentum Monday as investors monitored a strong second day of bank earnings reports. All sectors in the S&P 500 closed in positive territory, with Consumer Discretionary and Real Estate pacing gains.
Treasuries were mixed amid the reversal of nearly all the proposed tax cuts from the newly appointed U.K. Finance Minister, Jeremy Hunt, and following today’s earnings releases. Investors are closely watching earnings to better gauge the impact of inflation and to evaluate what the Federal Reserve (Fed) is likely to do next. The yield on the benchmark 10-year note was little changed at 4.02%, while the 30-year bond yield climbed three basis points (0.03%) to 4.02%. The yield on the more policy-sensitive two-year note dipped five basis points (0.05%) to 4.45%. In commodities, West Texas Intermediate (WTI) crude shed 0.3% to $85.37/barrel despite renewed optimism over global demand and tight supply conditions.
On the data front, the New York Fed’s October Empire Manufacturing survey fell more than expected to -9.1 to contract for the third-straight month. In earnings news, Bank of America Corp (BAC +6.06%) rose after announcing better-than-expected third-quarter earnings results. In his press conference following the release, Bank of America Chief Executive Officer (CEO) Brian Moynihan had an optimistic view of the economy, saying the bank did not see a slowdown in spending growth. Elsewhere, the Bank of New York Mellon Corp (BK +5.06%) rose after its third-quarter results beat estimates as well, with their net interest revenue jumping 44% from a year ago. |
 Kenneth J. Gruneisen started out as a licensed stockbroker in August 1987, a couple of months prior to the historic stock market crash that took the Dow Jones Industrial Average down -22.6% in a single day. He has published daily fact-based fundamental and technical analysis on high-ranked stocks online for two decades. Through FACTBASEDINVESTING.COM, Kenneth provides educational articles, news, market commentary, and other information regarding proven investment systems that work in good times and bad.
Comments contained in the body of this report are technical opinions only and are not necessarily those of Gruneisen Growth Corp. The material herein has been obtained from sources believed to be reliable and accurate, however, its accuracy and completeness cannot be guaranteed. Our firm, employees, and customers may effect transactions, including transactions contrary to any recommendation herein, or have positions in the securities mentioned herein or options with respect thereto. Any recommendation contained in this report may not be suitable for all investors and it is not to be deemed an offer or solicitation on our part with respect to the purchase or sale of any securities. |
|
 |
Retail, Financial, Tech, and Commodity-Linked Groups Rose
Kenneth J. Gruneisen - Passed the CAN SLIM® Master's Exam
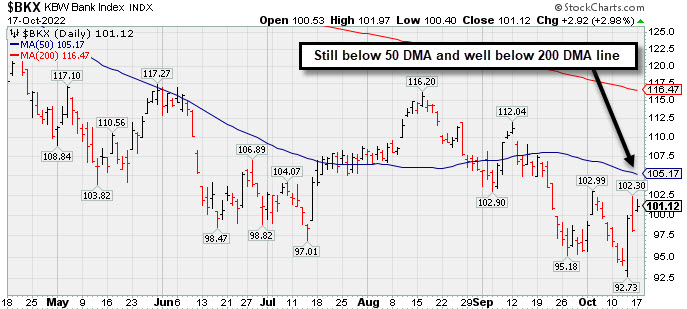
A big gain from the Retail Index ($RLX +4.30%) helped boost the major averages on Monday. The Bank Index ($BKX +2.98%) and Broker/Dealer Index ($XBD +1.56%) both had a positive influence. The tech sector saw unanimous gains as the Semiconductor Index ($SOX +2.28%), Biotech Index ($BTK +2.93%), and Networking Index ($NWX +3.33%) rose. Commodity-linked groups also had a positive bias as the Gold & Silver Index ($XAU +2.76%), Oil Services Index ($OSX +2.62%), and Integrated Oil Index ($XOI +1.34%) each posted a solid gain.
PICTURED: The Bank Index ($BKX +2.98%) posted a solid gain but remains below its 50-day and well below its 200-day moving average (DMA) line.
| Oil Services |
$OSX |
68.47 |
+1.75 |
+2.62% |
+29.87% |
| Integrated Oil |
$XOI |
1,680.83 |
+22.16 |
+1.34% |
+42.66% |
| Semiconductor |
$SOX |
2,211.66 |
+49.34 |
+2.28% |
-43.95% |
| Networking |
$NWX |
751.91 |
+24.20 |
+3.33% |
-22.57% |
| Broker/Dealer |
$XBD |
422.98 |
+6.51 |
+1.56% |
-13.12% |
| Retail |
$RLX |
3,016.09 |
+124.26 |
+4.30% |
-28.64% |
| Gold & Silver |
$XAU |
99.08 |
+2.66 |
+2.76% |
-25.20% |
| Bank |
$BKX |
101.12 |
+2.92 |
+2.98% |
-23.52% |
| Biotech |
$BTK |
4,750.14 |
+135.12 |
+2.93% |
-13.92% |
|
|
|
 |
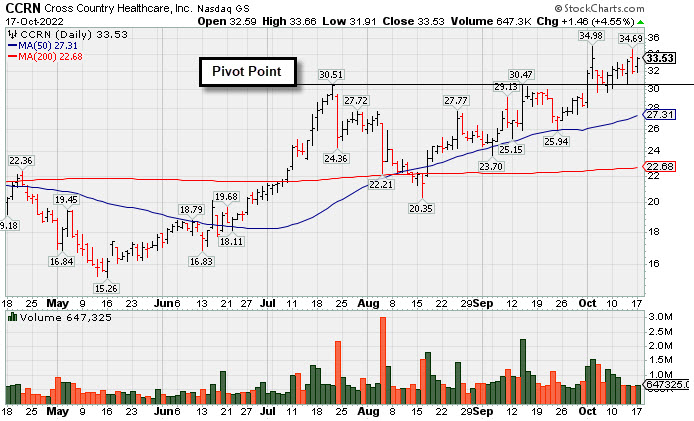
Healthcare Staffing Firm Hovering Near All-Time High
Kenneth J. Gruneisen - Passed the CAN SLIM® Master's Exam
Cross Country Healthcare (CCRN +$1.46 or +4.55% to $33.53) hit a new 52-week high as it rallied above its pivot point with today's big gain backed by +48% above average volume triggering a technical buy signal. Its 50-day moving average (DMA) line ($26.08) defines important near-term support where a violation would raise concerns and trigger a technical sell signal. Members have been repeatedly reminded in the daily Market Commentaries - "The market is in a correction (M criteria) and disciplined investors know to avoid new buying efforts until a new rally confirmed with a follow-through day."
CCRN has a 99 Earnings Per Share Rating, the highest possible. It reported Jun '22 quarterly earnings +198% on +127% sales revenues versus the year ago period. Prior quarterly comparisons showed strong sales revenues and earnings increases. Annual earnings growth (A criteria) has been strong since a downturn in FY '17 and '18.
The company has only 38.2 million shares outstanding (S criteria). The number of top-rated funds owning its shares rose from 326 in Sep '21 to 401 in Jun '22, a reassuring sign concerning the I criteria. Its current Up/Down Volume Ratio of 1.6 is an unbiased indication its shares have been under accumulation over the past 50 days. It has a Timeliness Rating of A and Sponsorship Rating of B.
|
|
|
Color Codes Explained :
Y - Better candidates highlighted by our
staff of experts.
G - Previously featured
in past reports as yellow but may no longer be buyable under the
guidelines.
***Last / Change / Volume data in this table is the closing quote data***
Symbol/Exchange
Company Name
Industry Group |
PRICE |
CHANGE
(%Change) |
Day High |
Volume
(% DAV)
(% 50 day avg vol) |
52 Wk Hi
% From Hi |
Featured
Date |
Price
Featured |
Pivot Featured |
|
Max Buy |
 CI
-
NYSE
CI
-
NYSE
Cigna Corp
Medical-Managed Care
|
$289.92
|
-5.38
-1.82% |
$297.15
|
2,562,905
131.36% of 50 DAV
50 DAV is 1,951,000
|
$300.75
-3.60%
|
7/7/2022
|
$276.55
|
PP = $273.68
|
|
MB = $287.36
|
 Most Recent Note - 10/17/2022 5:30:15 PM
G - Reversed into the red again today after an early gain, encountering distributional pressure. Its 50 DMA line ($287.77) defines near-term support to watch above the recent low ($283.79 on 10/10/22). Fundamental concerns also remain after the Jun '22 quarter rose +19% on +5% sales revenues versus the year ago period, breaking a streak of 3 quarterly earnings increases above the +25% minimum guideline (C criteria).
>>> FEATURED STOCK ARTICLE : No Resistance Remains Due to Overhead Supply - 10/4/2022 |
View all notes |
Set NEW NOTE alert |
Company Profile |
SEC
News |
Chart |
Request a new note
C
A
S
I |
ESQ
-
NASDAQ
Esquire Financial Hldgs
Finance-Commercial Loans
|
$38.88
|
+0.46
1.20% |
$39.00
|
34,505
138.02% of 50 DAV
50 DAV is 25,000
|
$41.68
-6.72%
|
7/26/2022
|
$37.74
|
PP = $39.19
|
|
MB = $41.15
|
Most Recent Note - 10/17/2022 5:33:00 PM
G - Posted a small gain today with above average volume and the recent rebound above the 50 DMA line ($38.34) helped its outlook improve. Faces some near-term resistance due to overhead supply up to the $41 level. The market is in a correction (M criteria) and disciplined investors know to avoid new buying efforts until a new rally confirmed with a follow-through day.
>>> FEATURED STOCK ARTICLE : Rebound Above 50-Day Moving Average Needed for Outlook to Improve - 10/7/2022 |
View all notes |
Set NEW NOTE alert |
Company Profile |
SEC
News |
Chart |
Request a new note
C
A
S
I |
CCRN
-
NASDAQ
Cross Country Healthcare
DIVERSIFIED SERVICES - Staffing and Outsourcing Service
|
$33.53
|
+1.46
4.55% |
$33.66
|
648,763
74.06% of 50 DAV
50 DAV is 876,000
|
$34.98
-4.15%
|
9/9/2022
|
$27.32
|
PP = $30.61
|
|
MB = $32.14
|
Most Recent Note - 10/17/2022 5:26:25 PM
G - Posted a gain today with lighter than average volume and finished 6 cents below its best ever close. Prior highs in the $30.50 area define initial support to watch above its 50 DMA line ($27.31). The market is in a correction (M criteria) and disciplined investors know to avoid new buying efforts until a new rally confirmed with a follow-through day. See the latest FSU analysis for more details and a new annotated graph.
>>> FEATURED STOCK ARTICLE : Healthcare Staffing Firm Hovering Near All-Time High - 10/17/2022 |
View all notes |
Set NEW NOTE alert |
Company Profile |
SEC
News |
Chart |
Request a new note
C
A
S
I |
CMC
-
NYSE
Commercial Metals Co
METALS and MINING - Steel and Iron
|
$42.52
|
+1.30
3.15% |
$43.41
|
1,344,911
149.27% of 50 DAV
50 DAV is 901,000
|
$46.68
-8.91%
|
10/14/2022
|
$41.61
|
PP = $44.45
|
|
MB = $46.67
|
Most Recent Note - 10/17/2022 5:31:31 PM
Y - Gapped up today and posted a solid volume-driven gain. Highlighted in yellow in the 10/14/22 mid-day report with pivot point cited based on its 8/11/22 high plus 10 cents. Subsequent gains above the pivot point backed by at least +40% above average volume may trigger a technical buy signal. Rebounded above its 50 and 200 DMA lines with recent volume-driven gains. Faces little resistance due to overhead supply up to the $46 level. Reported Aug '22 quarterly earnings +94% on +19% sales revenues versus the year ago period and prior quarterly comparisons were well above the +25% minimum earnings guideline (C criteria) of the fact-based investment system. Annual earnings growth has been strong. The market is in a correction (M criteria) and disciplined investors know to avoid new buying efforts until a new rally confirmed with a follow-through day.
>>> FEATURED STOCK ARTICLE : Little Resistance Remains for Strong Steel/Metal Products Firm - 10/14/2022 |
View all notes |
Set NEW NOTE alert |
Company Profile |
SEC
News |
Chart |
Request a new note
C
A
S
I |
|
|
|
THESE ARE NOT BUY RECOMMENDATIONS!
Comments contained in the body of this report are technical
opinions only. The material herein has been obtained
from sources believed to be reliable and accurate, however,
its accuracy and completeness cannot be guaranteed.
This site is not an investment advisor, hence it does
not endorse or recommend any securities or other investments.
Any recommendation contained in this report may not
be suitable for all investors and it is not to be deemed
an offer or solicitation on our part with respect to
the purchase or sale of any securities. All trademarks,
service marks and trade names appearing in this report
are the property of their respective owners, and are
likewise used for identification purposes only.
This report is a service available
only to active Paid Premium Members.
You may opt-out of receiving report notifications
at any time. Questions or comments may be submitted
by writing to Premium Membership Services 665 S.E. 10 Street, Suite 201 Deerfield Beach, FL 33441-5634 or by calling 1-800-965-8307
or 954-785-1121.
|
|
|