You are not logged in.
This means you
CAN ONLY VIEW reports that were published prior to Sunday, April 6, 2025.
You
MUST UPGRADE YOUR MEMBERSHIP if you want to see any current reports.
AFTER MARKET UPDATE - TUESDAY, OCTOBER 25TH, 2022
Previous After Market Report Next After Market Report >>>
|
|
|
|
DOW |
+337.12 |
31,836.74 |
+1.07% |
|
Volume |
1,000,955,950 |
+1% |
|
Volume |
5,111,548,000 |
+6% |
|
NASDAQ |
+246.50 |
11,199.12 |
+2.25% |
|
Advancers |
2,650 |
84% |
|
Advancers |
3,487 |
76% |
|
S&P 500 |
+61.77 |
3,859.11 |
+1.63% |
|
Decliners |
486 |
15% |
|
Decliners |
1,087 |
24% |
|
Russell 2000 |
+47.76 |
1,796.16 |
+2.73% |
|
52 Wk Highs |
70 |
|
|
52 Wk Highs |
107 |
|
|
S&P 600 |
+26.40 |
1,163.43 |
+2.32% |
|
52 Wk Lows |
114 |
|
|
52 Wk Lows |
189 |
|
|
More convincing gains on Friday helped the market (M criteria) signal a new uptrend with a follow-through day.
|
 |
Breadth Solidly Positive as Major Averages Posted More Gains
Kenneth J. Gruneisen - Passed the CAN SLIM® Master's Exam
The Dow added 337 points, while the Nasdaq Composite advanced 2.3% leading U.S. indexes upward. The S&P 500 climbed 1.6%. The volume totals reported were higher than the prior session on the NYSE and on the Nasdaq exchange, indicative of increasing institutional buying demand. Advancers led decliners by more than a 5-1 margin on the NYSE and more than 3-1 on the Nasdaq exchange. There were 34 high-ranked companies from the Leaders List that hit new 52-week highs and were listed on the BreakOuts Page, versus the total of 38 on the prior session. New 52-week lows totals still outnumbered new 52-week highs totals on both the NYSE and the Nasdaq exchange. The follow-through day on Friday helped establish a confirmed uptrend (M criteria). Healthy leadership (new 52-week highs totals) will be essential in the near-term for the rally to be productive.
Chart courtesy of www.stockcharts.com PICTURED: The S&P 500 Index posted a gain with lighter volume, rising above a downward trendline and challenging its 50-day moving average (DMA) line. Only stocks meeting all key-criteria of the fact-based investment system should be considered as buy candidates.
U.S. equities rose Tuesday, adding to Monday’s gains, as investors digested today’s release of economic data. Ten of the 11 S&P 500 sectors closed in positive territory, with Real Estate leading gains. On the data front, October’s Consumer Confidence Index missed estimates and fell 5.3 points to 102.5 amid rising concerns of a possible recession next year. The Richmond Federal Reserve Manufacturing Index also missed estimates and contracted 10 points from September’s print of 0, reaching its lowest level since May 2022.
In corporate earnings news, Medpace Holdings Inc (MEDP +37.71%) gapped up after it blew past analyst expectations. The stock was down roughly 26% year-to-date before third quarter earnings were announced after the close on Monday. Meanwhile, Logitech International SA (LOGI +11.03%) rose following the company’s plans to roll out a new line of products in an effort to spark buyer interest again after losing momentum post- pandemic.
Treasuries strengthened as investors are hopeful for a less hawkish Federal Reserve (Fed). The yield on the benchmark 10-year note lost eighteen basis points (0.18%) to 4.07%, while the 30-year bond yield decreased eighteen basis points (0.18%) to 4.22%. The more policy-sensitive two-year note yield fell six basis points (0.06%) to 4.46%. In commodities, West Texas Intermediate (WTI) crude added 0.4% to $84.95/barrel amid supply concerns from Saudi Arabia’s energy minister, and a weaker dollar. The U.S. Dollar Index dropped 1%, a three-week low, following potential signs the economy may be slowing from Fed rate hikes. |
 Kenneth J. Gruneisen started out as a licensed stockbroker in August 1987, a couple of months prior to the historic stock market crash that took the Dow Jones Industrial Average down -22.6% in a single day. He has published daily fact-based fundamental and technical analysis on high-ranked stocks online for two decades. Through FACTBASEDINVESTING.COM, Kenneth provides educational articles, news, market commentary, and other information regarding proven investment systems that work in good times and bad.
Comments contained in the body of this report are technical opinions only and are not necessarily those of Gruneisen Growth Corp. The material herein has been obtained from sources believed to be reliable and accurate, however, its accuracy and completeness cannot be guaranteed. Our firm, employees, and customers may effect transactions, including transactions contrary to any recommendation herein, or have positions in the securities mentioned herein or options with respect thereto. Any recommendation contained in this report may not be suitable for all investors and it is not to be deemed an offer or solicitation on our part with respect to the purchase or sale of any securities. |
|
 |
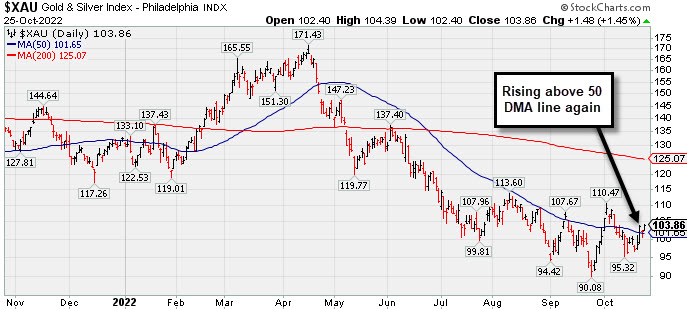
Retail, Financial, Tech, and Gold & Silver Indexes Rose
Kenneth J. Gruneisen - Passed the CAN SLIM® Master's Exam
The Broker/Dealer Index ($XBD +2.04%), Bank Index ($BKX +1.73%), and Retail Index ($RLX +1.54%) each posted influential gains helping to give the major averages a boost. The tech sector had a positive bias as the Semiconductor Index ($SOX +2.26%), Networking Index ($NWX +3.36%), and Biotech Index ($BTK +2.35%) posted unanimous gains. The Gold & Silver Index ($XAU +1.45%) and Oil Services Index ($OSX +0.95%) both posted gains while the Integrated Oil Index ($XOI -0.26%) ended slightly in the red.
PICTURED: The Gold & Silver Index ($XAU +1.45%) has been rising above its 50-day moving average (DMA) line again with recent gains.
| Oil Services |
$OSX |
78.15 |
+0.73 |
+0.95% |
+48.23% |
| Integrated Oil |
$XOI |
1,790.82 |
-4.66 |
-0.26% |
+52.00% |
| Semiconductor |
$SOX |
2,404.69 |
+53.14 |
+2.26% |
-39.06% |
| Networking |
$NWX |
820.36 |
+26.69 |
+3.36% |
-15.52% |
| Broker/Dealer |
$XBD |
444.71 |
+8.89 |
+2.04% |
-8.66% |
| Retail |
$RLX |
3,176.66 |
+48.16 |
+1.54% |
-24.84% |
| Gold & Silver |
$XAU |
103.86 |
+1.48 |
+1.45% |
-21.58% |
| Bank |
$BKX |
102.32 |
+1.74 |
+1.73% |
-22.62% |
| Biotech |
$BTK |
4,820.48 |
+110.79 |
+2.35% |
-12.65% |
|
|
|
 |
Rebound Above 50-Day Moving Average Helped Outlook Improve
Kenneth J. Gruneisen - Passed the CAN SLIM® Master's Exam
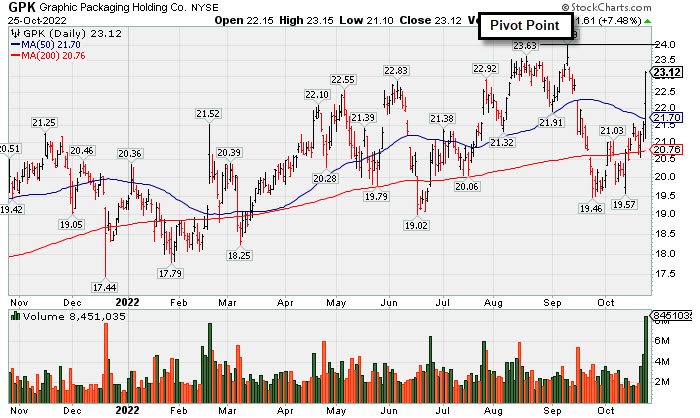
Graphic Packaging Hldg (GPK +$1.61 or +7.48% to $23.12) posted a considerable gain today as it was highlighted in yellow with pivot point cited based on its 9/12/22 high plus 10 cents in the earlier mid-day report (read here). Subsequent gains above the pivot point backed by at least +40% above average volume may trigger a technical buy signal. Today's big gain and rebound above its 50-day moving average (DMA) line ($21.73) is helped its outlook improve. It showed resilience after sputtering below its 200 DMA line since it was dropped from the Featured Stocks list on 9/20/22.
GPK has a 98 Earnings Per Share Rating. It reported Sep '22 quarterly earnings +79% on +38% sales revenues versus the year ago period. Fundamentals have remained strong. It was last shown in this FSU section on 9/06/22 with an annotated graph under the headline, "Recently Slipped Below Pivot Point Testing 50-Day Average". The past 3 quarterly comparisons were well above the +25% minimum earnings guideline (C criteria). Its annual earnings history has been good since a downturn in FY '16 and '17, meeting the fact-based investment system's fundamental guidelines (A criteria).
The Paper & Paper Products group is ranked 122nd on the 197 Industry Groups list and it has a C (39) Group Relative Strength Rating (L criteria). The number of top-rated funds owning its shares rose from 596 in Sep '21 to 637 in Sep '22, a reassuring sign concerning the I criteria. Its current Up/Down Volume Ratio of 0.9 is an unbiased indication its shares have been under slight distributional pressure over the past 50 days.
|
|
|
Color Codes Explained :
Y - Better candidates highlighted by our
staff of experts.
G - Previously featured
in past reports as yellow but may no longer be buyable under the
guidelines.
***Last / Change / Volume data in this table is the closing quote data***
Symbol/Exchange
Company Name
Industry Group |
PRICE |
CHANGE
(%Change) |
Day High |
Volume
(% DAV)
(% 50 day avg vol) |
52 Wk Hi
% From Hi |
Featured
Date |
Price
Featured |
Pivot Featured |
|
Max Buy |
 CI
-
NYSE
CI
-
NYSE
Cigna Corp
Medical-Managed Care
|
$310.92
|
+3.97
1.29% |
$311.61
|
1,650,916
86.53% of 50 DAV
50 DAV is 1,908,000
|
$308.28
0.86%
|
7/7/2022
|
$276.55
|
PP = $273.68
|
|
MB = $287.36
|
 Most Recent Note - 10/25/2022 7:11:39 PM
G - Posted a 4th consecutive gain today with below average volume for a new all-tie high. Its 50 DMA line ($289) defines near-term support to watch above the recent low ($283.79 on 10/10/22). Fundamental concerns also remain after the Jun '22 quarter rose +19% on +5% sales revenues versus the year ago period, breaking a streak of 3 quarterly earnings increases above the +25% minimum guideline (C criteria).
>>> FEATURED STOCK ARTICLE : No Resistance Remains Due to Overhead Supply - 10/4/2022 |
View all notes |
Set NEW NOTE alert |
Company Profile |
SEC
News |
Chart |
Request a new note
C
A
S
I |
ESQ
-
NASDAQ
Esquire Financial Hldgs
Finance-Commercial Loans
|
$41.80
|
+1.98
4.97% |
$42.82
|
99,320
382.00% of 50 DAV
50 DAV is 26,000
|
$41.68
0.29%
|
10/18/2022
|
$40.02
|
PP = $39.95
|
|
MB = $41.95
|
Most Recent Note - 10/25/2022 7:16:44 PM
Y - Hit a new 52-week high with today's big gain backed by +275% above average volume reconfirming a technical buy signal while challenging its "max buy" level. Recent rebound above the 50 DMA line ($38.51) helped its outlook improve. No resistance remains due to overhead supply.
>>> FEATURED STOCK ARTICLE : Rebound Above 50-Day Moving Average Needed for Outlook to Improve - 10/7/2022 |
View all notes |
Set NEW NOTE alert |
Company Profile |
SEC
News |
Chart |
Request a new note
C
A
S
I |
CCRN
-
NASDAQ
Cross Country Healthcare
DIVERSIFIED SERVICES - Staffing and Outsourcing Service
|
$36.10
|
-0.96
-2.59% |
$37.36
|
984,926
110.79% of 50 DAV
50 DAV is 889,000
|
$38.46
-6.14%
|
9/9/2022
|
$27.32
|
PP = $30.61
|
|
MB = $32.14
|
Most Recent Note - 10/25/2022 7:10:44 PM
G - Pulled back today with near average volume after rallying to a new 52-week high on the prior session with higher volume. Prior highs in the $30.50 area define initial support to watch above its 50 DMA line ($28.86).
>>> FEATURED STOCK ARTICLE : Healthcare Staffing Firm Hovering Near All-Time High - 10/17/2022 |
View all notes |
Set NEW NOTE alert |
Company Profile |
SEC
News |
Chart |
Request a new note
C
A
S
I |
CMC
-
NYSE
Commercial Metals Co
METALS and MINING - Steel and Iron
|
$44.63
|
+0.43
0.97% |
$44.66
|
1,589,526
162.69% of 50 DAV
50 DAV is 977,000
|
$46.68
-4.39%
|
10/14/2022
|
$41.61
|
PP = $44.45
|
|
MB = $46.67
|
Most Recent Note - 10/25/2022 7:14:04 PM
Y - Posted a 4th consecutive small gain today with above average volume, inching further above the pivot point. Faces very little resistance due to overhead supply up to the $46 level. Reported Aug '22 quarterly earnings +94% on +19% sales revenues versus the year ago period and prior quarterly comparisons were well above the +25% minimum earnings guideline (C criteria) of the fact-based investment system. Annual earnings growth has been strong.
>>> FEATURED STOCK ARTICLE : Little Resistance Remains for Strong Steel/Metal Products Firm - 10/14/2022 |
View all notes |
Set NEW NOTE alert |
Company Profile |
SEC
News |
Chart |
Request a new note
C
A
S
I |
VRTX
-
NASDAQ
Vertex Pharmaceuticals
Medical-Biomed/Biotech
|
$309.21
|
-1.29
-0.42% |
$315.37
|
1,756,426
137.76% of 50 DAV
50 DAV is 1,275,000
|
$312.27
-0.98%
|
10/24/2022
|
$308.47
|
PP = $306.05
|
|
MB = $321.35
|
Most Recent Note - 10/25/2022 7:19:50 PM
Y - There was a "negative reversal" today after early gains. Highlighted in yellow with pivot point cited based on its 8/15/22 high pus 10 cents in the 10/24/22 mid-day report. Hit a new 52-week high as its gain above the pivot point was backed +58% above average volume triggering a proper technical buy signal. Reported greatly improved earnings on +22% sales revenues for the Jun '22 quarter versus the year-ago period, and 3 of the past 4 quarterly comparisons were above the +25% minimum earnings guideline (C criteria). Annual earnings (A criteria) history has been strong. See the latest FS analysis for more details and an annotated graph.
>>> FEATURED STOCK ARTICLE : Volume-Driven Gain Triggered Technical Buy Signal - 10/24/2022 |
View all notes |
Set NEW NOTE alert |
Company Profile |
SEC
News |
Chart |
Request a new note
C
A
S
I |
Symbol/Exchange
Company Name
Industry Group |
PRICE |
CHANGE
(%Change) |
Day High |
Volume
(% DAV)
(% 50 day avg vol) |
52 Wk Hi
% From Hi |
Featured
Date |
Price
Featured |
Pivot Featured |
|
Max Buy |
CLFD
-
NASDAQ
Clearfield Inc
TELECOMMUNICATIONS - Cables / Satalite Equipment
|
$118.60
|
+10.58
9.79% |
$121.04
|
399,276
165.67% of 50 DAV
50 DAV is 241,000
|
$130.01
-8.78%
|
10/25/2022
|
$117.96
|
PP = $130.11
|
|
MB = $136.62
|
Most Recent Note - 10/25/2022 7:12:42 PM
Y - Rallied toward its 52-week high with today's big volume-driven gain. New pivot point was cited based on its 8/25/22 high plus 10 cents. Subsequent gains above the pivot point backed by at least +40% above average volume may trigger a technical buy signal. Fundamentals remain strong. Due to report Sep '22 quarterly results on 11/04/22. Showed resilience since dropped from the Featured Stocks list on 9/01/22.
>>> FEATURED STOCK ARTICLE : Clearfield Showed Resilience After Considerable Rally - 8/17/2022 |
View all notes |
Set NEW NOTE alert |
Company Profile |
SEC
News |
Chart |
Request a new note
C
A
S
I |
GPK
-
NYSE
Graphic Packaging Hldg
CONSUMER NON-DURABLES - Packaging and Containers
|
$23.12
|
+1.61
7.48% |
$23.15
|
8,451,034
317.83% of 50 DAV
50 DAV is 2,659,000
|
$24.07
-3.95%
|
10/25/2022
|
$22.75
|
PP = $24.17
|
|
MB = $25.38
|
Most Recent Note - 10/25/2022 7:18:22 PM
Y - Finished strong today after highlighted in yellow with pivot point cited based on its 9/12/22 high plus 10 cents in the earlier mid-day report. Subsequent gains above the pivot point backed by at least +40% above average volume may trigger a technical buy signal. Reported Sep '22 quarterly earnings +79% on +38% sales revenues versus the year ago period. Fundamentals have been strong. Today's big gain and rebound above its 50 DMA line ($21.73) helped its outlook improve. It rebounded after sputtering below its 200 DMA line since it was dropped from the Featured Stocks list on 9/20/22. See the latest FSU analysis for more details and a new annotated graph.
>>> FEATURED STOCK ARTICLE : Rebound Above 50-Day Moving Average Helped Outlook Improve - 10/25/2022 |
View all notes |
Set NEW NOTE alert |
Company Profile |
SEC
News |
Chart |
Request a new note
C
A
S
I |
|
|
|
THESE ARE NOT BUY RECOMMENDATIONS!
Comments contained in the body of this report are technical
opinions only. The material herein has been obtained
from sources believed to be reliable and accurate, however,
its accuracy and completeness cannot be guaranteed.
This site is not an investment advisor, hence it does
not endorse or recommend any securities or other investments.
Any recommendation contained in this report may not
be suitable for all investors and it is not to be deemed
an offer or solicitation on our part with respect to
the purchase or sale of any securities. All trademarks,
service marks and trade names appearing in this report
are the property of their respective owners, and are
likewise used for identification purposes only.
This report is a service available
only to active Paid Premium Members.
You may opt-out of receiving report notifications
at any time. Questions or comments may be submitted
by writing to Premium Membership Services 665 S.E. 10 Street, Suite 201 Deerfield Beach, FL 33441-5634 or by calling 1-800-965-8307
or 954-785-1121.
|
|
|