You are not logged in.
This means you
CAN ONLY VIEW reports that were published prior to Sunday, April 6, 2025.
You
MUST UPGRADE YOUR MEMBERSHIP if you want to see any current reports.
AFTER MARKET UPDATE - WEDNESDAY, OCTOBER 26TH, 2022
Previous After Market Report Next After Market Report >>>
|
|
|
|
DOW |
+2.37 |
31,839.11 |
+0.01% |
|
Volume |
1,005,162,008 |
+0% |
|
Volume |
5,184,166,400 |
+1% |
|
NASDAQ |
-228.12 |
10,970.99 |
-2.04% |
|
Advancers |
1,846 |
59% |
|
Advancers |
2,641 |
57% |
|
S&P 500 |
-28.51 |
3,830.60 |
-0.74% |
|
Decliners |
1,271 |
41% |
|
Decliners |
2,031 |
43% |
|
Russell 2000 |
+8.18 |
1,804.33 |
+0.46% |
|
52 Wk Highs |
82 |
|
|
52 Wk Highs |
132 |
|
|
S&P 600 |
+4.07 |
1,167.50 |
+0.35% |
|
52 Wk Lows |
97 |
|
|
52 Wk Lows |
144 |
|
|
 |
Leadership Improved but Major Averages Ended Mixed
Kenneth J. Gruneisen - Passed the CAN SLIM® Master's Exam
The Dow added 2 points, while the Nasdaq Composite declined 2%. The S&P 500 lost 0.7%. The volume totals reported were slightly higher than the prior session on the NYSE and on the Nasdaq exchange. Advancers led decliners by a 3-2 margin on the NYSE and by a 5-4 margin on the Nasdaq exchange. There were 44 high-ranked companies from the Leaders List that hit new 52-week highs and were listed on the BreakOuts Page, versus the total of 34 on the prior session. New 52-week lows totals still slightly outnumbered new 52-week highs totals on both the NYSE and the Nasdaq exchange. The recent follow-through day helped establish a confirmed uptrend (M criteria). Healthy leadership (new 52-week highs totals) will be essential in the near-term for the rally to be productive.
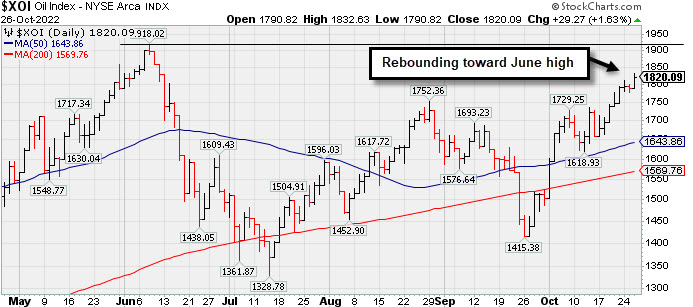
Chart courtesy of www.stockcharts.com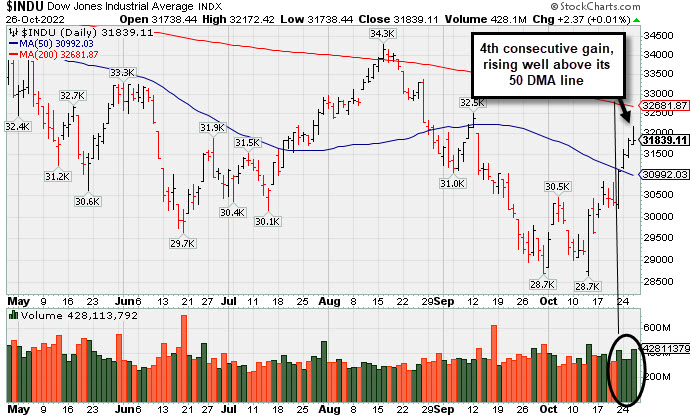 PICTURED: The Dow Jones Industrial Average posted a 4th consecutive gain with higher volume, rising well above its 50-day moving average (DMA) line. Only stocks meeting all key-criteria of the fact-based investment system should be considered as buy candidates.
U.S. equities closed mixed Wednesday after some technology firms’ earnings missed analyst’s expectations. Five of the 11 S&P 500 sectors closed in negative territory, with Communication Services leading laggards.
In Initial Public Offering (IPO) news, Mobileye Global Inc (MBLY +60.94%) spiked higher after it was priced at $21 a share to start their first trading day. After the first offering of Intel Corporation’s automated car-driving unit, the share price surged, becoming one of the highest-profile and largest IPO offerings year-to-date. In earnings, Alphabet (GOOGL -9.1%) fell for its worst trading day since March 2020 after reports showed slowing sales growth and YouTube’s first drop in advertising revenue since the division has been reporting. Meta Platforms Inc (META -5.59%) reported -49% earnings for the Sep '22 quarter versus the year ago period after the market closed.
Treasury yields declined as investors absorbed the possibility of a slowing housing sector. The yield on the benchmark 10-year note lost six basis points (0.06%) to 4.01%, while the 30-year bond yield decreased seven basis points (0.07%) to 4.15%. The more policy-sensitive two-year note yield fell four basis points (0.04%) to 4.42%.
In commodities, West Texas Intermediate (WTI) crude surged 3.27% to $88.11/barrel following reports of the nation’s refiners operating at unusually high levels for this time of year. The Department of Energy’s U.S. Crude oil inventories data showed an increase of 2.6 million barrels for the week ended October 21. The U.S. Dollar Index softened 1.14% amid potential signs the Federal Reserve (Fed) could begin to pivot in December. |
 Kenneth J. Gruneisen started out as a licensed stockbroker in August 1987, a couple of months prior to the historic stock market crash that took the Dow Jones Industrial Average down -22.6% in a single day. He has published daily fact-based fundamental and technical analysis on high-ranked stocks online for two decades. Through FACTBASEDINVESTING.COM, Kenneth provides educational articles, news, market commentary, and other information regarding proven investment systems that work in good times and bad.
Comments contained in the body of this report are technical opinions only and are not necessarily those of Gruneisen Growth Corp. The material herein has been obtained from sources believed to be reliable and accurate, however, its accuracy and completeness cannot be guaranteed. Our firm, employees, and customers may effect transactions, including transactions contrary to any recommendation herein, or have positions in the securities mentioned herein or options with respect thereto. Any recommendation contained in this report may not be suitable for all investors and it is not to be deemed an offer or solicitation on our part with respect to the purchase or sale of any securities. |
|
 |
Retail and Semiconductor Indexes Fell
Kenneth J. Gruneisen - Passed the CAN SLIM® Master's Exam
The Retail Index ($RLX -2.10%) created a drag on the major averages while the Broker/Dealer Index ($XBD +0.38%) and Bank Index ($BKX +0.41%) both edged higher. Commodity-linked groups posted standout gains as the Gold & Silver Index ($XAU +3.14%) and Oil Services Index ($OSX +4.75%) both outpaced the Integrated Oil Index ($XOI +1.63%). The tech sector was mixed as the Biotech Index ($BTK +1.62%) rose while the Networking Index ($NWX -0.05%) finished flat and the Semiconductor Index ($SOX -1.18%) lost ground.
PICTURED: The Integrated Oil Index ($XOI +1.63%) has been rebounding toward its June high.
| Oil Services |
$OSX |
81.86 |
+3.72 |
+4.75% |
+55.28% |
| Integrated Oil |
$XOI |
1,820.09 |
+29.27 |
+1.63% |
+54.48% |
| Semiconductor |
$SOX |
2,376.33 |
-28.36 |
-1.18% |
-39.78% |
| Networking |
$NWX |
819.99 |
-0.37 |
-0.05% |
-15.56% |
| Broker/Dealer |
$XBD |
446.42 |
+1.71 |
+0.38% |
-8.31% |
| Retail |
$RLX |
3,109.92 |
-66.74 |
-2.10% |
-26.42% |
| Gold & Silver |
$XAU |
107.12 |
+3.26 |
+3.14% |
-19.12% |
| Bank |
$BKX |
102.73 |
+0.42 |
+0.41% |
-22.30% |
| Biotech |
$BTK |
4,898.41 |
+77.93 |
+1.62% |
-11.24% |
|
|
|
 |
Earnings Report Due for Commercial Services and Consulting Firm
Kenneth J. Gruneisen - Passed the CAN SLIM® Master's Exam
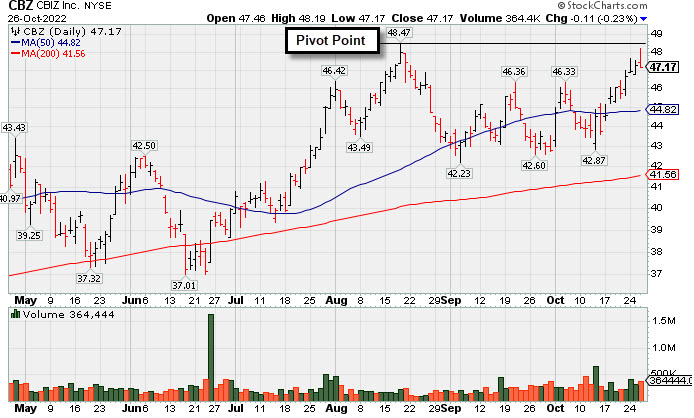
C B I Z Inc (CBZ -$0.11 or -0.23% to $47.17) made a "negative reversal" today after challenging its 52-week high and it closed near the session low after highlighted in yellow in the earlier mid-day report (read here) with pivot point cited based on it 8/18/22 high plus 10 cents. It is perched within close striking distance of its 52-week high after rebounding above its 50-day moving average (DMA) line ($44.82) with recent volume-driven gains. Members were cautioned - "Due to report Sep '22 quarterly results. Volume and volatility often increase near earnings news."
The Comml Svcs-Consulting firm has a 95 Earnings Per Share Rating. It reported earnings +26% on +30% sales revenues for the Jun '22 quarter versus the year ago period, its 2nd strong quarter above the +25% minimum earnings guideline (C criteria). Annual earnings (A criteria) history has been strong.
The number of top-rated funds owning its shares rose from 361 in Dec '21 to 371 in Sep '22. Its current Up/Down Volume Ratio of 0.9 is an unbiased indication its shares have been under slight distributional pressure over the past 50 days. There are only 51.3 million shares outstanding (S criteria) which can contribute to greater volatility in the event of institutional buying or selling. It has an A Timeliness Rating and a C Sponsorship Rating.
|
|
|
Color Codes Explained :
Y - Better candidates highlighted by our
staff of experts.
G - Previously featured
in past reports as yellow but may no longer be buyable under the
guidelines.
***Last / Change / Volume data in this table is the closing quote data***
Symbol/Exchange
Company Name
Industry Group |
PRICE |
CHANGE
(%Change) |
Day High |
Volume
(% DAV)
(% 50 day avg vol) |
52 Wk Hi
% From Hi |
Featured
Date |
Price
Featured |
Pivot Featured |
|
Max Buy |
 CI
-
NYSE
CI
-
NYSE
Cigna Corp
Medical-Managed Care
|
$314.95
|
+4.03
1.30% |
$317.73
|
1,636,833
85.25% of 50 DAV
50 DAV is 1,920,000
|
$311.61
1.07%
|
7/7/2022
|
$276.55
|
PP = $273.68
|
|
MB = $287.36
|
Most Recent Note - 10/25/2022 7:11:39 PM
G - Posted a 4th consecutive gain today with below average volume for a new all-tie high. Its 50 DMA line ($289) defines near-term support to watch above the recent low ($283.79 on 10/10/22). Fundamental concerns also remain after the Jun '22 quarter rose +19% on +5% sales revenues versus the year ago period, breaking a streak of 3 quarterly earnings increases above the +25% minimum guideline (C criteria).
>>> FEATURED STOCK ARTICLE : No Resistance Remains Due to Overhead Supply - 10/4/2022 |
View all notes |
Set NEW NOTE alert |
Company Profile |
SEC
News |
Chart |
Request a new note
C
A
S
I |
ESQ
-
NASDAQ
Esquire Financial Hldgs
Finance-Commercial Loans
|
$42.90
|
+1.10
2.63% |
$44.70
|
62,044
229.79% of 50 DAV
50 DAV is 27,000
|
$42.82
0.20%
|
10/18/2022
|
$40.02
|
PP = $39.95
|
|
MB = $41.95
|
 Most Recent Note - 10/26/2022 1:00:14 PM
G - Hit another new 52-week high with today's 3rd consecutive volume-driven gain and its color code is changed to green after rising above its "max buy". level. Prior highs in the $41 area define initial support to watch on pullbacks.
>>> FEATURED STOCK ARTICLE : Rebound Above 50-Day Moving Average Needed for Outlook to Improve - 10/7/2022 |
View all notes |
Set NEW NOTE alert |
Company Profile |
SEC
News |
Chart |
Request a new note
C
A
S
I |
CCRN
-
NASDAQ
Cross Country Healthcare
DIVERSIFIED SERVICES - Staffing and Outsourcing Service
|
$36.36
|
+0.26
0.72% |
$38.17
|
859,556
95.61% of 50 DAV
50 DAV is 899,000
|
$38.46
-5.46%
|
9/9/2022
|
$27.32
|
PP = $30.61
|
|
MB = $32.14
|
Most Recent Note - 10/25/2022 7:10:44 PM
G - Pulled back today with near average volume after rallying to a new 52-week high on the prior session with higher volume. Prior highs in the $30.50 area define initial support to watch above its 50 DMA line ($28.86).
>>> FEATURED STOCK ARTICLE : Healthcare Staffing Firm Hovering Near All-Time High - 10/17/2022 |
View all notes |
Set NEW NOTE alert |
Company Profile |
SEC
News |
Chart |
Request a new note
C
A
S
I |
CMC
-
NYSE
Commercial Metals Co
METALS and MINING - Steel and Iron
|
$45.13
|
+0.66
1.48% |
$45.71
|
1,564,246
157.53% of 50 DAV
50 DAV is 993,000
|
$46.68
-3.32%
|
10/14/2022
|
$41.61
|
PP = $44.45
|
|
MB = $46.67
|
Most Recent Note - 10/26/2022 5:48:18 PM
Y - Posted a 5th consecutive small gain today with above average volume, inching further above the pivot point. Faces very little resistance due to overhead supply up to the $46 level. Reported Aug '22 quarterly earnings +94% on +19% sales revenues versus the year ago period and prior quarterly comparisons were well above the +25% minimum earnings guideline (C criteria) of the fact-based investment system. Annual earnings growth has been strong.
>>> FEATURED STOCK ARTICLE : Little Resistance Remains for Strong Steel/Metal Products Firm - 10/14/2022 |
View all notes |
Set NEW NOTE alert |
Company Profile |
SEC
News |
Chart |
Request a new note
C
A
S
I |
VRTX
-
NASDAQ
Vertex Pharmaceuticals
Medical-Biomed/Biotech
|
$311.18
|
+1.97
0.64% |
$316.48
|
1,263,987
99.21% of 50 DAV
50 DAV is 1,274,000
|
$315.37
-1.33%
|
10/24/2022
|
$308.47
|
PP = $306.05
|
|
MB = $321.35
|
Most Recent Note - 10/25/2022 7:19:50 PM
Y - There was a "negative reversal" today after early gains. Highlighted in yellow with pivot point cited based on its 8/15/22 high pus 10 cents in the 10/24/22 mid-day report. Hit a new 52-week high as its gain above the pivot point was backed +58% above average volume triggering a proper technical buy signal. Reported greatly improved earnings on +22% sales revenues for the Jun '22 quarter versus the year-ago period, and 3 of the past 4 quarterly comparisons were above the +25% minimum earnings guideline (C criteria). Annual earnings (A criteria) history has been strong. See the latest FS analysis for more details and an annotated graph.
>>> FEATURED STOCK ARTICLE : Volume-Driven Gain Triggered Technical Buy Signal - 10/24/2022 |
View all notes |
Set NEW NOTE alert |
Company Profile |
SEC
News |
Chart |
Request a new note
C
A
S
I |
Symbol/Exchange
Company Name
Industry Group |
PRICE |
CHANGE
(%Change) |
Day High |
Volume
(% DAV)
(% 50 day avg vol) |
52 Wk Hi
% From Hi |
Featured
Date |
Price
Featured |
Pivot Featured |
|
Max Buy |
CLFD
-
NASDAQ
Clearfield Inc
TELECOMMUNICATIONS - Cables / Satalite Equipment
|
$119.85
|
+1.25
1.05% |
$121.70
|
295,953
122.29% of 50 DAV
50 DAV is 242,000
|
$130.01
-7.81%
|
10/25/2022
|
$117.96
|
PP = $130.11
|
|
MB = $136.62
|
Most Recent Note - 10/25/2022 7:12:42 PM
Y - Rallied toward its 52-week high with today's big volume-driven gain. New pivot point was cited based on its 8/25/22 high plus 10 cents. Subsequent gains above the pivot point backed by at least +40% above average volume may trigger a technical buy signal. Fundamentals remain strong. Due to report Sep '22 quarterly results on 11/04/22. Showed resilience since dropped from the Featured Stocks list on 9/01/22.
>>> FEATURED STOCK ARTICLE : Clearfield Showed Resilience After Considerable Rally - 8/17/2022 |
View all notes |
Set NEW NOTE alert |
Company Profile |
SEC
News |
Chart |
Request a new note
C
A
S
I |
GPK
-
NYSE
Graphic Packaging Hldg
CONSUMER NON-DURABLES - Packaging and Containers
|
$23.42
|
+0.30
1.30% |
$23.88
|
5,553,574
205.00% of 50 DAV
50 DAV is 2,709,000
|
$24.07
-2.70%
|
10/25/2022
|
$22.75
|
PP = $24.17
|
|
MB = $25.38
|
Most Recent Note - 10/26/2022 1:07:33 PM
Y - Challenging its 52-week high with today's 4th consecutive volume-driven gain. Finished strong after highlighted in yellow in the prior mid-day report with pivot point cited based on its 9/12/22 high plus 10 cents. Subsequent gains above the pivot point backed by at least +40% above average volume may trigger a technical buy signal. Reported Sep '22 quarterly earnings +79% on +38% sales revenues versus the year ago period. Fundamentals have been strong. Big gain and rebound above its 50 DMA line ($21.73) helped its outlook improve. Rebounded after sputtering below its 200 DMA line since dropped from the Featured Stocks list on 9/20/22. See the latest FSU analysis for more details and an annotated graph.
>>> FEATURED STOCK ARTICLE : Rebound Above 50-Day Moving Average Helped Outlook Improve - 10/25/2022 |
View all notes |
Set NEW NOTE alert |
Company Profile |
SEC
News |
Chart |
Request a new note
C
A
S
I |
CBZ
-
NYSE
C B I Z Inc
Comml Svcs-Consulting
|
$47.17
|
-0.11
-0.23% |
$48.19
|
364,444
155.08% of 50 DAV
50 DAV is 235,000
|
$48.47
-2.68%
|
10/26/2022
|
$47.83
|
PP = $48.57
|
|
MB = $51.00
|
Most Recent Note - 10/26/2022 5:31:05 PM
Y - There was a "negative reversal" today after challenging its 52-week high and it closed near the session low after highlighted in yellow in the earlier mid-day report with pivot point cited based on it 8/18/22 high plus 10 cents. Rebounded above its 50 DMA line ($44.82) with recent volume-driven gains. Due to report Sep '22 quarterly results. Volume and volatility often increase near earnings news. Reported earnings +26% on +30% sales revenues for the Jun '22 quarter versus the year ago period, its 2nd strong quarter above the +25% minimum earnings guideline (C criteria). Annual earnings history has been strong and it has a 94 Earnings Per Share Rating. See the latest FSU analysis for more details and a new annotated graph.
>>> FEATURED STOCK ARTICLE : Earnings Report Due for Commercial Services and Consulting Firm - 10/26/2022 |
View all notes |
Set NEW NOTE alert |
Company Profile |
SEC
News |
Chart |
Request a new note
C
A
S
I |
ENPH
-
NASDAQ
Enphase Energy Inc
Energy-Solar
|
$291.87
|
+26.28
9.89% |
$303.97
|
9,523,576
259.07% of 50 DAV
50 DAV is 3,676,000
|
$324.84
-10.15%
|
10/26/2022
|
$301.55
|
PP = $324.94
|
|
MB = $341.19
|
Most Recent Note - 10/26/2022 5:50:11 PM
Y - Finished near the middle of its intra-day range after highlighted in yellow in the earlier mid-day report with new pivot point cited based on its 9/08/22 high plus 10 cents. Gapped up today rebounding above its 50 DMA line ($281.43) helping its outlook improve. Faces some resistance due to overhead supply up to the $324 level. Reported Sep '22 quarterly earnings +108% on +81% sales revenues versus the year ago period, continuing its strong earnings history above the +25% minimum guideline (C criteria). Showed resilience since dropped from the Featured Stocks list on 10/05/22.
>>> FEATURED STOCK ARTICLE : Found Support After Undercutting 50 DMA and Prior Low - 9/27/2022 |
View all notes |
Set NEW NOTE alert |
Company Profile |
SEC
News |
Chart |
Request a new note
C
A
S
I |
|
|
|
THESE ARE NOT BUY RECOMMENDATIONS!
Comments contained in the body of this report are technical
opinions only. The material herein has been obtained
from sources believed to be reliable and accurate, however,
its accuracy and completeness cannot be guaranteed.
This site is not an investment advisor, hence it does
not endorse or recommend any securities or other investments.
Any recommendation contained in this report may not
be suitable for all investors and it is not to be deemed
an offer or solicitation on our part with respect to
the purchase or sale of any securities. All trademarks,
service marks and trade names appearing in this report
are the property of their respective owners, and are
likewise used for identification purposes only.
This report is a service available
only to active Paid Premium Members.
You may opt-out of receiving report notifications
at any time. Questions or comments may be submitted
by writing to Premium Membership Services 665 S.E. 10 Street, Suite 201 Deerfield Beach, FL 33441-5634 or by calling 1-800-965-8307
or 954-785-1121.
|
|
|