You are not logged in.
This means you
CAN ONLY VIEW reports that were published prior to Saturday, April 5, 2025.
You
MUST UPGRADE YOUR MEMBERSHIP if you want to see any current reports.
AFTER MARKET UPDATE - FRIDAY, OCTOBER 28TH, 2022
Previous After Market Report Next After Market Report >>>
|
|
|
|
DOW |
+828.52 |
32,861.80 |
+2.59% |
|
Volume |
913,443,512 |
-11% |
|
Volume |
4,680,446,900 |
-1% |
|
NASDAQ |
+309.78 |
11,102.45 |
+2.87% |
|
Advancers |
2,314 |
76% |
|
Advancers |
3,060 |
67% |
|
S&P 500 |
+93.76 |
3,901.06 |
+2.46% |
|
Decliners |
722 |
24% |
|
Decliners |
1,522 |
33% |
|
Russell 2000 |
+40.60 |
1,846.92 |
+2.25% |
|
52 Wk Highs |
89 |
|
|
52 Wk Highs |
121 |
|
|
S&P 600 |
+25.27 |
1,196.85 |
+2.16% |
|
52 Wk Lows |
113 |
|
|
52 Wk Lows |
196 |
|
|
 |
Major Averages Extend Rally With Tech and Financial Strength
Kenneth J. Gruneisen - Passed the CAN SLIM® Master's Exam
The Dow added 828 points and finished the week 5.7% higher. The blue-chip index notched its longest weekly winning streak since November 2021. The Nasdaq Composite advanced 2.9% to notch a 2.2% weekly gain. The S&P 500 jumped 2.5% and closed the week up 4%. The volume totals reported were lighter than the prior session on the NYSE and on the Nasdaq exchange, revealing less institutional buying demand. Breadth was solidly positive as advancers led decliners by more than a 3-1 margin on the NYSE and by a 2-1 margin on the Nasdaq exchange. Leadership improved as there were 60 high-ranked companies from the Leaders List that hit new 52-week highs and were listed on the BreakOuts Page, versus the total of 45 on the prior session. New 52-week lows totals still outnumbered new 52-week highs totals on both the NYSE and the Nasdaq exchange. The recent follow-through day helped establish a confirmed uptrend (M criteria). Healthy leadership (new 52-week highs totals) will be essential in the near-term for the rally to be productive. Only stocks meeting all key-criteria of the fact-based investment system should be considered as buy candidates.
Chart courtesy of www.stockcharts.com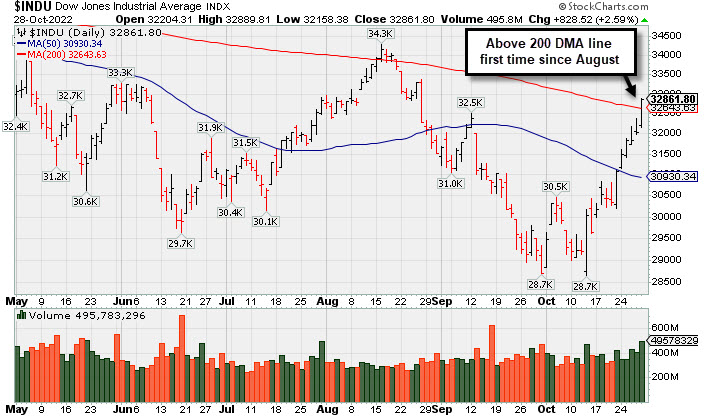 PICTURED: The Dow Jones Industrial Average posted a 6th consecutive gain with higher volume and rose above its 200-day moving average (DMA) line for the first time since August.
U.S. equities finished higher Friday as investors shook off the impact of weaker-than-expected earnings from Technology giants. Stocks were whipsawed this week as Wall Street digested a slew of economic and consumer data and third-quarter earnings. Amazon.com Inc (AMZN -6.80%) fell after missing revenue estimates and slashed their fourth-quarter sales outlook. Intel Corp. (INTC +10.66%) rose after surpassing earnings estimates and introducing a cost-cutting plan. Apple Inc (AAPL +7.56%) rose after beating top and bottom line estimates, but reported iPhone sales missed forecasts. On the data front today, personal income and personal spending both rose in September, indicating consumer resilience in the face of soaring inflation. Meanwhile, the Core PCE Deflator (the Fed’s preferred proxy for inflation) accelerated in September while pending home sales declined 10.2%.
Treasuries yields climbed, with the yield on the 10-year note climbing 10 basis points (0.10%) to 4.00%, while the 30-year bond yield rose seven basis points (0.07%) to 4.13% The yield on the two-year note advanced 12 basis points (0.12%) to 4.41%. Despite today’s moves, Treasuries strengthened this week, with the yields on the 10-year note and 30-year bond down 22 basis points (0.22%) and 20 basis points (0.20%), respectively. The two-year note yield shed seven basis points (0.07%) this week. In commodities, West Texas Intermediate (WTI) crude fell 1% to $88.17/barrel, but notched a 3.7% weekly gain as tight supply conditions outweighed demand concerns. |
 Kenneth J. Gruneisen started out as a licensed stockbroker in August 1987, a couple of months prior to the historic stock market crash that took the Dow Jones Industrial Average down -22.6% in a single day. He has published daily fact-based fundamental and technical analysis on high-ranked stocks online for two decades. Through FACTBASEDINVESTING.COM, Kenneth provides educational articles, news, market commentary, and other information regarding proven investment systems that work in good times and bad.
Comments contained in the body of this report are technical opinions only and are not necessarily those of Gruneisen Growth Corp. The material herein has been obtained from sources believed to be reliable and accurate, however, its accuracy and completeness cannot be guaranteed. Our firm, employees, and customers may effect transactions, including transactions contrary to any recommendation herein, or have positions in the securities mentioned herein or options with respect thereto. Any recommendation contained in this report may not be suitable for all investors and it is not to be deemed an offer or solicitation on our part with respect to the purchase or sale of any securities. |
|
 |
Financial and Tech Indexes Rallied
Kenneth J. Gruneisen - Passed the CAN SLIM® Master's Exam
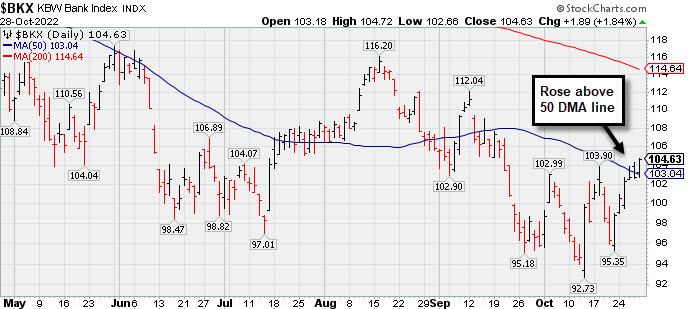
The Broker/Dealer Index ($XBD +2.48%) and Bank Index ($BKX +1.84%) both posted influential gains on Friday while the Retail Index ($RLX -2.39%) lost ground and created a drag on the major averages. The tech sector had a positive bias as the Semiconductor Index ($SOX +3.98%), Networking Index ($NWX +2.86%), and Biotech Index ($BTK +2.76%) all posted solid gains. The Gold & Silver Index ($XAU -0.73%) and Oil Services Index ($OSX -1.12%) both lost ground while the Integrated Oil Index ($XOI +0.23%) inched higher.
PICTURED: The Bank Index ($BKX +1.84%) rebounded above its 50-day moving average (DMA) line. The improvement is a reassuring sign because the financial indexes have been reliable leading indicators.
| Oil Services |
$OSX |
80.72 |
-0.91 |
-1.12% |
+53.11% |
| Integrated Oil |
$XOI |
1,831.08 |
+4.17 |
+0.23% |
+55.41% |
| Semiconductor |
$SOX |
2,433.66 |
+93.06 |
+3.98% |
-38.33% |
| Networking |
$NWX |
845.46 |
+23.48 |
+2.86% |
-12.94% |
| Broker/Dealer |
$XBD |
464.42 |
+11.23 |
+2.48% |
-4.61% |
| Retail |
$RLX |
2,986.70 |
-73.15 |
-2.39% |
-29.33% |
| Gold & Silver |
$XAU |
104.88 |
-0.77 |
-0.73% |
-20.82% |
| Bank |
$BKX |
104.63 |
+1.89 |
+1.84% |
-20.87% |
| Biotech |
$BTK |
4,939.92 |
+132.53 |
+2.76% |
-10.48% |
|
|
|
 |
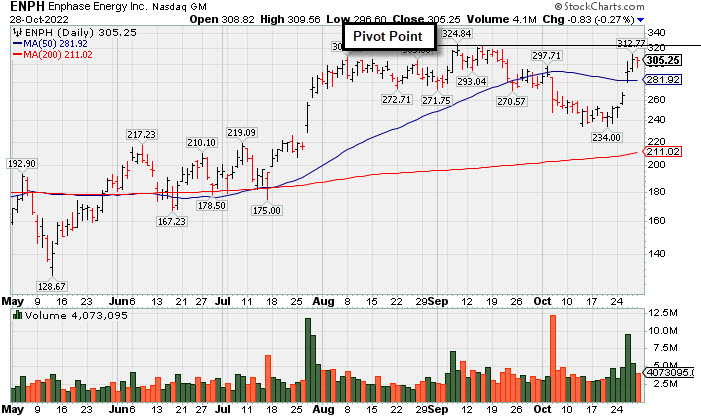
Enphase Energy Rebound Above 50-Day Moving Average Helped Outlook
Kenneth J. Gruneisen - Passed the CAN SLIM® Master's Exam
Enphase Energy Inc (ENPH -$0.83 or -0.27% to $305.25) paused today after 6 consecutive volume-driven gains. It was highlighted in yellow in the 10/26/22 mid-day report with new pivot point cited based on its 9/08/22 high plus 10 cents (read here). This week's rebound above its 50-day moving average (DMA) line ($281.92) helped its outlook improve. It faces little resistance due to overhead supply up to the $324 level.
It has shown resilience since dropped from the Featured Stocks list on 10/05/22.It was last shown with an annotated graph on 9/27/22 under the headline, "Found Support After Undercutting 50 DMA and Prior Low". It has an Earnings Per Share Rating of 99. It reported Sep '22 quarterly earnings +108% on +81% sales revenues versus the year ago period, continuing its strong earnings history above the +25% minimum guideline (C criteria). It has a strong annual earnings (A criteria) history since FY '18 after years of losses.
The company hails from the Energy-Solar group which is currently ranked 2nd of the 197 Industry Groups (L criteria). The number of top-rated funds owning its shares rose from 1,068 in Dec '20 to 2,017 in Sep '22, a reassuring sign concerning the I criteria. Its current Up/Down Volume Ratio of 1.1 is an unbiased indication its shares have been under slight accumulation over the past 50 days.
|
|
|
Color Codes Explained :
Y - Better candidates highlighted by our
staff of experts.
G - Previously featured
in past reports as yellow but may no longer be buyable under the
guidelines.
***Last / Change / Volume data in this table is the closing quote data***
Symbol/Exchange
Company Name
Industry Group |
PRICE |
CHANGE
(%Change) |
Day High |
Volume
(% DAV)
(% 50 day avg vol) |
52 Wk Hi
% From Hi |
Featured
Date |
Price
Featured |
Pivot Featured |
|
Max Buy |
 CI
-
NYSE
CI
-
NYSE
Cigna Corp
Medical-Managed Care
|
$324.76
|
+8.18
2.58% |
$325.16
|
1,372,647
71.05% of 50 DAV
50 DAV is 1,932,000
|
$319.50
1.65%
|
7/7/2022
|
$276.55
|
PP = $273.68
|
|
MB = $287.36
|
Most Recent Note - 10/27/2022 5:25:48 PM
G - Posted a 6th consecutive gain today with below average volume for yet another new all-time high. Its 50 DMA line ($290) defines near-term support to watch above the recent low ($283.79 on 10/10/22). Due to report Sep '22 quarterly results on 11/03/22. Volume and volatility often increase near earnings news.
>>> FEATURED STOCK ARTICLE : No Resistance Remains Due to Overhead Supply - 10/4/2022 |
View all notes |
Set NEW NOTE alert |
Company Profile |
SEC
News |
Chart |
Request a new note
C
A
S
I |
ESQ
-
NASDAQ
Esquire Financial Hldgs
Finance-Commercial Loans
|
$44.14
|
+1.17
2.72% |
$45.01
|
51,780
199.15% of 50 DAV
50 DAV is 26,000
|
$44.70
-1.25%
|
10/18/2022
|
$40.02
|
PP = $39.95
|
|
MB = $41.95
|
 Most Recent Note - 10/28/2022 5:38:39 PM
G - Hit another new 52-week high with today's 5th consecutive volume-driven gain, getting extended from the previously noted base. Prior highs in the $41 area define initial support to watch on pullbacks.
>>> FEATURED STOCK ARTICLE : Rebound Above 50-Day Moving Average Needed for Outlook to Improve - 10/7/2022 |
View all notes |
Set NEW NOTE alert |
Company Profile |
SEC
News |
Chart |
Request a new note
C
A
S
I |
CCRN
-
NASDAQ
Cross Country Healthcare
DIVERSIFIED SERVICES - Staffing and Outsourcing Service
|
$38.10
|
+1.70
4.67% |
$38.46
|
768,845
88.37% of 50 DAV
50 DAV is 870,000
|
$38.47
-0.96%
|
9/9/2022
|
$27.32
|
PP = $30.61
|
|
MB = $32.14
|
Most Recent Note - 10/28/2022 5:41:37 PM
G - Posted a 3rd consecutive gain today for a best-ever close, getting more extended from the previously noted base. Prior highs in the $30.50 area define initial support to watch above its 50 DMA line ($29.70).
>>> FEATURED STOCK ARTICLE : Healthcare Staffing Firm Hovering Near All-Time High - 10/17/2022 |
View all notes |
Set NEW NOTE alert |
Company Profile |
SEC
News |
Chart |
Request a new note
C
A
S
I |
CMC
-
NYSE
Commercial Metals Co
METALS and MINING - Steel and Iron
|
$44.59
|
+0.21
0.47% |
$44.84
|
1,065,564
105.09% of 50 DAV
50 DAV is 1,014,000
|
$46.68
-4.48%
|
10/14/2022
|
$41.61
|
PP = $44.45
|
|
MB = $46.67
|
Most Recent Note - 10/26/2022 5:48:18 PM
Y - Posted a 5th consecutive small gain today with above average volume, inching further above the pivot point. Faces very little resistance due to overhead supply up to the $46 level. Reported Aug '22 quarterly earnings +94% on +19% sales revenues versus the year ago period and prior quarterly comparisons were well above the +25% minimum earnings guideline (C criteria) of the fact-based investment system. Annual earnings growth has been strong.
>>> FEATURED STOCK ARTICLE : Little Resistance Remains for Strong Steel/Metal Products Firm - 10/14/2022 |
View all notes |
Set NEW NOTE alert |
Company Profile |
SEC
News |
Chart |
Request a new note
C
A
S
I |
VRTX
-
NASDAQ
Vertex Pharmaceuticals
Medical-Biomed/Biotech
|
$313.89
|
+26.00
9.03% |
$314.49
|
3,258,267
242.97% of 50 DAV
50 DAV is 1,341,000
|
$316.48
-0.82%
|
10/24/2022
|
$308.47
|
PP = $306.05
|
|
MB = $321.35
|
Most Recent Note - 10/28/2022 1:43:46 PM
Y - Color code is changed to yellow after quickly rebounding above its 50 DMA line and back above its pivot point with today's big volume-driven gain. Reported Sep '22 quarterly earnings +14% on +18% sales revenues versus the year ago period, below the +25% minimum earnings guideline raising concerns (C criteria). Annual earnings (A criteria) history has been strong.
>>> FEATURED STOCK ARTICLE : Volume-Driven Gain Triggered Technical Buy Signal - 10/24/2022 |
View all notes |
Set NEW NOTE alert |
Company Profile |
SEC
News |
Chart |
Request a new note
C
A
S
I |
Symbol/Exchange
Company Name
Industry Group |
PRICE |
CHANGE
(%Change) |
Day High |
Volume
(% DAV)
(% 50 day avg vol) |
52 Wk Hi
% From Hi |
Featured
Date |
Price
Featured |
Pivot Featured |
|
Max Buy |
CLFD
-
NASDAQ
Clearfield Inc
TELECOMMUNICATIONS - Cables / Satalite Equipment
|
$122.62
|
+3.81
3.21% |
$123.72
|
239,526
99.39% of 50 DAV
50 DAV is 241,000
|
$130.01
-5.68%
|
10/25/2022
|
$117.96
|
PP = $130.11
|
|
MB = $136.62
|
Most Recent Note - 10/28/2022 5:40:15 PM
Y - Posted another gain today with average volume, rising toward its 52-week high. New pivot point was cited based on its 8/25/22 high plus 10 cents. Subsequent gains above the pivot point backed by at least +40% above average volume may trigger a technical buy signal. Fundamentals remain strong. Due to report Sep '22 quarterly results on 11/04/22. Showed resilience since dropped from the Featured Stocks list on 9/01/22. See the latest FSU analysis for more details and an annotated graph.
>>> FEATURED STOCK ARTICLE : Clearfield Perched -8.6% Off High After Recent Rebound - 10/27/2022 |
View all notes |
Set NEW NOTE alert |
Company Profile |
SEC
News |
Chart |
Request a new note
C
A
S
I |
GPK
-
NYSE
Graphic Packaging Hldg
CONSUMER NON-DURABLES - Packaging and Containers
|
$23.03
|
-0.02
-0.09% |
$23.32
|
3,983,858
142.94% of 50 DAV
50 DAV is 2,787,000
|
$24.07
-4.32%
|
10/25/2022
|
$22.75
|
PP = $24.17
|
|
MB = $25.38
|
Most Recent Note - 10/26/2022 1:07:33 PM
Y - Challenging its 52-week high with today's 4th consecutive volume-driven gain. Finished strong after highlighted in yellow in the prior mid-day report with pivot point cited based on its 9/12/22 high plus 10 cents. Subsequent gains above the pivot point backed by at least +40% above average volume may trigger a technical buy signal. Reported Sep '22 quarterly earnings +79% on +38% sales revenues versus the year ago period. Fundamentals have been strong. Big gain and rebound above its 50 DMA line ($21.73) helped its outlook improve. Rebounded after sputtering below its 200 DMA line since dropped from the Featured Stocks list on 9/20/22. See the latest FSU analysis for more details and an annotated graph.
>>> FEATURED STOCK ARTICLE : Rebound Above 50-Day Moving Average Helped Outlook Improve - 10/25/2022 |
View all notes |
Set NEW NOTE alert |
Company Profile |
SEC
News |
Chart |
Request a new note
C
A
S
I |
CBZ
-
NYSE
C B I Z Inc
Comml Svcs-Consulting
|
$50.02
|
+1.22
2.50% |
$50.27
|
319,143
130.26% of 50 DAV
50 DAV is 245,000
|
$49.62
0.81%
|
10/26/2022
|
$47.83
|
PP = $48.57
|
|
MB = $51.00
|
Most Recent Note - 10/27/2022 5:21:27 PM
Y - Hit a new 52-week high today with a gain above its pivot point backed by +87% above average volume triggering a technical buy signal. Reported Sep '22 quarterly earnings +24% on +28% sales revenues versus the year ago period. Volume and volatility often increase near earnings news. Earnings rose +26% on +30% sales revenues for the Jun '22 quarter versus the year ago period. Annual earnings history has been strong and it has a 94 Earnings Per Share Rating. See the latest FSU analysis for more details and an annotated graph.
>>> FEATURED STOCK ARTICLE : Earnings Report Due for Commercial Services and Consulting Firm - 10/26/2022 |
View all notes |
Set NEW NOTE alert |
Company Profile |
SEC
News |
Chart |
Request a new note
C
A
S
I |
ENPH
-
NASDAQ
Enphase Energy Inc
Energy-Solar
|
$305.25
|
-0.83
-0.27% |
$309.56
|
4,073,091
105.41% of 50 DAV
50 DAV is 3,864,000
|
$324.84
-6.03%
|
10/26/2022
|
$301.55
|
PP = $324.94
|
|
MB = $341.19
|
Most Recent Note - 10/28/2022 5:21:59 PM
Y - Paused today after 6 consecutive volume-driven gains. Highlighted in yellow in the 10/26/22 mid-day report with new pivot point cited based on its 9/08/22 high plus 10 cents. Rebound above its 50 DMA line ($281.92) helped its outlook improve. Faces little resistance due to overhead supply up to the $324 level. Reported Sep '22 quarterly earnings +108% on +81% sales revenues versus the year ago period, continuing its strong earnings history above the +25% minimum guideline (C criteria). See the latest FSU analysis for more details and an annotated graph.
>>> FEATURED STOCK ARTICLE : Enphase Energy Rebound Above 50-Day Moving Average Helped Outlook - 10/28/2022 |
View all notes |
Set NEW NOTE alert |
Company Profile |
SEC
News |
Chart |
Request a new note
C
A
S
I |
|
|
|
THESE ARE NOT BUY RECOMMENDATIONS!
Comments contained in the body of this report are technical
opinions only. The material herein has been obtained
from sources believed to be reliable and accurate, however,
its accuracy and completeness cannot be guaranteed.
This site is not an investment advisor, hence it does
not endorse or recommend any securities or other investments.
Any recommendation contained in this report may not
be suitable for all investors and it is not to be deemed
an offer or solicitation on our part with respect to
the purchase or sale of any securities. All trademarks,
service marks and trade names appearing in this report
are the property of their respective owners, and are
likewise used for identification purposes only.
This report is a service available
only to active Paid Premium Members.
You may opt-out of receiving report notifications
at any time. Questions or comments may be submitted
by writing to Premium Membership Services 665 S.E. 10 Street, Suite 201 Deerfield Beach, FL 33441-5634 or by calling 1-800-965-8307
or 954-785-1121.
|
|
|