You are not logged in.
This means you
CAN ONLY VIEW reports that were published prior to Wednesday, April 23, 2025.
You
MUST UPGRADE YOUR MEMBERSHIP if you want to see any current reports.
AFTER MARKET UPDATE - WEDNESDAY, OCTOBER 28TH, 2015
Previous After Market Report Next After Market Report >>>
|
|
|
|
DOW |
+198.09 |
17,779.52 |
+1.13% |
|
Volume |
983,924,600 |
+1% |
|
Volume |
1,957,571,270 |
+10% |
|
NASDAQ |
+65.54 |
5,095.69 |
+1.30% |
|
Advancers |
2,423 |
79% |
|
Advancers |
2,409 |
79% |
|
S&P 500 |
+24.46 |
2,090.35 |
+1.18% |
|
Decliners |
652 |
21% |
|
Decliners |
627 |
21% |
|
Russell 2000 |
+33.43 |
1,178.72 |
+2.92% |
|
52 Wk Highs |
100 |
|
|
52 Wk Highs |
134 |
|
|
S&P 600 |
+18.72 |
698.55 |
+2.75% |
|
52 Wk Lows |
54 |
|
|
52 Wk Lows |
86 |
|
|
 |
Breadth Positive and Volume Higher as Major Averages Rallied
Kenneth J. Gruneisen - Passed the CAN SLIM® Master's Exam
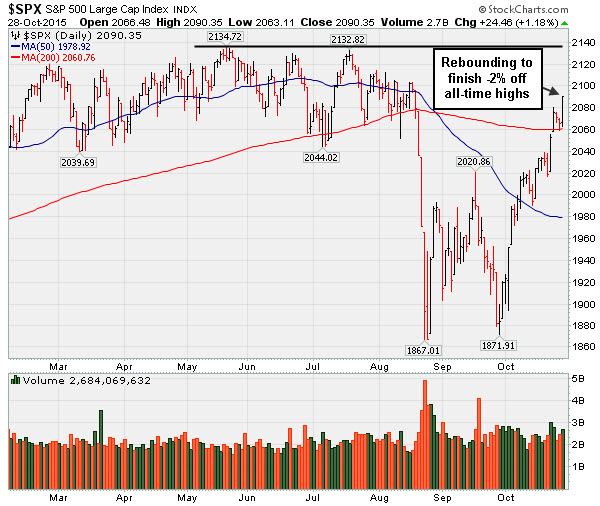
Stocks finished higher on Wednesday. The Dow gained 198 points to 17779. The S&P 500 added 24 points to 2090. The NASDAQ was up 65 points to 5095. Volume totals were reported higher on the NYSE and on the Nasdaq exchange, a reassuring sign of institutional buying demand on the rise again. Breadth was solidly positive as advancers led decliners by nearly a 4-1 margin on the NYSE and on the Nasdaq exchange. Leadership expanded as there were 86 stocks that made it onto the BreakOuts Page, up from the prior session total of 23 high-ranked companies from the Leaders List that made a new 52-week high. The new 52-week highs outnumbered new 52-week lows on the NYSE and on the Nasdaq exchange. There were gains for all 8 high-ranked companies currently on the Featured Stocks Page.
PICTURED: The S&P 500 Index rallied further above its 200-day moving average (DMA) line, finishing -2% off its all-time high.
The major indices have established a confirmed uptrend (M criteria). Coupled with a reassuring expansion in leadership (stocks hitting new 52-week highs) last Friday's big gains helped the S&P 500 Index, Dow Jones Industrial Average, and Nasdaq Composite Index unanimously rally above their respective 200-day moving average lines. The market environment is technically in healthier shape. New buying efforts may be considered in stocks meeting all key criteria, and some new candidates have met the strict guidelines of the fact-based investment system in the recent recovery.
The major averages advanced after the Federal Reserve left interest rates unchanged in their October policy meeting. The Fed’s statement indicated that the committee was prepared to hike rates as soon as the December meeting amid continued “moderate” economic growth in the U.S. In light of this news, futures markets are now pricing in a 46.2% change of a December increase, up from 32.8% yesterday.
In earnings, Apple (AAPL +4.12%) rose after slightly exceeding analyst profit and revenue expectations. In M&A, Walgreens Boots Alliance (WBA -10.73%) fell on news that the company would acquire Rite Aid (RAD -7.04%) for $9.4 billion. Diamond Foods (DMND +8.91%) jumped after agreeing to a takeover offer from Snyders-Lance (LNCE -7.84%).
Eight out of ten sectors in the S&P 500 finished higher on the session. Financials gained on the expectation of higher rates while energy stocks were propelled by a spike in oil prices.
Treasuries softened after the Fed release. The benchmark U.S. 10-year note fell 15/32 to yield 2.09%. Commodities were mostly higher. WTI crude surged 6.3% to $45.91/barrel. COMEX gold added 0.9% to $1177.10/ounce. The dollar index jumped against the euro and the yen after the FOMC release, finishing 0.8% higher on the session.
Valeant (VRX +6.8%) bounced back following damaging losses. When revisited in the "Featured Stock Update" section of the 10/20/15 report (read here) members were reminded - "Previously featured stocks which were dropped can serve as educational examples of the investment system's tactics. It is also a reminder that high-ranked leaders eventually fall out of favor. The action demonstrates the importance of recognizing sell signals and limiting losses if any stock falls more than -7% from your purchase price. "
The Featured Stocks Page saw some new names recently added. The most current notes with headline links help members have access to more detailed letter-by-letter analysis including price/volume graphs annotated by our experts. See the Premium Member Homepage for archives to all prior pay reports.
|
 Kenneth J. Gruneisen started out as a licensed stockbroker in August 1987, a couple of months prior to the historic stock market crash that took the Dow Jones Industrial Average down -22.6% in a single day. He has published daily fact-based fundamental and technical analysis on high-ranked stocks online for two decades. Through FACTBASEDINVESTING.COM, Kenneth provides educational articles, news, market commentary, and other information regarding proven investment systems that work in good times and bad.
Comments contained in the body of this report are technical opinions only and are not necessarily those of Gruneisen Growth Corp. The material herein has been obtained from sources believed to be reliable and accurate, however, its accuracy and completeness cannot be guaranteed. Our firm, employees, and customers may effect transactions, including transactions contrary to any recommendation herein, or have positions in the securities mentioned herein or options with respect thereto. Any recommendation contained in this report may not be suitable for all investors and it is not to be deemed an offer or solicitation on our part with respect to the purchase or sale of any securities. |
|
 |
Financial, Energy, Networking and Semiconductor Indexes Led Gainers
Kenneth J. Gruneisen - Passed the CAN SLIM® Master's Exam
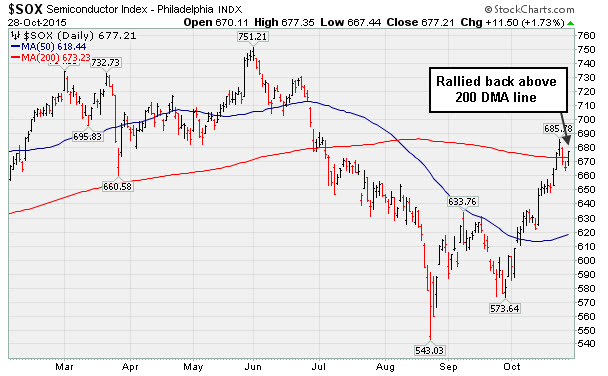
The Broker/Dealer Index ($XBD +3.91%) and the Bank Index ($BKX +3.52%) both posted solid gains as financial shares again on Wednesday provided positive influence on the major averages. The Retail Index ($RLX +0.92%) rose less than +1%. Energy-related shares rose as the Oil Services Index ($OSX +3.31%) and the Integrated Oil Index ($XOI +2.02%) both posted solid gains. The Networking Index ($NWX +3.37%) and the Semiconductor Index ($SOX +1.73%) led the tech sector higher, meanwhile the Biotechnology Index ($BTK +0.52%) posted a smaller gain. The Gold & Silver Index ($XAU -0.88%) was a laggard as it ended lower.
PICTURED: The Semiconductor Index ($SOX +1.73%) rebounded above its 200-day moving (DMA) line following a pullback. It would be a reassuring sign for the tech group to make further progress, whereas a slump back below the 200 DMA line for the SOX would not bode well for the broader market outlook.
| Oil Services |
$OSX |
177.42 |
+5.68 |
+3.31% |
-15.86% |
| Integrated Oil |
$XOI |
1,180.27 |
+23.32 |
+2.02% |
-12.45% |
| Semiconductor |
$SOX |
677.21 |
+11.50 |
+1.73% |
-1.41% |
| Networking |
$NWX |
400.85 |
+13.06 |
+3.37% |
+11.99% |
| Broker/Dealer |
$XBD |
179.59 |
+6.76 |
+3.91% |
-2.74% |
| Retail |
$RLX |
1,271.36 |
+11.53 |
+0.92% |
+23.11% |
| Gold & Silver |
$XAU |
54.09 |
-0.48 |
-0.88% |
-21.36% |
| Bank |
$BKX |
74.86 |
+2.54 |
+3.51% |
+0.81% |
| Biotech |
$BTK |
3,604.96 |
+18.60 |
+0.52% |
+4.82% |
|
|
|
 |
Technical Breakout Backed By Heavy Volume
Kenneth J. Gruneisen - Passed the CAN SLIM® Master's Exam
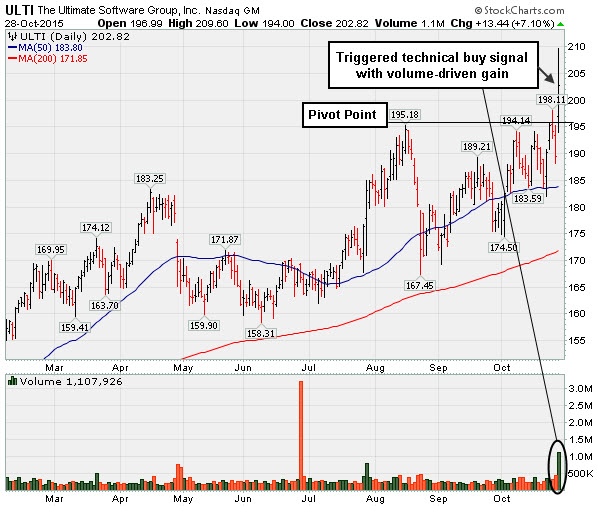
Ultimate Software Group (ULTI +$13.44 or +7.10% to $202.82) gapped up and rallied to a new 52-week high today with volume +347% above average. It was highlighted in yellow with pivot point cited based on its 8/17/15 high plus 10 cents in the earlier mid-day report (read here). The strong close above the pivot point clinched a technical buy signal. Disciplined investors avoid chasing stocks extended more than +5% above prior highs and always limit losses by selling if any stock falls more than -7% from their purchase price. Any stock that is sold can always be bought again if strength returns.
ULTI reported earnings +38% on +22% sales revenues for the Sep '15 quarter. In 7 of the past 8 quarterly comparisons it showed earnings increases above the +25% minimum guideline (C criteria). Earnings rose +47%, +35%, +25%, +26%, +11%, +35%, and +38% in the Mar, Jun, Sep, Dec '14, Mar, Jun and Sep '15 quarters, respectively. Sales revenues rose +24%, +25%, +24%, +21%, +20%, +21%, and +22% during the same span. Annual earnings (A criteria) history has been strong and steady.
The number of top-rated funds owning its shares rose from 497 in Dec '14 to 531 in Sep '15, a reassuring sign (I criteria). Its small supply (S criteria) of only 28.6 million shares outstanding can contribute to greater volatility in the event of institutional buying or selling.
|
|
|
Color Codes Explained :
Y - Better candidates highlighted by our
staff of experts.
G - Previously featured
in past reports as yellow but may no longer be buyable under the
guidelines.
***Last / Change / Volume data in this table is the closing quote data***
Symbol/Exchange
Company Name
Industry Group |
PRICE |
CHANGE
(%Change) |
Day High |
Volume
(% DAV)
(% 50 day avg vol) |
52 Wk Hi
% From Hi |
Featured
Date |
Price
Featured |
Pivot Featured |
|
Max Buy |
SFNC
-
NASDAQ
Simmons First Natl Cp A
BANKING - Regional - Southeast Banks
|
$53.78
|
+2.09
4.04% |
$53.96
|
218,018
126.75% of 50 DAV
50 DAV is 172,000
|
$53.00
1.48%
|
10/22/2015
|
$50.13
|
PP = $48.98
|
|
MB = $51.43
|
 Most Recent Note - 10/28/2015 5:57:02 PM
G - Color code was changed to green after rallying well above its "max buy" level. Prior highs in the $48 area define initial support to watch on pullbacks.
>>> FEATURED STOCK ARTICLE : Triple Average Volume Behind Spike to New HIgh Territory - 10/22/2015 |
View all notes |
Set NEW NOTE alert |
Company Profile |
SEC
News |
Chart |
Request a new note
C
A
S
I |
MANH
-
NASDAQ
Manhattan Associates Inc
COMPUTER SOFTWARE and SERVICES - Technical and System Software
|
$74.24
|
+2.06
2.85% |
$74.24
|
605,990
121.44% of 50 DAV
50 DAV is 499,000
|
$74.85
-0.81%
|
10/21/2015
|
$69.18
|
PP = $69.91
|
|
MB = $73.41
|
Most Recent Note - 10/27/2015 1:48:15 PM
Y - Color code is changed to yellow after quietly pulling back below its "max buy" level following volume-driven gains. Prior highs in the $69 area define initial support to watch on pullbacks.
>>> FEATURED STOCK ARTICLE : Finished Strong With Gain Backed By Heavy Volume - 10/21/2015 |
View all notes |
Set NEW NOTE alert |
Company Profile |
SEC
News |
Chart |
Request a new note
C
A
S
I |
JBSS
-
NASDAQ
Sanfilippo John B & Son
FOOD and BEVERAGE - Processed and Packaged Goods
|
$60.23
|
+2.67
4.64% |
$61.65
|
100,209
151.83% of 50 DAV
50 DAV is 66,000
|
$58.47
3.02%
|
10/27/2015
|
$56.00
|
PP = $57.33
|
|
MB = $60.20
|
Most Recent Note - 10/28/2015 6:01:15 PM
Y - Finished near its "max buy" level with today's 2nd consecutive volume-driven gain into new high territory. Highlighted in yellow with pivot point cited based on its 7/14/15 high plus 10 cents in the 10/27/15 mid-day report (read here). Prior highs in the $57 area define initial support to watch on pullbacks after it triggered a technical buy signal. Small supply of only 8.29 million shares (S criteria) in the float may contribute to greater price volatility. See the latest FSU analysis for more details and an annotated graph.
>>> FEATURED STOCK ARTICLE : Small Supply in Food Firm Tecnically Breaking Out - 10/27/2015 |
View all notes |
Set NEW NOTE alert |
Company Profile |
SEC
News |
Chart |
Request a new note
C
A
S
I |
ULTI
-
NASDAQ
Ultimate Software Group
INTERNET - Internet Software and Services
|
$202.82
|
+13.44
7.10% |
$209.60
|
1,109,326
449.12% of 50 DAV
50 DAV is 247,000
|
$198.11
2.38%
|
10/28/2015
|
$204.38
|
PP = $195.28
|
|
MB = $205.04
|
Most Recent Note - 10/28/2015 1:23:30 PM
Y - Gapped up and rallied to a new 52-week high today. Color code is changed to yellow with pivot point cited based on its 8/17/15 high plus 10 cents, and a strong close above the pivot point may clinch a technical buy signal. Reported earnings +38% on +22% sales revenues for the Sep '15 quarter. In 3 of the past 4 quarterly comparisons it showed earnings increases above the +25% minimum guideline (C criteria). The number of top-rated funds owning its shares has been on the rise (I criteria)
>>> FEATURED STOCK ARTICLE : Technical Breakout Backed By Heavy Volume - 10/28/2015 |
View all notes |
Set NEW NOTE alert |
Company Profile |
SEC
News |
Chart |
Request a new note
C
A
S
I |
ULTA
-
NASDAQ
Ulta Salon Cosm & Frag
SPECIALTY RETAIL - Specialty Retail, Other
|
$172.96
|
+3.87
2.29% |
$173.99
|
784,366
80.61% of 50 DAV
50 DAV is 973,000
|
$176.77
-2.16%
|
10/22/2015
|
$168.02
|
PP = $170.31
|
|
MB = $178.83
|
Most Recent Note - 10/28/2015 5:55:07 PM
Y - Posted a low volume gain above its pivot point today for its 2nd best close and no resistance remains due to overhead supply. While consolidating above its 50 DMA line volume totals cooled. Subsequent volume-driven gains above the pivot point may trigger a proper technical buy signal.
>>> FEATURED STOCK ARTICLE : Consolidating Above 50-Day Moving Average Line - 10/12/2015 |
View all notes |
Set NEW NOTE alert |
Company Profile |
SEC
News |
Chart |
Request a new note
C
A
S
I |
Symbol/Exchange
Company Name
Industry Group |
PRICE |
CHANGE
(%Change) |
Day High |
Volume
(% DAV)
(% 50 day avg vol) |
52 Wk Hi
% From Hi |
Featured
Date |
Price
Featured |
Pivot Featured |
|
Max Buy |
FLTX
-
NYSE
Fleetmatics Group Plc
Computer Sftwr-Enterprse
|
$56.67
|
+1.60
2.91% |
$57.15
|
485,784
131.65% of 50 DAV
50 DAV is 369,000
|
$56.60
0.13%
|
9/23/2015
|
$51.26
|
PP = $52.55
|
|
MB = $55.18
|
Most Recent Note - 10/27/2015 1:54:16 PM
Y - Rallying near its "max buy" level with higher volume today. Prior highs in the $52 area acted as support during its consolidation.
>>> FEATURED STOCK ARTICLE : Found Support Above Prior Highs Following Breakout - 10/19/2015 |
View all notes |
Set NEW NOTE alert |
Company Profile |
SEC
News |
Chart |
Request a new note
C
A
S
I |
LXFT
-
NYSE
Luxoft Holding Inc Cl A
Comp Sftwr-Spec Enterprs
|
$69.04
|
+2.42
3.63% |
$69.49
|
391,619
158.55% of 50 DAV
50 DAV is 247,000
|
$70.94
-2.68%
|
10/22/2015
|
$66.65
|
PP = $68.95
|
|
MB = $72.40
|
Most Recent Note - 10/28/2015 6:03:25 PM
Y - Posted another solid gain today with above average volume. Gap up on 10/23/15 and new 52-week high triggered a new (or add-on) technical buy signal. New pivot point cited was based on its 9/17/15 high plus 10 cents. See the latest FSU analysis for more details and an annotated graph.
>>> FEATURED STOCK ARTICLE : Retreat Into Prior Base Following Latest Breakout - 10/26/2015 |
View all notes |
Set NEW NOTE alert |
Company Profile |
SEC
News |
Chart |
Request a new note
C
A
S
I |
NHTC
-
NASDAQ
Natural Health Trends
Cosmetics/Personal Care
|
$44.00
|
+5.37
13.90% |
$45.27
|
1,350,247
553.38% of 50 DAV
50 DAV is 244,000
|
$44.75
-1.68%
|
10/23/2015
|
$42.12
|
PP = $44.85
|
|
MB = $47.09
|
Most Recent Note - 10/28/2015 1:09:31 PM
Y - Rallying near prior resistance with today's big volume-driven gain, trading within close striking distance of its 52-week high. Reported earnings +181% on +154% sales revenues for the Sep '15 quarter. Highlighted in yellow in the 10/23/15 mid-day report with new pivot point cited based on its 6/25/15 high plus 10 cents - "Subsequent volume-driven gains for new highs are still needed to trigger a proper technical buy signal. Making progress through resistance, still facing some overhead supply up through the $44 level."
>>> FEATURED STOCK ARTICLE : Finished Strong But Approaching Prior Resistance - 10/23/2015 |
View all notes |
Set NEW NOTE alert |
Company Profile |
SEC
News |
Chart |
Request a new note
C
A
S
I |
|
|
|
THESE ARE NOT BUY RECOMMENDATIONS!
Comments contained in the body of this report are technical
opinions only. The material herein has been obtained
from sources believed to be reliable and accurate, however,
its accuracy and completeness cannot be guaranteed.
This site is not an investment advisor, hence it does
not endorse or recommend any securities or other investments.
Any recommendation contained in this report may not
be suitable for all investors and it is not to be deemed
an offer or solicitation on our part with respect to
the purchase or sale of any securities. All trademarks,
service marks and trade names appearing in this report
are the property of their respective owners, and are
likewise used for identification purposes only.
This report is a service available
only to active Paid Premium Members.
You may opt-out of receiving report notifications
at any time. Questions or comments may be submitted
by writing to Premium Membership Services 665 S.E. 10 Street, Suite 201 Deerfield Beach, FL 33441-5634 or by calling 1-800-965-8307
or 954-785-1121.
|
|
|