You are not logged in.
This means you
CAN ONLY VIEW reports that were published prior to Wednesday, April 2, 2025.
You
MUST UPGRADE YOUR MEMBERSHIP if you want to see any current reports.
AFTER MARKET UPDATE - MONDAY, OCTOBER 19TH, 2015
Previous After Market Report Next After Market Report >>>
|
|
|
|
DOW |
+14.57 |
17,230.54 |
+0.08% |
|
Volume |
806,223,540 |
-14% |
|
Volume |
1,465,543,250 |
-13% |
|
NASDAQ |
+18.78 |
4,905.47 |
+0.38% |
|
Advancers |
1,431 |
46% |
|
Advancers |
1,409 |
50% |
|
S&P 500 |
+0.55 |
2,033.66 |
+0.03% |
|
Decliners |
1,665 |
54% |
|
Decliners |
1,393 |
50% |
|
Russell 2000 |
+1.99 |
1,164.30 |
+0.17% |
|
52 Wk Highs |
62 |
|
|
52 Wk Highs |
50 |
|
|
S&P 600 |
+1.36 |
687.28 |
+0.20% |
|
52 Wk Lows |
24 |
|
|
52 Wk Lows |
39 |
|
|
 |
Major Averages Quietly Edged Higher
Kenneth J. Gruneisen - Passed the CAN SLIM® Master's Exam
Stocks finished marginally higher on Monday. The Dow rose 14 points to 17230. The S&P 500 added less than 1 point to 2033. The NASDAQ advanced 18 points to 4905 The volume totals were reported lower than the prior session totals on the NYSE and on the Nasdaq exchange. Decliners outnumbered advancers by an 8-7 margin on the NYSE while advancers and decliners were evenly mixed on the Nasdaq exchange. There were 40 stocks that made it onto the BreakOuts Page, up a notch from the prior session total of 39 high-ranked companies from the Leaders List that made a new 52-week high. New 52-week highs outnumbered new 52-week lows on the NYSE and on the Nasdaq exchange. There were gains for 3 of the 4 high-ranked companies currently on the Featured Stocks Page.
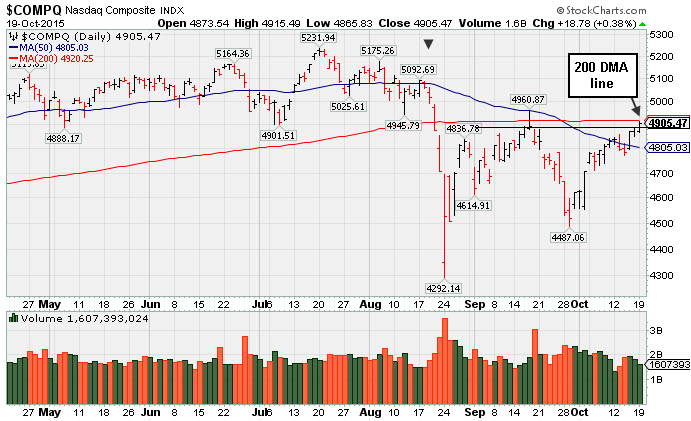
PICTURED: The Nasdaq Composite Index rallied further above its 50-day moving average (DMA) line for its best close of the recovery. It is approaching near-term chart resistance at its 200 DMA line.
The S&P 500 Index and Dow Jones Industrial Average both rallied to their highest closes of the ongoing recovery. The Nasdaq Composite Index joined them by also rallying above its 50 DMA line. Solid follow-through gains for the major indices established a new confirmed uptrend (M criteria). However, all 3 major averages remain well below their 200-day moving average lines. Members have been repeatedly reminded in recent weeks that at least 2 of the 3 major indices should be trading above their respective 200-day moving average (DMA) lines in order for a market environment to be considered technically "healthy". Additional recovery work must be done to get the indices back into healthy shape, and that improvement could require some considerable time and patience.
The major averages eked out gains, setting new eight-week highs. Five of 10 S&P 500 sectors finished in positive territory. In consumer stocks, an upbeat survey on homebuilder sentiment left Home Depot (HD +0.29%) higher. Health care and tech companies helped lift the NASDAQ. Bargain hunting benefitted Biogen (BIIB +0.24%). M&A was alive in the tech world as Microsemi (MSCC -5.43%) fell after putting in a competitive $2.4 billion bid for PMC-Sierra (PMCS +14.55%). Skyworks Solutions (SWKS -2.22%) already had a bid out for PMC. In other M&A, Diebold (DBD +6.71%) rose on the heels of making an offer to Wincor Nixdorf for approximately $1.8 billion.
On the earnings front, Morgan Stanley (MS -4.80%) and Hasbro (HAS -7.20%) both tumbled after their quarterly results failed to impress. Meanwhile, bearish analyst commentary left Las Vegas Sands (LVS -4.38%) down.
Treasuries were little changed. The benchmark 10-year note gained 3/32 to yield 2.02%. Commodities were broadly lower. WTI crude slumped 2.6% to $46.04/barrel. COMEX gold sank 1.2% to $1169.30/ounce. In FOREX, the U.S. dollar strengthened against both the yen and the euro.
The number of stocks listed to the Featured Stocks Page waned during deteriorating market conditions. The most current notes with headline links help members have access to more detailed letter-by-letter analysis including price/volume graphs annotated by our experts. See the Premium Member Homepage for archives to all prior pay reports.
|
 Kenneth J. Gruneisen started out as a licensed stockbroker in August 1987, a couple of months prior to the historic stock market crash that took the Dow Jones Industrial Average down -22.6% in a single day. He has published daily fact-based fundamental and technical analysis on high-ranked stocks online for two decades. Through FACTBASEDINVESTING.COM, Kenneth provides educational articles, news, market commentary, and other information regarding proven investment systems that work in good times and bad.
Comments contained in the body of this report are technical opinions only and are not necessarily those of Gruneisen Growth Corp. The material herein has been obtained from sources believed to be reliable and accurate, however, its accuracy and completeness cannot be guaranteed. Our firm, employees, and customers may effect transactions, including transactions contrary to any recommendation herein, or have positions in the securities mentioned herein or options with respect thereto. Any recommendation contained in this report may not be suitable for all investors and it is not to be deemed an offer or solicitation on our part with respect to the purchase or sale of any securities. |
|
 |
Retail Index Rose; Commodity-Linked Groups Fell Hard
Kenneth J. Gruneisen - Passed the CAN SLIM® Master's Exam
Strength from the Retail Index ($RLX +0.76%) helped the major averages have a positive bias on Monday, but financial shares were a negative influence as the Broker/Dealer Index ($XBD -0.38%) and the Bank Index ($BKX -0.42%) both edged lower. The Biotechnology Index ($BTK +0.02%) and Semiconductor Index ($SOX +0.04%) both finished flat while Networking Index ($NWX -0.70%) fell. Commodity-linked groups endured heavy pressure as the Gold & Silver Index ($XAU -4.36%), Oil Services Index ($OSX -4.94%), and the Integrated Oil Index ($XOI -2.45%) fell.
Charts courtesy www.stockcharts.com
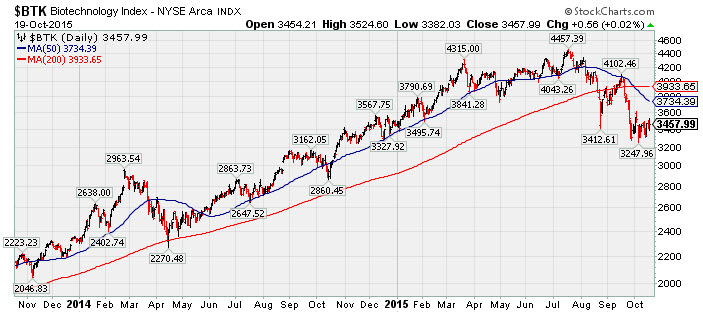
PICTURED: The Biotechnology Index ($BTK +0.02%) has slumped well below its 50-day and 200-day moving (DMA) lines. The current consolidation has been below its 200 DMA line for several weeks. That long-term average acted as support in April of 2014 before recovering and rallying further into new high territory.
| Oil Services |
$OSX |
175.92 |
-2.54 |
-1.42% |
-16.57% |
| Integrated Oil |
$XOI |
1,193.15 |
-30.01 |
-2.45% |
-11.50% |
| Semiconductor |
$SOX |
652.88 |
+0.25 |
+0.04% |
-4.95% |
| Networking |
$NWX |
376.74 |
-2.67 |
-0.70% |
+5.25% |
| Broker/Dealer |
$XBD |
171.07 |
-0.65 |
-0.38% |
-7.35% |
| Retail |
$RLX |
1,238.47 |
+9.34 |
+0.76% |
+19.92% |
| Gold & Silver |
$XAU |
53.59 |
-2.44 |
-4.35% |
-22.08% |
| Bank |
$BKX |
70.74 |
-0.29 |
-0.41% |
-4.74% |
| Biotech |
$BTK |
3,457.99 |
+0.56 |
+0.02% |
+0.55% |
|
|
|
 |
Found Support Above Prior Highs Following Breakout
Kenneth J. Gruneisen - Passed the CAN SLIM® Master's Exam
Fleetmatics Group Plc (FLTX +$0.33 or +0.61% to $54.69) is perched near its 52-week high. Prior highs acted as support when consolidating after a volume-driven gain on 10/05/15 that triggered a technical buy signal. The high-ranked Ireland-based Computer Software - Enterprise found support near the 50-day moving average (DMA) line during its earlier consolidation.
FLTX was last shown in this FSU section on 10/08/15 with an annotated graph under the headline, "Holding Ground Following Volume-Driven Breakout". In the 9/23/15 mid-day report (read here) at $51.26 it was highlighted in yellow with pivot point cited based on its 8/07/15 high plus 10 cents.
The number of top-rated funds owning its share rose from 280 in Dec '14 to 322 in Sep '15, a reassuring sign concerning the I criteria. Its current Up/Down Volume Ratio of 1.4 is an unbiased indication its shares have been under accumulation over the past 50 days.
It found support at its 200 DMA line during its consolidation since noted with caution at its 52-week high in the 8/07/15 mid-day report "Reported earnings +83% on +24% sales revenues for the Jun '15 quarter, its 3rd consecutive quarterly earnings comparison above the +25% minimum guideline (C criteria). That helps it better match the fact-based investment system's guidelines however sequential quarterly comparisons have shown deceleration in its growth rate. Gapped up today hitting a new 52-week high, and no resistance remains due to overhead supply. Encountered distributional pressure following a technical breakout on 7/27/15, then found support above its 50 DMA line during its recent consolidation."
|
|
|
Color Codes Explained :
Y - Better candidates highlighted by our
staff of experts.
G - Previously featured
in past reports as yellow but may no longer be buyable under the
guidelines.
***Last / Change / Volume data in this table is the closing quote data***
Symbol/Exchange
Company Name
Industry Group |
PRICE |
CHANGE
(%Change) |
Day High |
Volume
(% DAV)
(% 50 day avg vol) |
52 Wk Hi
% From Hi |
Featured
Date |
Price
Featured |
Pivot Featured |
|
Max Buy |
HAWK
-
NASDAQ
Blackhawk Network Inc
DIVERSIFIED SERVICES - Business/Management Services
|
$41.49
|
-0.36
-0.86% |
$41.83
|
718,286
128.49% of 50 DAV
50 DAV is 559,000
|
$46.97
-11.67%
|
10/9/2015
|
$45.82
|
PP = $46.23
|
|
MB = $48.54
|
Most Recent Note - 10/15/2015 12:25:18 PM
G - Gapped down on the prior session and the damaging volume-driven loss triggered a technical sell signal as it violated its 50 DMA line. Disciplined investors understand that the stock did not trigger a technical buy signal after highlighted in yellow in the 10/09/15 mid-day report.
>>> FEATURED STOCK ARTICLE : Met Some Resistance After Touching a New 52-Week High - 10/9/2015 |
View all notes |
Set NEW NOTE alert |
Company Profile |
SEC
News |
Chart |
Request a new note
C
A
S
I |
ULTA
-
NASDAQ
Ulta Salon Cosm & Frag
SPECIALTY RETAIL - Specialty Retail, Other
|
$168.36
|
+2.25
1.35% |
$168.63
|
687,679
70.82% of 50 DAV
50 DAV is 971,000
|
$176.77
-4.76%
|
5/29/2015
|
$155.03
|
PP = $159.95
|
|
MB = $167.95
|
Most Recent Note - 10/16/2015 3:51:53 PM
G - Rebounding above its 50 DMA line with today's big gain. It has not formed a sound base following the deep shakeout on 8/24/15.
>>> FEATURED STOCK ARTICLE : Consolidating Above 50-Day Moving Average Line - 10/12/2015 |
View all notes |
Set NEW NOTE alert |
Company Profile |
SEC
News |
Chart |
Request a new note
C
A
S
I |
FLTX
-
NYSE
Fleetmatics Group Plc
Computer Sftwr-Enterprse
|
$54.69
|
+0.33
0.61% |
$55.04
|
236,826
62.82% of 50 DAV
50 DAV is 377,000
|
$56.60
-3.37%
|
9/23/2015
|
$51.26
|
PP = $52.55
|
|
MB = $55.18
|
 Most Recent Note - 10/19/2015 6:34:58 PM
Y - Still consolidating below its "max buy" level. Prior highs in the $52 area acted as support. See the latest FSU analysis for more details and a new annotated graph.
>>> FEATURED STOCK ARTICLE : Found Support Above Prior Highs Following Breakout - 10/19/2015 |
View all notes |
Set NEW NOTE alert |
Company Profile |
SEC
News |
Chart |
Request a new note
C
A
S
I |
LXFT
-
NYSE
Luxoft Holding Inc Cl A
Comp Sftwr-Spec Enterprs
|
$65.50
|
+0.10
0.15% |
$65.87
|
107,315
43.27% of 50 DAV
50 DAV is 248,000
|
$68.85
-4.87%
|
5/26/2015
|
$51.90
|
PP = $57.40
|
|
MB = $60.27
|
Most Recent Note - 10/15/2015 6:26:32 PM
G - Posted a gain on lighter volume today, rising from its 50 DMA line. Little resistance remains due to overhead supply however it has not formed a sound base.
>>> FEATURED STOCK ARTICLE : Consolidating After Rebound Above 50-Day Moving Average - 10/13/2015 |
View all notes |
Set NEW NOTE alert |
Company Profile |
SEC
News |
Chart |
Request a new note
C
A
S
I |
|
|
|
THESE ARE NOT BUY RECOMMENDATIONS!
Comments contained in the body of this report are technical
opinions only. The material herein has been obtained
from sources believed to be reliable and accurate, however,
its accuracy and completeness cannot be guaranteed.
This site is not an investment advisor, hence it does
not endorse or recommend any securities or other investments.
Any recommendation contained in this report may not
be suitable for all investors and it is not to be deemed
an offer or solicitation on our part with respect to
the purchase or sale of any securities. All trademarks,
service marks and trade names appearing in this report
are the property of their respective owners, and are
likewise used for identification purposes only.
This report is a service available
only to active Paid Premium Members.
You may opt-out of receiving report notifications
at any time. Questions or comments may be submitted
by writing to Premium Membership Services 665 S.E. 10 Street, Suite 201 Deerfield Beach, FL 33441-5634 or by calling 1-800-965-8307
or 954-785-1121.
|
|
|