You are not logged in.
This means you
CAN ONLY VIEW reports that were published prior to Wednesday, April 2, 2025.
You
MUST UPGRADE YOUR MEMBERSHIP if you want to see any current reports.
AFTER MARKET UPDATE - TUESDAY, OCTOBER 20TH, 2015
Previous After Market Report Next After Market Report >>>
|
|
|
|
DOW |
-13.43 |
17,217.11 |
-0.08% |
|
Volume |
771,931,790 |
-4% |
|
Volume |
1,559,283,500 |
+6% |
|
NASDAQ |
-24.50 |
4,880.97 |
-0.50% |
|
Advancers |
1,889 |
62% |
|
Advancers |
1,364 |
49% |
|
S&P 500 |
-2.89 |
2,030.77 |
-0.14% |
|
Decliners |
1,175 |
38% |
|
Decliners |
1,443 |
51% |
|
Russell 2000 |
-1.03 |
1,163.27 |
-0.09% |
|
52 Wk Highs |
66 |
|
|
52 Wk Highs |
60 |
|
|
S&P 600 |
+1.25 |
688.53 |
+0.18% |
|
52 Wk Lows |
21 |
|
|
52 Wk Lows |
55 |
|
|
 |
Major Averages Quietly Ended Lower
Kenneth J. Gruneisen - Passed the CAN SLIM® Master's Exam
The major averages quietly ended Tuesday's session slightly lower. The volume totals were reported mixed, lower than the prior session total on the NYSE and slightly higher on the Nasdaq exchange. Advancers led decliners by a 3-2 margin on the NYSE while decliners narrowly led advancers the Nasdaq exchange. There were 42 stocks that made it onto the BreakOuts Page, up from the prior session total of 40 high-ranked companies from the Leaders List that made a new 52-week high. New 52-week highs outnumbered new 52-week lows on the NYSE and on the Nasdaq exchange. There were losses for 3 of the 4 high-ranked companies currently on the Featured Stocks Page.
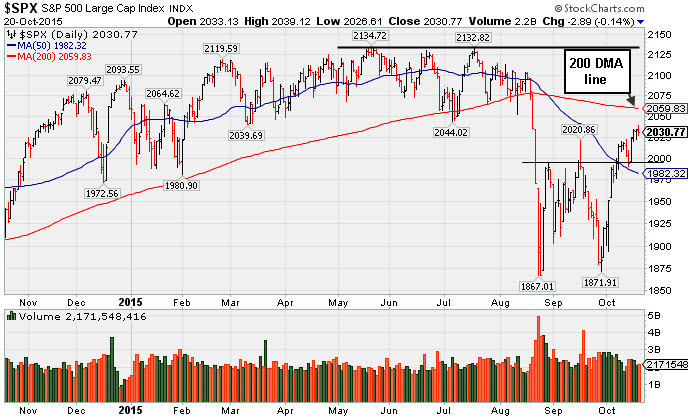
PICTURED: The S&P 500 Index is approaching near-term chart resistance at its 200-day moving average (DMA) line. That important long-term average has been downward sloping since August.
New buying efforts may be considered only in stocks meeting all key criteria. Very few candidates have met the strict gudelines of the fact-based investment system in the recent recovery. The major indices established a confirmed uptrend (M criteria), however the S&P 500 Index and Dow Jones Industrial Average both remain well below their 200-day moving average lines. At least 2 of the 3 major indices should be trading above their respective 200-day moving average (DMA) lines in order for a market environment to be considered technically "healthy".
The major averages were marginally lower as investors digested economic data and earnings. September’s measure of housing starts rose 6.5% over the previous month, matching an eight-year high. However, building permits unexpectedly contracted last month.
Telecom shares were up after Verizon (VZ +1.21%) bested earnings expectations. In industrials, United Technologies (UTX +3.88%) and Traveler’s (TRV +2.47%) rallied on the heels of positive profit tallies from both. Ahead of their earnings reports Yahoo! (YHOO -2.00%) and Chipotle (CMG -1.81%) both fell.
In other news, Yum! (YUM +1.84%) rose after announcing plans to separate its domestic and Chinese business units. On the M&A front, SanDisk (SNDK +4.43%) rose amid reports it is in advanced talks to be acquired by Western Digital (WDC -6.98%)
The number of stocks listed to the Featured Stocks Page waned during deteriorating market conditions. The most current notes with headline links help members have access to more detailed letter-by-letter analysis including price/volume graphs annotated by our experts. See the Premium Member Homepage for archives to all prior pay reports.
|
 Kenneth J. Gruneisen started out as a licensed stockbroker in August 1987, a couple of months prior to the historic stock market crash that took the Dow Jones Industrial Average down -22.6% in a single day. He has published daily fact-based fundamental and technical analysis on high-ranked stocks online for two decades. Through FACTBASEDINVESTING.COM, Kenneth provides educational articles, news, market commentary, and other information regarding proven investment systems that work in good times and bad.
Comments contained in the body of this report are technical opinions only and are not necessarily those of Gruneisen Growth Corp. The material herein has been obtained from sources believed to be reliable and accurate, however, its accuracy and completeness cannot be guaranteed. Our firm, employees, and customers may effect transactions, including transactions contrary to any recommendation herein, or have positions in the securities mentioned herein or options with respect thereto. Any recommendation contained in this report may not be suitable for all investors and it is not to be deemed an offer or solicitation on our part with respect to the purchase or sale of any securities. |
|
 |
Financial and Commodity-Linked Groups Rose; Retail and Biotech Fell
Kenneth J. Gruneisen - Passed the CAN SLIM® Master's Exam
Financial shares were a positive influence as the Broker/Dealer Index ($XBD +0.38%) and the Bank Index ($BKX +1.01%) both rose, but weakness from the Retail Index ($RLX -0.71%) created a drag on the major averages on Tuesday. The Biotechnology Index ($BTK -2.97%) weighed on the tech sector, meanwhile the Semiconductor Index ($SOX -0.15%) held its ground and the Networking Index ($NWX +0.84%) rose. Commodity-linked groups rebounded as the Gold & Silver Index ($XAU +3.84%) and Oil Services Index ($OSX +1.54%) posted gains. The Integrated Oil Index ($XOI -0.20%) edged lower.
Charts courtesy www.stockcharts.com
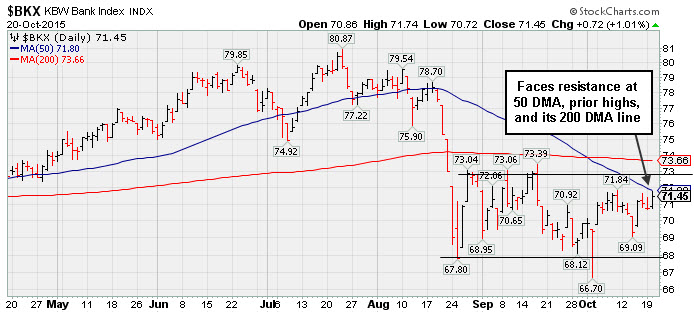
PICTURED: The Bank Index ($BKX +1.01%) faces near-term resistance at its 50-day moving (DMA) line. After violating prior lows in the $75 area and violating its 200 DMA line its rebound has been limited. A subsequent rally for new recovery highs and above the 200 DMA line would bode well for the market, but further deterioration to new lows would be an ominous sign.
| Oil Services |
$OSX |
178.63 |
+2.71 |
+1.54% |
-15.29% |
| Integrated Oil |
$XOI |
1,190.81 |
-2.34 |
-0.20% |
-11.67% |
| Semiconductor |
$SOX |
651.87 |
-1.01 |
-0.15% |
-5.10% |
| Networking |
$NWX |
379.92 |
+3.18 |
+0.84% |
+6.14% |
| Broker/Dealer |
$XBD |
171.72 |
+0.65 |
+0.38% |
-7.00% |
| Retail |
$RLX |
1,229.66 |
-8.81 |
-0.71% |
+19.07% |
| Gold & Silver |
$XAU |
55.64 |
+2.05 |
+3.83% |
-19.10% |
| Bank |
$BKX |
71.45 |
+0.72 |
+1.02% |
-3.78% |
| Biotech |
$BTK |
3,355.36 |
-102.62 |
-2.97% |
-2.44% |
|
|
|
 |
Following Sell Signals Even Uglier Damage Came
Kenneth J. Gruneisen - Passed the CAN SLIM® Master's Exam
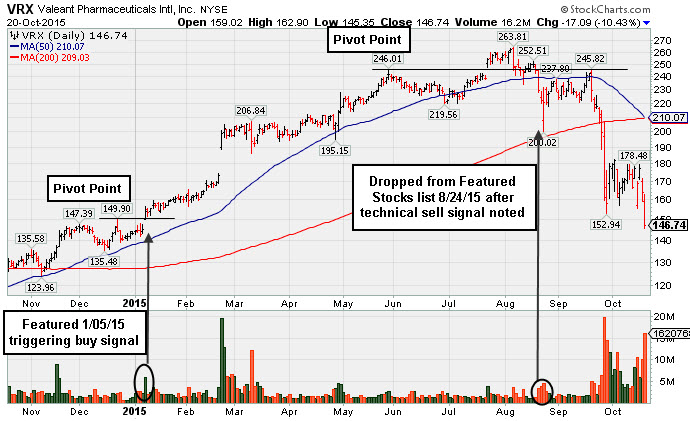
There are few stocks included on the Featured Stocks list now and none of the companies need additional review. At times like these we have an opportunity to look back. Not long ago we reviewed Ambarella (AMBA) on 9/03/15 and Skyworks (SWKS) on 9/17/15 because previously featured stocks which were dropped can serve as educational examples of the investment system's tactics. It is also a reminder that high-ranked leaders eventually fall out of favor. If you wish to request for a specific stock to receive more detailed coverage in this section please use the inquiry form to submit your request. Thank you! Valeant Pharmaceuticals International, Inc. (VRX) has seen its share price slashed badly in recent months. Technical sell signals were noted back on 8/20 and 8/21, and when it was dropped from the Featured Stocks list on 8/24/15. The subsequent rebound effort met resistance at its 50-day moving average, then it turned uglier. The action demonstrates the importance of recognizing sell signals and limiting losses if any stock falls more than -7% from your purchase price.
Longtime members may have been familiar with Valeant since appearing in reports back in December 2012, and it was featured in a favorable light on 1/05/15 after gapping up and triggering a technical buy signal. But after its 7/23/15 gap up above the pivot point triggered a new (or add-on) technical buy signal it only made little progress before failing and slumping back into the prior base. It was last shown in this FSU section on 8/03/15 with an annotated graph under the headline, "Holding Ground Following Latest Technical Breakout". A new pivot point had been cited based on its 5/28/15 high plus 10 cents.
It reported earnings +34% on +34% sales revenues for the Jun '15 quarter. VRX reported earnings +34% on +16% sales revenues for the Mar '15 quarter, an improvement after Dec '14 earnings below the +25% minimum guideline (C criteria). Prior quarterly comparisons were routinely above that minimum threshold.
It completed an new Public Offerings 3/17/15 and on 6/18/13. The upshot of such offerings is that the end result is typically an increase in the total number of institutional owners. The number of top-rated funds owning its shares rose from 1,056 in Mar '14 to 1,320 in Jun '15, a reassuring trend concerning the I criteria. A downturn in FY '07 and '08 earnings (A criteria) was followed by a strong earnings rebound in recent years.
|
|
|
Color Codes Explained :
Y - Better candidates highlighted by our
staff of experts.
G - Previously featured
in past reports as yellow but may no longer be buyable under the
guidelines.
***Last / Change / Volume data in this table is the closing quote data***
|
|
|
THESE ARE NOT BUY RECOMMENDATIONS!
Comments contained in the body of this report are technical
opinions only. The material herein has been obtained
from sources believed to be reliable and accurate, however,
its accuracy and completeness cannot be guaranteed.
This site is not an investment advisor, hence it does
not endorse or recommend any securities or other investments.
Any recommendation contained in this report may not
be suitable for all investors and it is not to be deemed
an offer or solicitation on our part with respect to
the purchase or sale of any securities. All trademarks,
service marks and trade names appearing in this report
are the property of their respective owners, and are
likewise used for identification purposes only.
This report is a service available
only to active Paid Premium Members.
You may opt-out of receiving report notifications
at any time. Questions or comments may be submitted
by writing to Premium Membership Services 665 S.E. 10 Street, Suite 201 Deerfield Beach, FL 33441-5634 or by calling 1-800-965-8307
or 954-785-1121.
|
|
|