You are not logged in.
This means you
CAN ONLY VIEW reports that were published prior to Sunday, April 6, 2025.
You
MUST UPGRADE YOUR MEMBERSHIP if you want to see any current reports.
AFTER MARKET UPDATE - THURSDAY, OCTOBER 29TH, 2015
Previous After Market Report Next After Market Report >>>
|
|
|
|
DOW |
-23.72 |
17,755.80 |
-0.13% |
|
Volume |
848,475,200 |
-14% |
|
Volume |
1,758,926,850 |
-10% |
|
NASDAQ |
-21.42 |
5,074.27 |
-0.42% |
|
Advancers |
1,191 |
39% |
|
Advancers |
968 |
34% |
|
S&P 500 |
-0.94 |
2,089.41 |
-0.04% |
|
Decliners |
1,855 |
61% |
|
Decliners |
1,877 |
66% |
|
Russell 2000 |
-13.09 |
1,165.63 |
-1.11% |
|
52 Wk Highs |
89 |
|
|
52 Wk Highs |
107 |
|
|
S&P 600 |
-6.85 |
691.70 |
-0.98% |
|
52 Wk Lows |
43 |
|
|
52 Wk Lows |
87 |
|
|
 |
Major Averages Fell With Lighter Volume Totals
Kenneth J. Gruneisen - Passed the CAN SLIM® Master's Exam
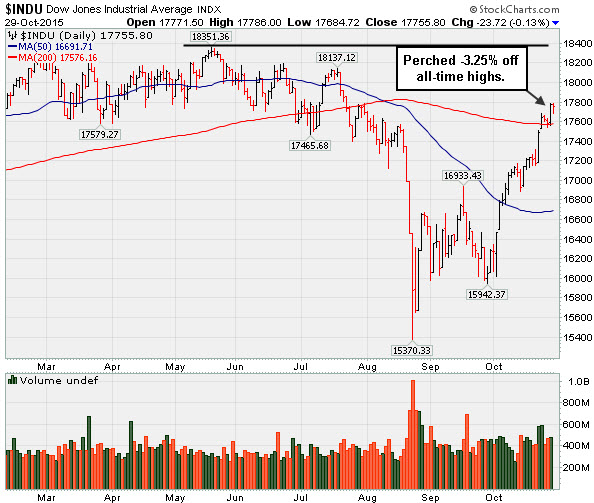
Stocks finished slightly lower on Thursday. The Dow fell 23 points to 17756. The S&P 500 was off less than 1 point to 2089. The NASDAQ fell 21 points to 5074. Volume totals were reported lighter on the NYSE and on the Nasdaq exchange, a reassuring sign of lighter institutional selling pressure. Breadth was negative as decliners led advancers by a 3-2 margin on the NYSE and 2-1 on the Nasdaq exchange. Leadership contracted as there were 62 stocks that made it onto the BreakOuts Page, down from the prior session total of 86 high-ranked companies from the Leaders List that made a new 52-week high. The new 52-week highs outnumbered new 52-week lows on the NYSE and on the Nasdaq exchange. There were gains for 4 of the 8 high-ranked companies currently on the Featured Stocks Page.
PICTURED: The Dow Jones Industrial Average finished -3.25% off its all-time high, consolidating above its 200-day moving average (DMA) line.
The major indices have established a confirmed uptrend (M criteria). Coupled with a reassuring expansion in leadership (stocks hitting new 52-week highs) last Friday's big gains helped the S&P 500 Index, Dow Jones Industrial Average, and Nasdaq Composite Index unanimously rally above their respective 200-day moving average lines. The market environment is technically in healthier shape. New buying efforts may be considered in stocks meeting all key criteria, and some new candidates have met the strict guidelines of the fact-based investment system in the recent recovery.
The major averages fluctuated as investors digested earnings and economic data. Third-quarter GDP grew at an annualized rate of 1.5%, slightly below analyst expectations of 1.6% and well off the 3.9% experienced in the second quarter. A separate release showed that initial jobless claims came in at 260,000, below estimates of 265,000. Another report showed that pending home sales unexpectedly declined in September.
In M&A news, Allergan (AGN +5.98%) jumped on a Wall Street Journal report of merger talks with Pfizer (PFE -1.92%). The deal would represent the largest corporate consolidation in 2015. In earnings, Aetna (AET +3.38%) rose after exceeding profit projections and raising forward guidance. GoPro (GPRO -15.19%) and Buffalo Wild Wings (BWLD -17.33%) tumbled after each company missed earnings expectations.
Five sectors in the S&P 500 traded higher on the day. Utilities stocks underperformed, while the healthcare sector paced the gains.
Treasuries were lower across the curve for a second-straight session. The benchmark U.S. 10-year note retreated 20/32, to yield 2.17%. Commodities were mixed. WTI crude erased earlier gains and fell 0.5% to $45.74/barrel. COMEX gold declined 2.5% to $1146.90/ounce.
Valeant (VRX) suffered damaging losses after revisited in the "Featured Stock Update" section of the 10/20/15 report (read here) with a cautionary note - "Previously featured stocks which were dropped can serve as educational examples of the investment system's tactics. It is also a reminder that high-ranked leaders eventually fall out of favor. The action demonstrates the importance of recognizing sell signals and limiting losses if any stock falls more than -7% from your purchase price. "
The Featured Stocks Page saw some new names recently added. The most current notes with headline links help members have access to more detailed letter-by-letter analysis including price/volume graphs annotated by our experts. See the Premium Member Homepage for archives to all prior pay reports.
|
 Kenneth J. Gruneisen started out as a licensed stockbroker in August 1987, a couple of months prior to the historic stock market crash that took the Dow Jones Industrial Average down -22.6% in a single day. He has published daily fact-based fundamental and technical analysis on high-ranked stocks online for two decades. Through FACTBASEDINVESTING.COM, Kenneth provides educational articles, news, market commentary, and other information regarding proven investment systems that work in good times and bad.
Comments contained in the body of this report are technical opinions only and are not necessarily those of Gruneisen Growth Corp. The material herein has been obtained from sources believed to be reliable and accurate, however, its accuracy and completeness cannot be guaranteed. Our firm, employees, and customers may effect transactions, including transactions contrary to any recommendation herein, or have positions in the securities mentioned herein or options with respect thereto. Any recommendation contained in this report may not be suitable for all investors and it is not to be deemed an offer or solicitation on our part with respect to the purchase or sale of any securities. |
|
 |
Retail Index Rose While Tech and Financial Groups Fell
Kenneth J. Gruneisen - Passed the CAN SLIM® Master's Exam
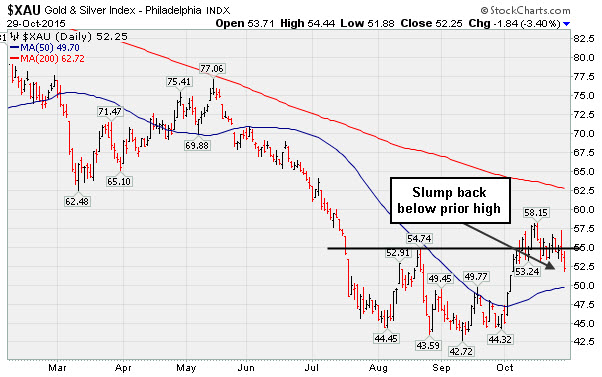
Financials were a negative influence on the major averages as the Broker/Dealer Index ($XBD -1.39%) and the Bank Index ($BKX -1.17%) both fell on Thursday. The Semiconductor Index ($SOX -2.99%), Networking Index ($NWX -1.48%), and the Biotechnology Index ($BTK -1.22%) posted unanimous losses that contributed to the tech-heavy Nasdaq Composite Index's relative underperformance versus its peers. The Retail Index ($RLX +0.52%) posted a modest gain. Energy-related shares were mixed as the Oil Services Index ($OSX -1.10%) fell and the Integrated Oil Index ($XOI +0.60%) posted a small gain.
PICTURED: The Gold & Silver Index ($XAU -3.40%) was a standout decliner, slumping back below its prior high and toward its 50-day moving average (DMA) line.
| Oil Services |
$OSX |
175.46 |
-1.96 |
-1.10% |
-16.79% |
| Integrated Oil |
$XOI |
1,187.40 |
+7.13 |
+0.60% |
-11.92% |
| Semiconductor |
$SOX |
656.94 |
-20.27 |
-2.99% |
-4.36% |
| Networking |
$NWX |
394.93 |
-5.93 |
-1.48% |
+10.33% |
| Broker/Dealer |
$XBD |
177.09 |
-2.49 |
-1.39% |
-4.09% |
| Retail |
$RLX |
1,278.03 |
+6.67 |
+0.52% |
+23.75% |
| Gold & Silver |
$XAU |
52.25 |
-1.84 |
-3.40% |
-24.03% |
| Bank |
$BKX |
73.98 |
-0.88 |
-1.18% |
-0.38% |
| Biotech |
$BTK |
3,561.02 |
-43.94 |
-1.22% |
+3.54% |
|
|
|
 |
Recent Gains Lacked Volume Indicative of Institutional Buying Demand
Kenneth J. Gruneisen - Passed the CAN SLIM® Master's Exam
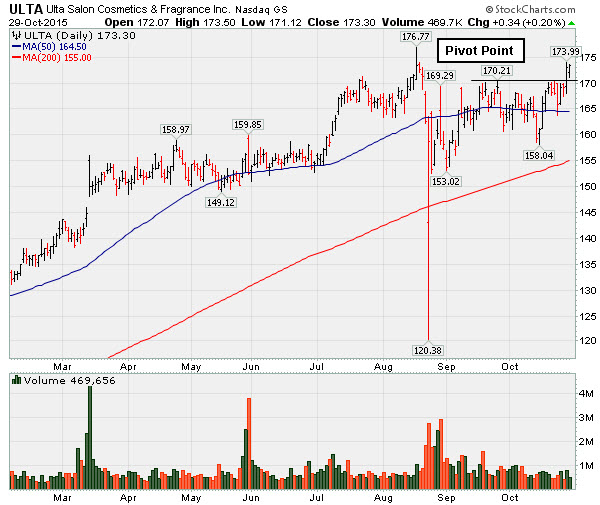
Ulta Salon Cosmetics & Fragrance, Inc. (ULTA +$0.34 or +0.20% to $173.30) posted gains that have lacked volume conviction while rising above its pivot point for its best-ever close. While consolidating above its 50-day moving average (DMA) line volume totals cooled. No resistance remains due to overhead supply, but without heavy volume indicative of fresh institutional buying demand there is not a good reason to expect a meaningful advance. Subsequent gains above the pivot point backed by at least +40% above average volume may trigger a proper technical buy signal.
ULTA was last shown with an annotated graph in this FSU section on 10/12/15 under the headline, "Consolidating Above 50-Day Moving Average Line". An impressive rebound was indicative of institutional support. The high-ranked firm had tallied a gain on 8/18/15 with solid +54% above average volume, but it stalled immediately afterward and soon triggered technical sell signals. It made limited headway since highlighted in yellow with pivot point cited based on its 4/24/15 high plus 10 cents in the 5/29/15 mid-day report (read here).
For the latest quarterly period, ULTA reported earnings +22% on +19% sales revenues for the Jul '15 quarter, below the +25% minimum earnings guideline (C criteria), raising fundamental concerns. Earnings rose +34%, +26%, +22%, and +35% in the Jul '14, Oct '14, Jan '15 and Apr '15 quarterly comparisons, respectively. Its strong earnings have been underpinned by steady sales revenues increases in the +21-22% range during that span of time. Its solid annual earnings (A criteria) history is very reassuring.
It has a small supply (S criteria) of only 62.7 million shares in the public float. The number of top-rated funds with an ownership interest has grown from 566 funds in Jun '14 to 815 funds as of Jun '15, which is a very encouraging sign of increasing institutional interest (the I criteria).
|
|
|
Color Codes Explained :
Y - Better candidates highlighted by our
staff of experts.
G - Previously featured
in past reports as yellow but may no longer be buyable under the
guidelines.
***Last / Change / Volume data in this table is the closing quote data***
Symbol/Exchange
Company Name
Industry Group |
PRICE |
CHANGE
(%Change) |
Day High |
Volume
(% DAV)
(% 50 day avg vol) |
52 Wk Hi
% From Hi |
Featured
Date |
Price
Featured |
Pivot Featured |
|
Max Buy |
SFNC
-
NASDAQ
Simmons First Natl Cp A
BANKING - Regional - Southeast Banks
|
$52.66
|
-1.12
-2.08% |
$54.00
|
139,975
81.38% of 50 DAV
50 DAV is 172,000
|
$53.96
-2.41%
|
10/22/2015
|
$50.13
|
PP = $48.98
|
|
MB = $51.43
|
Most Recent Note - 10/28/2015 5:57:02 PM
G - Color code was changed to green after rallying well above its "max buy" level. Prior highs in the $48 area define initial support to watch on pullbacks.
>>> FEATURED STOCK ARTICLE : Triple Average Volume Behind Spike to New HIgh Territory - 10/22/2015 |
View all notes |
Set NEW NOTE alert |
Company Profile |
SEC
News |
Chart |
Request a new note
C
A
S
I |
MANH
-
NASDAQ
Manhattan Associates Inc
COMPUTER SOFTWARE and SERVICES - Technical and System Software
|
$72.96
|
-1.28
-1.72% |
$74.00
|
371,043
74.36% of 50 DAV
50 DAV is 499,000
|
$74.85
-2.53%
|
10/21/2015
|
$69.18
|
PP = $69.91
|
|
MB = $73.41
|
Most Recent Note - 10/28/2015 6:09:29 PM
G - Color code is changed to green after rising well above its "max buy" level with a volume-driven gain. Prior highs in the $69 area define initial support to watch on pullbacks.
>>> FEATURED STOCK ARTICLE : Finished Strong With Gain Backed By Heavy Volume - 10/21/2015 |
View all notes |
Set NEW NOTE alert |
Company Profile |
SEC
News |
Chart |
Request a new note
C
A
S
I |
JBSS
-
NASDAQ
Sanfilippo John B & Son
FOOD and BEVERAGE - Processed and Packaged Goods
|
$63.07
|
+2.84
4.72% |
$63.68
|
98,771
149.65% of 50 DAV
50 DAV is 66,000
|
$61.65
2.30%
|
10/27/2015
|
$56.00
|
PP = $57.33
|
|
MB = $60.20
|
 Most Recent Note - 10/29/2015 6:42:48 PM
G - Rallied above its "max buy" level with today's 3rd consecutive volume-driven gain and its color code is changed to green. Prior highs in the $57 area define initial support to watch on pullbacks.
>>> FEATURED STOCK ARTICLE : Small Supply in Food Firm Tecnically Breaking Out - 10/27/2015 |
View all notes |
Set NEW NOTE alert |
Company Profile |
SEC
News |
Chart |
Request a new note
C
A
S
I |
ULTI
-
NASDAQ
Ultimate Software Group
INTERNET - Internet Software and Services
|
$204.63
|
+1.81
0.89% |
$205.31
|
378,572
153.27% of 50 DAV
50 DAV is 247,000
|
$209.60
-2.37%
|
10/28/2015
|
$204.38
|
PP = $195.28
|
|
MB = $205.04
|
Most Recent Note - 10/29/2015 6:39:10 PM
Y - Volume-driven gains above the pivot point clinched a technical buy signal. Reported earnings +38% on +22% sales revenues for the Sep '15 quarter. See the latest FSU analysis for more details and an annotated graph.
>>> FEATURED STOCK ARTICLE : Technical Breakout Backed By Heavy Volume - 10/28/2015 |
View all notes |
Set NEW NOTE alert |
Company Profile |
SEC
News |
Chart |
Request a new note
C
A
S
I |
ULTA
-
NASDAQ
Ulta Salon Cosm & Frag
SPECIALTY RETAIL - Specialty Retail, Other
|
$173.30
|
+0.34
0.20% |
$173.50
|
456,529
46.92% of 50 DAV
50 DAV is 973,000
|
$176.77
-1.96%
|
10/22/2015
|
$168.02
|
PP = $170.31
|
|
MB = $178.83
|
Most Recent Note - 10/29/2015 6:36:47 PM
Y - Posted low volume gains above its pivot point for its best-ever close and no resistance remains due to overhead supply. Gains above the pivot point backed by at least +40% above average volume may trigger a proper technical buy signal. See the latest FSU analysis for more details and a new annotated graph.
>>> FEATURED STOCK ARTICLE : Recent Gains Lacked Volume Indicative of Institutional Buying Demand - 10/29/2015 |
View all notes |
Set NEW NOTE alert |
Company Profile |
SEC
News |
Chart |
Request a new note
C
A
S
I |
Symbol/Exchange
Company Name
Industry Group |
PRICE |
CHANGE
(%Change) |
Day High |
Volume
(% DAV)
(% 50 day avg vol) |
52 Wk Hi
% From Hi |
Featured
Date |
Price
Featured |
Pivot Featured |
|
Max Buy |
FLTX
-
NYSE
Fleetmatics Group Plc
Computer Sftwr-Enterprse
|
$54.97
|
-1.70
-3.00% |
$56.53
|
361,083
97.85% of 50 DAV
50 DAV is 369,000
|
$57.15
-3.81%
|
9/23/2015
|
$51.26
|
PP = $52.55
|
|
MB = $55.18
|
Most Recent Note - 10/29/2015 6:45:54 PM
Y - Pulled back below its "max buy" level with lighter volume today and its color code is changed to yellow. Prior highs in the $52 area acted as support during its consolidation.
>>> FEATURED STOCK ARTICLE : Found Support Above Prior Highs Following Breakout - 10/19/2015 |
View all notes |
Set NEW NOTE alert |
Company Profile |
SEC
News |
Chart |
Request a new note
C
A
S
I |
LXFT
-
NYSE
Luxoft Holding Inc Cl A
Comp Sftwr-Spec Enterprs
|
$67.57
|
-1.47
-2.13% |
$68.67
|
136,738
55.36% of 50 DAV
50 DAV is 247,000
|
$70.94
-4.75%
|
10/22/2015
|
$66.65
|
PP = $68.95
|
|
MB = $72.40
|
Most Recent Note - 10/29/2015 6:44:22 PM
Y - Pulled back today with light volume. Gap up on 10/23/15 and new 52-week high triggered a new (or add-on) technical buy signal. New pivot point cited was based on its 9/17/15 high plus 10 cents.
>>> FEATURED STOCK ARTICLE : Retreat Into Prior Base Following Latest Breakout - 10/26/2015 |
View all notes |
Set NEW NOTE alert |
Company Profile |
SEC
News |
Chart |
Request a new note
C
A
S
I |
NHTC
-
NASDAQ
Natural Health Trends
Cosmetics/Personal Care
|
$48.31
|
+4.31
9.80% |
$48.40
|
906,679
371.59% of 50 DAV
50 DAV is 244,000
|
$45.27
6.72%
|
10/23/2015
|
$42.12
|
PP = $44.85
|
|
MB = $47.09
|
Most Recent Note - 10/29/2015 6:40:55 PM
G - Quickly rallied above its "max buy" level with today's considerable volume-driven gain and its color code is changed to green. Disciplined investors avoid chasing stocks extended more than +5% above prior highs and always limit losses by selling any stock that falls more than -7% from their purchase price.
>>> FEATURED STOCK ARTICLE : Finished Strong But Approaching Prior Resistance - 10/23/2015 |
View all notes |
Set NEW NOTE alert |
Company Profile |
SEC
News |
Chart |
Request a new note
C
A
S
I |
|
|
|
THESE ARE NOT BUY RECOMMENDATIONS!
Comments contained in the body of this report are technical
opinions only. The material herein has been obtained
from sources believed to be reliable and accurate, however,
its accuracy and completeness cannot be guaranteed.
This site is not an investment advisor, hence it does
not endorse or recommend any securities or other investments.
Any recommendation contained in this report may not
be suitable for all investors and it is not to be deemed
an offer or solicitation on our part with respect to
the purchase or sale of any securities. All trademarks,
service marks and trade names appearing in this report
are the property of their respective owners, and are
likewise used for identification purposes only.
This report is a service available
only to active Paid Premium Members.
You may opt-out of receiving report notifications
at any time. Questions or comments may be submitted
by writing to Premium Membership Services 665 S.E. 10 Street, Suite 201 Deerfield Beach, FL 33441-5634 or by calling 1-800-965-8307
or 954-785-1121.
|
|
|