You are not logged in.
This means you
CAN ONLY VIEW reports that were published prior to Tuesday, April 1, 2025.
You
MUST UPGRADE YOUR MEMBERSHIP if you want to see any current reports.
AFTER MARKET UPDATE - FRIDAY, OCTOBER 23RD, 2015
Previous After Market Report Next After Market Report >>>
|
|
|
|
DOW |
+157.54 |
17,646.70 |
+0.90% |
|
Volume |
979,667,690 |
-4% |
|
Volume |
1,987,814,900 |
+0% |
|
NASDAQ |
+111.81 |
5,031.86 |
+2.27% |
|
Advancers |
1,816 |
59% |
|
Advancers |
1,942 |
67% |
|
S&P 500 |
+22.64 |
2,075.15 |
+1.10% |
|
Decliners |
1,243 |
41% |
|
Decliners |
964 |
33% |
|
Russell 2000 |
+11.53 |
1,166.06 |
+1.00% |
|
52 Wk Highs |
123 |
|
|
52 Wk Highs |
88 |
|
|
S&P 600 |
+6.75 |
690.75 |
+0.99% |
|
52 Wk Lows |
58 |
|
|
52 Wk Lows |
92 |
|
|
 |
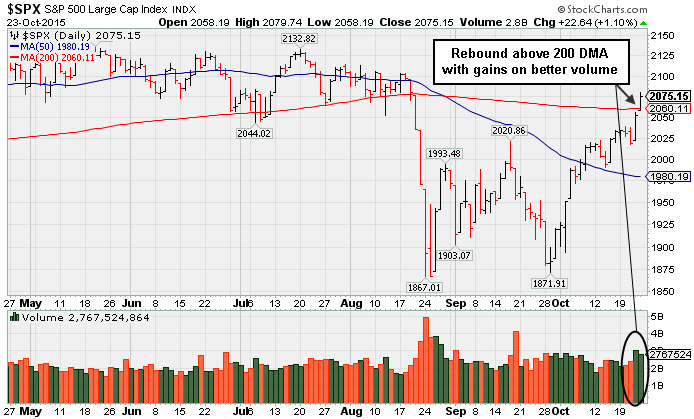
Indices Rebounded Above 200-Day Moving Average Lines
Kenneth J. Gruneisen - Passed the CAN SLIM® Master's Exam
For the week, the Dow gained 2.5%, while the S&P 500 advanced 2.1% and the NASDAQ added 3%. All 3 indices rebounded above their 200-day moving averages lines, respectively, as stocks finished higher on Friday. The Dow was up 157 points to 17646. The S&P 500 added 22 points to 2075. The NASDAQ advanced 111 points to 5031. The volume totals were reported near the prior session totals but slightly lighter on the NYSE and slightly higher on the Nasdaq exchange. Breadth was positive as advancers led decliners by a 3-2 margin on the NYSE and by 2-1 on the Nasdaq exchange. Leadership improved as there were 89 stocks that made it onto the BreakOuts Page, up from the prior session total of 60 high-ranked companies from the Leaders List that made a new 52-week high. The new 52-week highs totals expanded and outnumbered new 52-week lows on the NYSE, however new lows again narrowly outnumbered new highs on the Nasdaq exchange. There were gains for 5 of the 6 high-ranked companies currently on the Featured Stocks Page.
PICTURED: The S&P 500 Index posted gains with better volume for its best close of the recovery and rebounded above its 200-day moving average (DMA) line.
The major indices have established a confirmed uptrend (M criteria). Coupled with a reassuring expansion in leadership (stocks hitting new 52-week highs) Friday's big gains helped the S&P 500 Index, Dow Jones Industrial Average, and Nasdaq Composite Index unanimously rally above their respective 200-day moving average lines. The market environment is technically in healthier shape. New buying efforts may be considered in stocks meeting all key criteria, and some new candidates have met the strict guidelines of the fact-based investment system in the recent recovery.
The major averages caught a tailwind from encouraging earnings releases after the close on Thursday. In U.S. economic news, a preliminary reading of manufacturing PMI this month came in higher than expected. Overseas, markets in Europe and Asia were propelled by stimulus measures from the European Central Bank and the Peoples Bank of China.
Six sectors in the S&P 500 finished higher on the session. Tech and healthcare stocks paced the gains while the energy and utilities sectors underperformed. In earnings, Amazon (AMZN +6.23%) rose after posting a surprise profit in the third quarter. Alphabet (GOOG +7.7%) and Microsoft (MSFT +10.08%) jumped after each company handily beat profit expectations from analysts. Proctor and Gamble (PG +2.91%) after beating on the bottom line but coming up short on revenue. On the downside, Pandora (P -35.44%) fell after the company fell short on key earnings metrics.
Treasuries sold off. The 10-year note lost 16/32 to yield 2.08%. Commodities were mostly lower. NYMEX WTI crude slid 1.5% to $44.69/barrel. COMEX gold was off 0.3% to $1163.30/ounce. Valeant ( VRX) halted its steep slide on Friday following damaging losses. When recently revisited in the "Featured Stock Update" section of the Tuesday evening report (read here). members were reminded - "Previously featured stocks which were dropped can serve as educational examples of the investment system's tactics. It is also a reminder that high-ranked leaders eventually fall out of favor. The action demonstrates the importance of recognizing sell signals and limiting losses if any stock falls more than -7% from your purchase price. "
The number of stocks on the Featured Stocks Page remains low but saw some new names recently added while many were dropped due to market conditions. The most current notes with headline links help members have access to more detailed letter-by-letter analysis including price/volume graphs annotated by our experts. See the Premium Member Homepage for archives to all prior pay reports.
|
 Kenneth J. Gruneisen started out as a licensed stockbroker in August 1987, a couple of months prior to the historic stock market crash that took the Dow Jones Industrial Average down -22.6% in a single day. He has published daily fact-based fundamental and technical analysis on high-ranked stocks online for two decades. Through FACTBASEDINVESTING.COM, Kenneth provides educational articles, news, market commentary, and other information regarding proven investment systems that work in good times and bad.
Comments contained in the body of this report are technical opinions only and are not necessarily those of Gruneisen Growth Corp. The material herein has been obtained from sources believed to be reliable and accurate, however, its accuracy and completeness cannot be guaranteed. Our firm, employees, and customers may effect transactions, including transactions contrary to any recommendation herein, or have positions in the securities mentioned herein or options with respect thereto. Any recommendation contained in this report may not be suitable for all investors and it is not to be deemed an offer or solicitation on our part with respect to the purchase or sale of any securities. |
|
 |
Financial, Tech, and Gold & Silver Index Led Group Gainers
Kenneth J. Gruneisen - Passed the CAN SLIM® Master's Exam
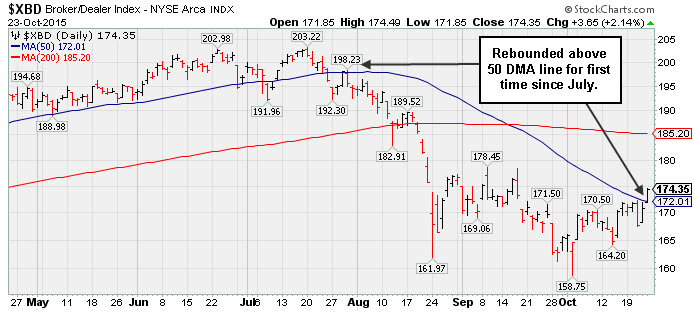
The Broker/Dealer Index ($XBD +2.14%) and the Bank Index ($BKX +2.16%) both posted solid gains as financial shares again on Friday provided positive influence on the major averages. The Retail Index ($RLX +0.78%) rose less than +1%. The Gold & Silver Index ($XAU +2.58%) posted a solid gain. Energy-related shares were mixed as the Oil Services Index ($OSX +0.21%) inched higher and the Integrated Oil Index ($XOI -0.20%) edged lower. The Networking Index ($NWX +2.89%) and the Biotechnology Index ($BTK +2.45%) led the tech sector higher, meanwhile the Semiconductor Index ($SOX +1.15%) posted a smaller gain.
PICTURED: The Broker/Dealer Index ($XBD +2.14%) rebounded above its 50-day moving (DMA) line for the first time since July. Financial shares have historically been reliable leading indicators for the broader market outlook, and the major averages have been prone to their worst downdrafts when financial groups are weak. Friday's technical improvement was a reassuring sign, but any subsequent deterioration could be a more worrisome sign.
| Oil Services |
$OSX |
179.48 |
+0.38 |
+0.21% |
-14.89% |
| Integrated Oil |
$XOI |
1,201.93 |
-2.41 |
-0.20% |
-10.84% |
| Semiconductor |
$SOX |
683.71 |
+7.76 |
+1.15% |
-0.46% |
| Networking |
$NWX |
393.04 |
+11.03 |
+2.89% |
+9.81% |
| Broker/Dealer |
$XBD |
174.35 |
+3.65 |
+2.14% |
-5.57% |
| Retail |
$RLX |
1,247.92 |
+9.71 |
+0.78% |
+20.84% |
| Gold & Silver |
$XAU |
56.30 |
+1.41 |
+2.57% |
-18.14% |
| Bank |
$BKX |
73.23 |
+1.55 |
+2.16% |
-1.39% |
| Biotech |
$BTK |
3,433.54 |
+82.00 |
+2.45% |
-0.16% |
|
|
|
 |
Finished Strong But Approaching Prior Resistance
Kenneth J. Gruneisen - Passed the CAN SLIM® Master's Exam
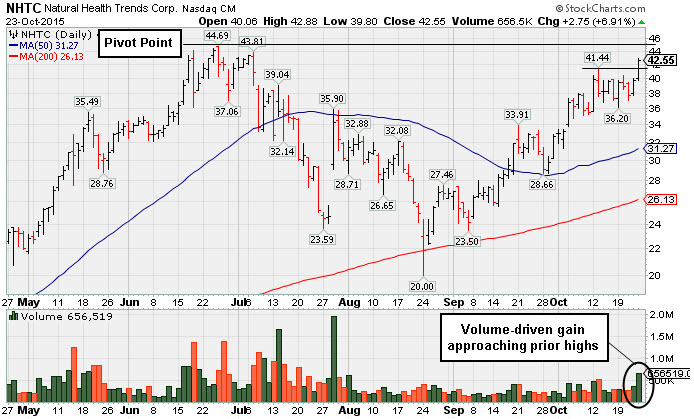
Natural Health Trends (NHTC +$2.75 or +6.91% to $42.55) rose above recent highs and was highlighted in yellow with new pivot point cited based on its 6/25/15 high pus 10 cents in the earlier mid-day report (read here). Subsequent volume-driven gains for new highs are still needed to trigger a proper technical buy signal. It has been making progress through resistance, but still faces some overhead supply up through the $44 level. Patience and discipline are paramount. A move to new highs would be a convincing sign of fresh instituitional buying demand that might mark the beginning of a substantial new leg up in price. The high-ranked Cosmetics / Personal Care firm's shares found support at the 200 DMA line during a deep 4-month cup shaped base.
Keep in mind it is due to report Sep '15 quarterly earnings on Tuesday, 10/27/15, and volume and volatility often increase near earnings news. The Dallas, TX based firm has only 7.80 million shares (S criteria) in the public float, which also may contribute to greater price volatility. Quarterly comparisons through Jun '15 showed strong sales and earnings increases well above the +25% minimum guideline (C criteria). Earnings rose +767%, +513%, +250%, +221%, +108%, and +100% in the Mar, Jun, Sep, Dec '14, Mar and Jun '15 quarters, verus the year earlier periods, respectively. Sales revenues rose +168%, +223%, +124%, 85%, +76%, and +104% during than span.
There are 107 top-rated funds reportedly owning an interest through Sep '15, up from only 2 in Dec '14, a reassuring sign concerning the I criteria.It has a Timeliness Rating of A and a Sponsorship Rating of B. The current Up/Down Volume Ratio of 1.2 also is an unbiased indication its shares have been under accumulation over the past 50 days.
|
|
|
Color Codes Explained :
Y - Better candidates highlighted by our
staff of experts.
G - Previously featured
in past reports as yellow but may no longer be buyable under the
guidelines.
***Last / Change / Volume data in this table is the closing quote data***
Symbol/Exchange
Company Name
Industry Group |
PRICE |
CHANGE
(%Change) |
Day High |
Volume
(% DAV)
(% 50 day avg vol) |
52 Wk Hi
% From Hi |
Featured
Date |
Price
Featured |
Pivot Featured |
|
Max Buy |
SFNC
-
NASDAQ
Simmons First Natl Cp A
BANKING - Regional - Southeast Banks
|
$52.43
|
+0.43
0.83% |
$52.43
|
301,277
175.16% of 50 DAV
50 DAV is 172,000
|
$52.76
-0.62%
|
10/22/2015
|
$50.13
|
PP = $48.98
|
|
MB = $51.43
|
 Most Recent Note - 10/23/2015 5:32:09 PM
G - Color code is changed to green after rallying beyond its "max buy" level. Finished strong after highlighted in yellow with pivot point cited based on its 9/17/15 high plus 10 cents in the 10/22/15 mid-day report (read here). The big gain with 4 times average volume triggered a technical buy signal and no resistance remains due to overhead supply. Reported earnings +35% on +77% sales revenues for the Sep '15 quarter, and prior quarterly comparisons had earnings strong and steady above the +25% minimum earnings guideline (C criteria). See the latest FSU analysis for more details and an annotated graph.
>>> FEATURED STOCK ARTICLE : Triple Average Volume Behind Spike to New HIgh Territory - 10/22/2015 |
View all notes |
Set NEW NOTE alert |
Company Profile |
SEC
News |
Chart |
Request a new note
C
A
S
I |
MANH
-
NASDAQ
Manhattan Associates Inc
COMPUTER SOFTWARE and SERVICES - Technical and System Software
|
$74.49
|
+3.09
4.33% |
$74.60
|
829,320
166.20% of 50 DAV
50 DAV is 499,000
|
$71.99
3.47%
|
10/21/2015
|
$69.18
|
PP = $69.91
|
|
MB = $73.41
|
Most Recent Note - 10/23/2015 5:34:41 PM
G - Color code is changed to green after rallying beyond its "max buy" level with today's 3rd consecutive volume-driven gain for new highs. Prior highs in the $69 area define initial support to watch on pullbacks.
>>> FEATURED STOCK ARTICLE : Finished Strong With Gain Backed By Heavy Volume - 10/21/2015 |
View all notes |
Set NEW NOTE alert |
Company Profile |
SEC
News |
Chart |
Request a new note
C
A
S
I |
ULTA
-
NASDAQ
Ulta Salon Cosm & Frag
SPECIALTY RETAIL - Specialty Retail, Other
|
$165.91
|
-2.11
-1.26% |
$169.92
|
557,821
57.33% of 50 DAV
50 DAV is 973,000
|
$176.77
-6.14%
|
10/22/2015
|
$168.02
|
PP = $170.31
|
|
MB = $178.83
|
Most Recent Note - 10/22/2015 6:53:54 PM
Y - Consolidating above its 50 DMA line with volume totals cooling, and very little resistance remains due to overhead supply. Color code is changed to yellow with new pivot point cited based on its 9/25/15 high plus 10 cents. Subsequent volume-driven gains above the pivot point may trigger a technical buy signal.
>>> FEATURED STOCK ARTICLE : Consolidating Above 50-Day Moving Average Line - 10/12/2015 |
View all notes |
Set NEW NOTE alert |
Company Profile |
SEC
News |
Chart |
Request a new note
C
A
S
I |
FLTX
-
NYSE
Fleetmatics Group Plc
Computer Sftwr-Enterprse
|
$54.12
|
+0.57
1.06% |
$54.31
|
327,930
88.87% of 50 DAV
50 DAV is 369,000
|
$56.60
-4.37%
|
9/23/2015
|
$51.26
|
PP = $52.55
|
|
MB = $55.18
|
Most Recent Note - 10/19/2015 6:34:58 PM
Y - Still consolidating below its "max buy" level. Prior highs in the $52 area acted as support. See the latest FSU analysis for more details and a new annotated graph.
>>> FEATURED STOCK ARTICLE : Found Support Above Prior Highs Following Breakout - 10/19/2015 |
View all notes |
Set NEW NOTE alert |
Company Profile |
SEC
News |
Chart |
Request a new note
C
A
S
I |
LXFT
-
NYSE
Luxoft Holding Inc Cl A
Comp Sftwr-Spec Enterprs
|
$69.65
|
+3.00
4.50% |
$70.94
|
591,383
239.43% of 50 DAV
50 DAV is 247,000
|
$68.85
1.16%
|
10/22/2015
|
$66.65
|
PP = $68.95
|
|
MB = $72.40
|
Most Recent Note - 10/23/2015 5:37:59 PM
Y - Gapped up today and hit a new 52-week high. Color code was changed to yellow with new pivot point cited based on its 9/17/15 high plus 10 cents. The gain above the pivot point with +140% above average volume triggered a new (or add-on) technical buy signal, whereas a weak finish in the lower third of its intra-day range or below the pivot point would have been a sign of distributional pressure. Found support above its 50 DMA line while building a new flat base. No resistance remains due to overhead supply.
>>> FEATURED STOCK ARTICLE : Consolidating After Rebound Above 50-Day Moving Average - 10/13/2015 |
View all notes |
Set NEW NOTE alert |
Company Profile |
SEC
News |
Chart |
Request a new note
C
A
S
I |
Symbol/Exchange
Company Name
Industry Group |
PRICE |
CHANGE
(%Change) |
Day High |
Volume
(% DAV)
(% 50 day avg vol) |
52 Wk Hi
% From Hi |
Featured
Date |
Price
Featured |
Pivot Featured |
|
Max Buy |
NHTC
-
NASDAQ
Natural Health Trends
Cosmetics/Personal Care
|
$42.55
|
+2.75
6.91% |
$42.88
|
655,897
268.81% of 50 DAV
50 DAV is 244,000
|
$44.75
-4.92%
|
10/23/2015
|
$42.12
|
PP = $44.85
|
|
MB = $47.09
|
Most Recent Note - 10/23/2015 5:30:34 PM
Y - Finished strong after highlighted in yellow with new pivot point cited based on its 6/25/15 high pus 10 cents in the earlier mid-day report. Subsequent volume-driven gains for new highs are still needed to trigger a proper technical buy signal. Making progress through resistance, still facing some overhead supply up through the $44 level. Due to report Sep '15 quarterly earnings on Tuesday, 10/27/15, and volume and volatility often increase near earnings news. Found support at its 200 DMA line during its deep 4-month cup shaped base. There are 107 top-rated funds reportedly owning an interest through Sep '15, and it has only 7.80 million shares (S criteria) in the public float. Quarterly comparisons through Jun '15 showed strong sales and earnings increases well above the +25% minimum guideline (C criteria). Patience and discipline are paramount. See the latest FSU analysis for more details and a new annotated graph.
There are no Featured Stock Updates™ available for this stock at this time. You may request one by clicking the Request a New Note link below |
View all notes |
Set NEW NOTE alert |
Company Profile |
SEC
News |
Chart |
Request a new note
C
A
S
I |
|
|
|
THESE ARE NOT BUY RECOMMENDATIONS!
Comments contained in the body of this report are technical
opinions only. The material herein has been obtained
from sources believed to be reliable and accurate, however,
its accuracy and completeness cannot be guaranteed.
This site is not an investment advisor, hence it does
not endorse or recommend any securities or other investments.
Any recommendation contained in this report may not
be suitable for all investors and it is not to be deemed
an offer or solicitation on our part with respect to
the purchase or sale of any securities. All trademarks,
service marks and trade names appearing in this report
are the property of their respective owners, and are
likewise used for identification purposes only.
This report is a service available
only to active Paid Premium Members.
You may opt-out of receiving report notifications
at any time. Questions or comments may be submitted
by writing to Premium Membership Services 665 S.E. 10 Street, Suite 201 Deerfield Beach, FL 33441-5634 or by calling 1-800-965-8307
or 954-785-1121.
|
|
|