You are not logged in.
This means you
CAN ONLY VIEW reports that were published prior to Wednesday, April 2, 2025.
You
MUST UPGRADE YOUR MEMBERSHIP if you want to see any current reports.
AFTER MARKET UPDATE - WEDNESDAY, OCTOBER 21ST, 2015
Previous After Market Report Next After Market Report >>>
|
|
|
|
DOW |
-48.50 |
17,168.61 |
-0.28% |
|
Volume |
835,295,960 |
+8% |
|
Volume |
1,739,917,550 |
+12% |
|
NASDAQ |
-40.85 |
4,840.12 |
-0.84% |
|
Advancers |
879 |
29% |
|
Advancers |
734 |
26% |
|
S&P 500 |
-11.83 |
2,018.94 |
-0.58% |
|
Decliners |
2,176 |
71% |
|
Decliners |
2,094 |
74% |
|
Russell 2000 |
-18.32 |
1,144.95 |
-1.58% |
|
52 Wk Highs |
72 |
|
|
52 Wk Highs |
55 |
|
|
S&P 600 |
-10.50 |
678.03 |
-1.52% |
|
52 Wk Lows |
43 |
|
|
52 Wk Lows |
76 |
|
|
 |
Breadth Negative as Major Indices Ended Slightly Lower
Kenneth J. Gruneisen - Passed the CAN SLIM® Master's Exam
The volume totals were reported higher than the prior session total on the NYSE and on the Nasdaq exchange, revealing distributional pressure behind the indices' small losses on Wednesday. Breadth was negative as decliners led advancers by more than 2-1 on the NYSE and by nearly 3-1 on the Nasdaq exchange. There were 42 stocks that made it onto the BreakOuts Page, matching the prior session total of 42 high-ranked companies from the Leaders List that made a new 52-week high. New 52-week highs outnumbered new 52-week lows on the NYSE, but new lows outnumbered new highs on the Nasdaq exchange. There were losses for 3 of the 4 high-ranked companies currently on the Featured Stocks Page.
PICTURED: The Dow Jones Industrial Average recently recovered above its 50-day moving average (DMA) line but remains below its 200 DMA line and it faces resistance due to overhead supply. The long-term average has been downward sloping since August.
New buying efforts may be considered only in stocks meeting all key criteria. Very few candidates have met the strict guidelines of the fact-based investment system in the recent recovery. The major indices established a confirmed uptrend (M criteria), however the S&P 500 Index and Dow Jones Industrial Average both remain well below their 200-day moving average lines. At least 2 of the 3 major indices should be trading above their respective 200-day moving average (DMA) lines in order for a market environment to be considered technically "healthy". The major averages are climbing as investors digest mostly upbeat earnings
reports. Seven of 10 S&P 500 sectors are in positive territory. Industrials
are up the most as Boeing (BA +1.66%) rose after topping earnings
estimates. The new General Motors Company (GM +5.79%) lifted discretionary stocks afer
beating on top and bottom lines. Biogen (BIIB +3.96%) rose after it announced impressive quarterly results,
as well as labor force cuts. However,
overnight disappointments had Yahoo! (YHOO -5.21%) and Chipotle (CMG -5.66%)
both coming under pressure.
On the M&A front, KLA-Tencor (KLAC +18.79%) rose after agreeing to
be acquired for approximately $10.6 billion by Lam Research (LRCX +1.09%). SanDisk (SNDK +2.11%) rose on the heels of formally accepting
Western Digital’s (WDC -4.57%) takeout offer. In
other news, Valeant (VRX -19.17%) hurt health care stocks as it tumbled
amid reports of corporate malfeasance.
The number of stocks listed to the Featured Stocks Page waned during deteriorating market conditions. The most current notes with headline links help members have access to more detailed letter-by-letter analysis including price/volume graphs annotated by our experts. See the Premium Member Homepage for archives to all prior pay reports.
|
 Kenneth J. Gruneisen started out as a licensed stockbroker in August 1987, a couple of months prior to the historic stock market crash that took the Dow Jones Industrial Average down -22.6% in a single day. He has published daily fact-based fundamental and technical analysis on high-ranked stocks online for two decades. Through FACTBASEDINVESTING.COM, Kenneth provides educational articles, news, market commentary, and other information regarding proven investment systems that work in good times and bad.
Comments contained in the body of this report are technical opinions only and are not necessarily those of Gruneisen Growth Corp. The material herein has been obtained from sources believed to be reliable and accurate, however, its accuracy and completeness cannot be guaranteed. Our firm, employees, and customers may effect transactions, including transactions contrary to any recommendation herein, or have positions in the securities mentioned herein or options with respect thereto. Any recommendation contained in this report may not be suitable for all investors and it is not to be deemed an offer or solicitation on our part with respect to the purchase or sale of any securities. |
|
 |
Financial & Commodity-Linked Groups Led Pullback
Kenneth J. Gruneisen - Passed the CAN SLIM® Master's Exam
Financial shares were a negative influence as the Broker/Dealer Index ($XBD -2.32%) and the Bank Index ($BKX -1.38%) both pulled back after meeting resistance at their respective 50-day moving average (DMA) lines. The Retail Index ($RLX -0.22%) edged lower. The Semiconductor Index ($SOX +0.22%) eked out a small gain but losses for the Biotechnology Index ($BTK -0.41%) and the Networking Index ($NWX -1.63%) weighed on the tech sector. Commodity-linked groups faced pressure again as the Gold & Silver Index ($XAU -3.59%) and Oil Services Index ($OSX -1.40%) and the Integrated Oil Index ($XOI -1.20%) ended lower.
PICTURED: The Networking Index ($NWX -1.63%) pulled back and closed near its 200-day moving (DMA) line. The 50 DMA line recently undercut the 200 DMA line, and subsequent deterioration back below the 50 DMA line toward recent lows would be a bad sign for the previously strong tech group.
| Oil Services |
$OSX |
176.13 |
-2.50 |
-1.40% |
-16.47% |
| Integrated Oil |
$XOI |
1,176.37 |
-14.43 |
-1.21% |
-12.74% |
| Semiconductor |
$SOX |
653.24 |
+1.37 |
+0.21% |
-4.90% |
| Networking |
$NWX |
373.74 |
-6.17 |
-1.63% |
+4.42% |
| Broker/Dealer |
$XBD |
167.76 |
-3.96 |
-2.30% |
-9.14% |
| Retail |
$RLX |
1,226.95 |
-2.71 |
-0.22% |
+18.81% |
| Gold & Silver |
$XAU |
53.65 |
-1.99 |
-3.58% |
-22.00% |
| Bank |
$BKX |
70.47 |
-0.98 |
-1.37% |
-5.10% |
| Biotech |
$BTK |
3,341.46 |
-13.90 |
-0.41% |
-2.84% |
|
|
|
 |
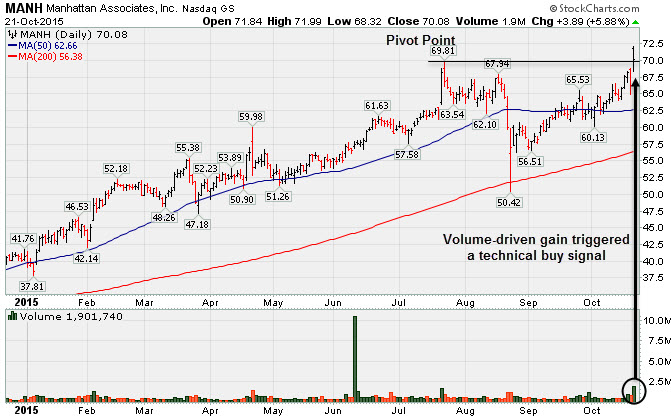
Finished Strong With Gain Backed By Heavy Volume
Kenneth J. Gruneisen - Passed the CAN SLIM® Master's Exam
Manhattan Associates Inc (MANH +$3.89 or +5.88% to $70.08) hit a new all-time high with today's considerable gain while rising from a choppy 3-month base. It was highlighted in yellow with pivot point cited based on its 7/23/15 high plus 10 cents in the earlier mid-day report (read here). It reported earnings +31% on +13% sales revenues for the Sep '15 quarter, its 4th consecutive quarterly comparison above the +25% minimum earnings guideline (C criteria). The Computer Software group has shown a good leadership (L criteria). MANH has a 98 Earnings Per Share (EPS) rating. Its Relative Strength line recently rallied to new highs ahead of the shares' move into new high territory, a reassuring sign. It has a small supply of 73.4 million shares (S criteria) outstanding, which can contribute to volatility in the event of institutional buying or selling. MANH was previously noted on 7/22/15 - "Patient investors may watch for a new base or secondary buy point to possibly develop and be noted in the weeks ahead. Following a downturn in its FY '09 earnings (A criteria) it has shown strong earnings growth." Charts courtesy www.stockcharts.com
 |
|
|
Color Codes Explained :
Y - Better candidates highlighted by our
staff of experts.
G - Previously featured
in past reports as yellow but may no longer be buyable under the
guidelines.
***Last / Change / Volume data in this table is the closing quote data***
Symbol/Exchange
Company Name
Industry Group |
PRICE |
CHANGE
(%Change) |
Day High |
Volume
(% DAV)
(% 50 day avg vol) |
52 Wk Hi
% From Hi |
Featured
Date |
Price
Featured |
Pivot Featured |
|
Max Buy |
MANH
-
NASDAQ
Manhattan Associates Inc
COMPUTER SOFTWARE and SERVICES - Technical and System Software
|
$70.08
|
+3.89
5.88% |
$71.99
|
1,901,740
381.11% of 50 DAV
50 DAV is 499,000
|
$69.81
0.39%
|
10/21/2015
|
$69.18
|
PP = $69.91
|
|
MB = $73.41
|
 Most Recent Note - 10/21/2015 11:35:21 PM
Y - Hit a new all-time high with today's considerable gain clearing a choppy 3-month base. Highlighted in yellow with pivot point cited based on its 7/23/15 high plus 10 cents in the mid-day report. Reported earnings +31% on +13% sales revenues for the Sep '15 quarter, its 4th consecutive quarterly comparison above the +25% minimum earnings guideline (C criteria) and it has shown strong annual earnings growth (A criteria). See the latest FSU analysis for more details and a new annotated graph.
>>> FEATURED STOCK ARTICLE : Finished Strong With Gain Backed By Heavy Volume - 10/21/2015 |
View all notes |
Set NEW NOTE alert |
Company Profile |
SEC
News |
Chart |
Request a new note
C
A
S
I |
ULTA
-
NASDAQ
Ulta Salon Cosm & Frag
SPECIALTY RETAIL - Specialty Retail, Other
|
$168.22
|
-0.99
-0.59% |
$170.13
|
438,388
45.06% of 50 DAV
50 DAV is 973,000
|
$176.77
-4.84%
|
5/29/2015
|
$155.03
|
PP = $159.95
|
|
MB = $167.95
|
Most Recent Note - 10/16/2015 3:51:53 PM
G - Rebounding above its 50 DMA line with today's big gain. It has not formed a sound base following the deep shakeout on 8/24/15.
>>> FEATURED STOCK ARTICLE : Consolidating Above 50-Day Moving Average Line - 10/12/2015 |
View all notes |
Set NEW NOTE alert |
Company Profile |
SEC
News |
Chart |
Request a new note
C
A
S
I |
FLTX
-
NYSE
Fleetmatics Group Plc
Computer Sftwr-Enterprse
|
$53.72
|
-0.72
-1.32% |
$55.16
|
186,512
50.55% of 50 DAV
50 DAV is 369,000
|
$56.60
-5.08%
|
9/23/2015
|
$51.26
|
PP = $52.55
|
|
MB = $55.18
|
Most Recent Note - 10/19/2015 6:34:58 PM
Y - Still consolidating below its "max buy" level. Prior highs in the $52 area acted as support. See the latest FSU analysis for more details and a new annotated graph.
>>> FEATURED STOCK ARTICLE : Found Support Above Prior Highs Following Breakout - 10/19/2015 |
View all notes |
Set NEW NOTE alert |
Company Profile |
SEC
News |
Chart |
Request a new note
C
A
S
I |
LXFT
-
NYSE
Luxoft Holding Inc Cl A
Comp Sftwr-Spec Enterprs
|
$65.02
|
-0.15
-0.23% |
$66.06
|
156,284
63.27% of 50 DAV
50 DAV is 247,000
|
$68.85
-5.56%
|
5/26/2015
|
$51.90
|
PP = $57.40
|
|
MB = $60.27
|
Most Recent Note - 10/20/2015 7:36:31 PM
G - Still consolidating above its 50 DMA line ($63.80). Little resistance remains due to overhead supply however it has not formed a sound base.
>>> FEATURED STOCK ARTICLE : Consolidating After Rebound Above 50-Day Moving Average - 10/13/2015 |
View all notes |
Set NEW NOTE alert |
Company Profile |
SEC
News |
Chart |
Request a new note
C
A
S
I |
|
|
|
THESE ARE NOT BUY RECOMMENDATIONS!
Comments contained in the body of this report are technical
opinions only. The material herein has been obtained
from sources believed to be reliable and accurate, however,
its accuracy and completeness cannot be guaranteed.
This site is not an investment advisor, hence it does
not endorse or recommend any securities or other investments.
Any recommendation contained in this report may not
be suitable for all investors and it is not to be deemed
an offer or solicitation on our part with respect to
the purchase or sale of any securities. All trademarks,
service marks and trade names appearing in this report
are the property of their respective owners, and are
likewise used for identification purposes only.
This report is a service available
only to active Paid Premium Members.
You may opt-out of receiving report notifications
at any time. Questions or comments may be submitted
by writing to Premium Membership Services 665 S.E. 10 Street, Suite 201 Deerfield Beach, FL 33441-5634 or by calling 1-800-965-8307
or 954-785-1121.
|
|
|


