You are not logged in.
This means you
CAN ONLY VIEW reports that were published prior to Tuesday, April 1, 2025.
You
MUST UPGRADE YOUR MEMBERSHIP if you want to see any current reports.
AFTER MARKET UPDATE - THURSDAY, OCTOBER 22ND, 2015
Previous After Market Report Next After Market Report >>>
|
|
|
|
DOW |
+320.55 |
17,489.16 |
+1.87% |
|
Volume |
1,025,497,250 |
+23% |
|
Volume |
1,981,014,320 |
+14% |
|
NASDAQ |
+79.93 |
4,920.05 |
+1.65% |
|
Advancers |
2,314 |
75% |
|
Advancers |
1,879 |
65% |
|
S&P 500 |
+33.57 |
2,052.51 |
+1.66% |
|
Decliners |
786 |
25% |
|
Decliners |
1,019 |
35% |
|
Russell 2000 |
+9.58 |
1,154.52 |
+0.84% |
|
52 Wk Highs |
117 |
|
|
52 Wk Highs |
85 |
|
|
S&P 600 |
+5.97 |
684.00 |
+0.88% |
|
52 Wk Lows |
60 |
|
|
52 Wk Lows |
88 |
|
|
 |
Breadth Positive and Leadership Improved as Major Averages Posted Solid Gains
Kenneth J. Gruneisen - Passed the CAN SLIM® Master's Exam
Stocks continued their ascent as the Dow was up 320 points to 17489. The S&P 500 climbed 33 points to 2052. The NASDAQ advanced 80 points to 4920. The volume totals were reported higher than the prior session totals on the NYSE and on the Nasdaq exchange, an encouraging sign of better institutional buying demand behind the indices' gains. Breadth was positive as advancers led decliners by 3-1 on the NYSE and by 9-5 on the Nasdaq exchange. Leadership improved as there were 60 stocks that made it onto the BreakOuts Page, up from the prior session total of 42 high-ranked companies from the Leaders List that made a new 52-week high. The new 52-week highs totals expanded and outnumbered new 52-week lows on the NYSE but new lows narrowly outnumbered new highs on the Nasdaq exchange. There were gains for 3 of the 5 high-ranked companies currently on the Featured Stocks Page.
PICTURED: The Nasdaq Composite Index posted a volume-driven gain for its best close of the recovery while stopping a few points below its 200-day moving average (DMA) line. The tech-heavy index and many prior leaders, individually, face a lot of resistance due to overhead supply.
New buying efforts may be considered only in stocks meeting all key criteria. Some candidates have met the strict guidelines of the fact-based investment system in the recent recovery. The major indices have established a confirmed uptrend (M criteria), however the S&P 500 Index and Dow Jones Industrial Average both remain well below their 200-day moving average lines. At least 2 of the 3 major indices should be trading above their respective 200-day moving average (DMA) lines in order for a market environment to be considered technically "healthy".
The major averages are extended gains as investors focused on economic data and earnings. Jobless claims rose to 259,000 last week, less than expected. In housing, a gauge of home prices failed to meet expectations for August, but a measure of existing home sales in September climbed to an annualized pace of 5.55 million, more than anticipated. A leading index of economic indicators unexpectedly fell.
Most S&P 500 sectors were in positive territory. Industrials and materials were up the most. Southwest ( LUV +7.41%) rose after beating on top and bottom lines. Despite missing earnings estimate, Caterpillar ( CAT +1.98%) rose. Freeport ( FCX +0.59%) missed quarterly projections, but rose in sympathy with copper prices. In the tech world, Texas Instruments ( TXN +11.93%) and eBay ( EBAY +13.92%) both rallied on the heels of positive quarterly results. However, Kinder Morgan ( KMI ) provided shaky distribution guidance.
Valeant ( VRX -7.37%) extended its losses. It tanked especially hard since recently revisited in the "Featured Stock Update" section of the Tuesday evening report (read here). members were reminded - "Previously featured stocks which were dropped can serve as educational examples of the investment system's tactics. It is also a reminder that high-ranked leaders eventually fall out of favor. The action demonstrates the importance of recognizing sell signals and limiting losses if any stock falls more than -7% from your purchase price. "The number of stocks on the Featured Stocks Page remains low but saw some new names recently added while many were dropped due to market conditions. The most current notes with headline links help members have access to more detailed letter-by-letter analysis including price/volume graphs annotated by our experts. See the Premium Member Homepage for archives to all prior pay reports.
|
 Kenneth J. Gruneisen started out as a licensed stockbroker in August 1987, a couple of months prior to the historic stock market crash that took the Dow Jones Industrial Average down -22.6% in a single day. He has published daily fact-based fundamental and technical analysis on high-ranked stocks online for two decades. Through FACTBASEDINVESTING.COM, Kenneth provides educational articles, news, market commentary, and other information regarding proven investment systems that work in good times and bad.
Comments contained in the body of this report are technical opinions only and are not necessarily those of Gruneisen Growth Corp. The material herein has been obtained from sources believed to be reliable and accurate, however, its accuracy and completeness cannot be guaranteed. Our firm, employees, and customers may effect transactions, including transactions contrary to any recommendation herein, or have positions in the securities mentioned herein or options with respect thereto. Any recommendation contained in this report may not be suitable for all investors and it is not to be deemed an offer or solicitation on our part with respect to the purchase or sale of any securities. |
|
 |
Financial, Tech, Commodity-Linked Groups Rose
Kenneth J. Gruneisen - Passed the CAN SLIM® Master's Exam
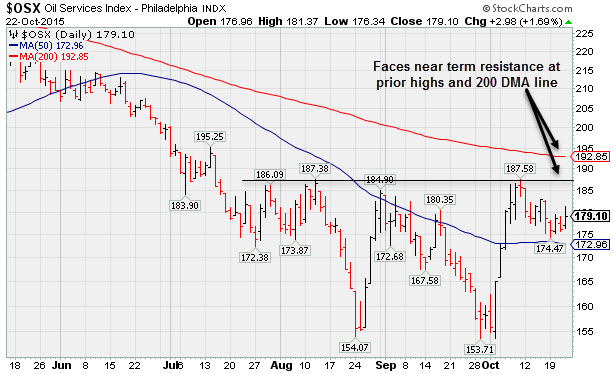
The Broker/Dealer Index ($XBD +1.75%) and the Bank Index ($BKX +1.72%) both posted solid gains as financial shares were a reassuringly positive influence on the major averages Thursday. The Retail Index ($RLX +0.92%) rose. Commodity-linked groups had a positive bias as the Gold & Silver Index ($XAU +2.31%) and Oil Services Index ($OSX +1.69%) and the Integrated Oil Index ($XOI +2.38%) each posted gains. The Semiconductor Index ($SOX +3.48%) and the Networking Index ($NWX +2.21%) led the tech sector higher, meanwhile the Biotechnology Index ($BTK +0.30%) struggled to eke out small gain. PICTURED: The Oil Services Index ($OSX +1.69%) rebounded above its 50-day moving (DMA) line and is consolidating. Prior highs and the 200 DMA line define near-term resistance. Many individual issues in the oil services industry are facing a tremendous amount of resistance due to overhead supply after spending recent years trading at much higher levels.
| Oil Services |
$OSX |
179.10 |
+2.97 |
+1.69% |
-15.07% |
| Integrated Oil |
$XOI |
1,204.34 |
+27.97 |
+2.38% |
-10.67% |
| Semiconductor |
$SOX |
675.95 |
+22.71 |
+3.48% |
-1.59% |
| Networking |
$NWX |
382.02 |
+8.27 |
+2.21% |
+6.73% |
| Broker/Dealer |
$XBD |
170.70 |
+2.94 |
+1.75% |
-7.55% |
| Retail |
$RLX |
1,238.21 |
+11.26 |
+0.92% |
+19.90% |
| Gold & Silver |
$XAU |
54.89 |
+1.24 |
+2.31% |
-20.19% |
| Bank |
$BKX |
71.68 |
+1.21 |
+1.72% |
-3.47% |
| Biotech |
$BTK |
3,351.55 |
+10.09 |
+0.30% |
-2.55% |
|
|
|
 |
Triple Average Volume Behind Spike to New HIgh Territory
Kenneth J. Gruneisen - Passed the CAN SLIM® Master's Exam
Simmons First Natl Cp (SFNC +$4.05 or +8.45% to $52.00) rallied with trading volume 3 times average and finished strong today while hitting a new high (N criteria) triggering a technical buy signal. It was highlighted in yellow with pivot point cited based on its 9/17/15 high plus 10 cents in the earlier mid-day report (read here) while noted - "A volume-driven gain today for new highs may trigger a technical buy signal. No resistance remains due to overhead supply." It hails from the Banks - Southeast industry group, a leading group which currently has a 97 Group Relative Strength rating (good L criteria). The banking firm reported earnings +35% on +77% sales revenues for the Sep '15 quarter, and prior quarterly comparisons had earnings strong and steady above the +25% minimum earnings guideline (C criteria). Annual earnings (A criteria) history has been improving after a downturn in FY '10 and '11. The number of top-rated funds owning its shares rose from 228 in Dec '14 to 269 in Sep '15, a reassuring sign concerning the I criteria. However, its current Up/Down Volume Ratio of 0.7 suggests that it has encountered distributional pressure over the past 50 days. Its small supply of only 28.7 millions shares (S criteria) in the public float can contribute to greater volatility in the event of institutional buying and selling. Charts courtesy www.stockcharts.com

|
|
|
Color Codes Explained :
Y - Better candidates highlighted by our
staff of experts.
G - Previously featured
in past reports as yellow but may no longer be buyable under the
guidelines.
***Last / Change / Volume data in this table is the closing quote data***
Symbol/Exchange
Company Name
Industry Group |
PRICE |
CHANGE
(%Change) |
Day High |
Volume
(% DAV)
(% 50 day avg vol) |
52 Wk Hi
% From Hi |
Featured
Date |
Price
Featured |
Pivot Featured |
|
Max Buy |
SFNC
-
NASDAQ
Simmons First Natl Cp A
BANKING - Regional - Southeast Banks
|
$52.00
|
+4.05
8.45% |
$52.76
|
520,320
302.51% of 50 DAV
50 DAV is 172,000
|
$49.44
5.18%
|
10/22/2015
|
$50.13
|
PP = $48.98
|
|
MB = $51.43
|
 Most Recent Note - 10/22/2015 6:48:54 PM
Y - Finished strong after highlighted in yellow with pivot point cited based on its 9/17/15 high plus 10 cents in the earlier mid-day report (read here). The big gain with 4 times average volume triggered a technical buy signal and no resistance remains due to overhead supply. Reported earnings +35% on +77% sales revenues for the Sep '15 quarter, and prior quarterly comparisons had earnings strong and steady above the +25% minimum earnings guideline (C criteria). See the latest FSU analysis for more details and a new annotated graph.
>>> FEATURED STOCK ARTICLE : Triple Average Volume Behind Spike to New HIgh Territory - 10/22/2015 |
View all notes |
Set NEW NOTE alert |
Company Profile |
SEC
News |
Chart |
Request a new note
C
A
S
I |
MANH
-
NASDAQ
Manhattan Associates Inc
COMPUTER SOFTWARE and SERVICES - Technical and System Software
|
$71.40
|
+1.32
1.88% |
$71.54
|
931,646
186.70% of 50 DAV
50 DAV is 499,000
|
$71.99
-0.82%
|
10/21/2015
|
$69.18
|
PP = $69.91
|
|
MB = $73.41
|
Most Recent Note - 10/22/2015 12:49:08 PM
Y - Up today after hitting a new all-time high with a considerable volume-driven gain triggering a technical buy signal on the prior session. Highlighted in yellow with pivot point cited based on its 7/23/15 high plus 10 cents in the 10/20/15 mid-day report (read here). Reported earnings +31% on +13% sales revenues for the Sep '15 quarter, its 4th consecutive quarterly comparison above the +25% minimum earnings guideline (C criteria) and it has shown strong annual earnings growth (A criteria). See the latest FSU analysis for more details and an annotated graph.
>>> FEATURED STOCK ARTICLE : Finished Strong With Gain Backed By Heavy Volume - 10/21/2015 |
View all notes |
Set NEW NOTE alert |
Company Profile |
SEC
News |
Chart |
Request a new note
C
A
S
I |
ULTA
-
NASDAQ
Ulta Salon Cosm & Frag
SPECIALTY RETAIL - Specialty Retail, Other
|
$168.02
|
-0.20
-0.12% |
$170.25
|
437,288
44.94% of 50 DAV
50 DAV is 973,000
|
$176.77
-4.95%
|
10/22/2015
|
$168.02
|
PP = $170.31
|
|
MB = $178.83
|
Most Recent Note - 10/22/2015 6:53:54 PM
Y - Consolidating above its 50 DMA line with volume totals cooling, and very little resistance remains due to overhead supply. Color code is changed to yellow with new pivot point cited based on its 9/25/15 high plus 10 cents. Subsequent volume-driven gains above the pivot point may trigger a technical buy signal.
>>> FEATURED STOCK ARTICLE : Consolidating Above 50-Day Moving Average Line - 10/12/2015 |
View all notes |
Set NEW NOTE alert |
Company Profile |
SEC
News |
Chart |
Request a new note
C
A
S
I |
FLTX
-
NYSE
Fleetmatics Group Plc
Computer Sftwr-Enterprse
|
$53.55
|
-0.17
-0.32% |
$54.42
|
299,803
81.25% of 50 DAV
50 DAV is 369,000
|
$56.60
-5.38%
|
9/23/2015
|
$51.26
|
PP = $52.55
|
|
MB = $55.18
|
Most Recent Note - 10/19/2015 6:34:58 PM
Y - Still consolidating below its "max buy" level. Prior highs in the $52 area acted as support. See the latest FSU analysis for more details and a new annotated graph.
>>> FEATURED STOCK ARTICLE : Found Support Above Prior Highs Following Breakout - 10/19/2015 |
View all notes |
Set NEW NOTE alert |
Company Profile |
SEC
News |
Chart |
Request a new note
C
A
S
I |
LXFT
-
NYSE
Luxoft Holding Inc Cl A
Comp Sftwr-Spec Enterprs
|
$66.65
|
+1.63
2.51% |
$66.80
|
207,751
84.11% of 50 DAV
50 DAV is 247,000
|
$68.85
-3.20%
|
10/22/2015
|
$66.65
|
PP = $68.95
|
|
MB = $72.40
|
Most Recent Note - 10/22/2015 6:59:43 PM
Y - Color code is changed to yellow with new pivot point cited based on its 9/17/15 high plus 10 cents. Subsequent volume-driven gains for new highs may trigger a new (or add-on) technical buy signal. Finding support above its 50 DMA line and building a new flat base. Little resistance remains due to overhead supply.
>>> FEATURED STOCK ARTICLE : Consolidating After Rebound Above 50-Day Moving Average - 10/13/2015 |
View all notes |
Set NEW NOTE alert |
Company Profile |
SEC
News |
Chart |
Request a new note
C
A
S
I |
Symbol/Exchange
Company Name
Industry Group |
PRICE |
CHANGE
(%Change) |
Day High |
Volume
(% DAV)
(% 50 day avg vol) |
52 Wk Hi
% From Hi |
Featured
Date |
Price
Featured |
Pivot Featured |
|
Max Buy |
|
|
|
THESE ARE NOT BUY RECOMMENDATIONS!
Comments contained in the body of this report are technical
opinions only. The material herein has been obtained
from sources believed to be reliable and accurate, however,
its accuracy and completeness cannot be guaranteed.
This site is not an investment advisor, hence it does
not endorse or recommend any securities or other investments.
Any recommendation contained in this report may not
be suitable for all investors and it is not to be deemed
an offer or solicitation on our part with respect to
the purchase or sale of any securities. All trademarks,
service marks and trade names appearing in this report
are the property of their respective owners, and are
likewise used for identification purposes only.
This report is a service available
only to active Paid Premium Members.
You may opt-out of receiving report notifications
at any time. Questions or comments may be submitted
by writing to Premium Membership Services 665 S.E. 10 Street, Suite 201 Deerfield Beach, FL 33441-5634 or by calling 1-800-965-8307
or 954-785-1121.
|
|
|