You are not logged in.
This means you
CAN ONLY VIEW reports that were published prior to Tuesday, April 1, 2025.
You
MUST UPGRADE YOUR MEMBERSHIP if you want to see any current reports.
AFTER MARKET UPDATE - MONDAY, OCTOBER 26TH, 2015
Previous After Market Report Next After Market Report >>>
|
|
|
|
DOW |
-23.65 |
17,623.05 |
-0.13% |
|
Volume |
820,009,390 |
-16% |
|
Volume |
1,598,514,840 |
-20% |
|
NASDAQ |
+2.84 |
5,034.70 |
+0.06% |
|
Advancers |
1,158 |
38% |
|
Advancers |
1,093 |
38% |
|
S&P 500 |
-3.97 |
2,071.18 |
-0.19% |
|
Decliners |
1,906 |
62% |
|
Decliners |
1,785 |
62% |
|
Russell 2000 |
-6.56 |
1,159.50 |
-0.56% |
|
52 Wk Highs |
66 |
|
|
52 Wk Highs |
107 |
|
|
S&P 600 |
-2.65 |
688.10 |
-0.38% |
|
52 Wk Lows |
53 |
|
|
52 Wk Lows |
70 |
|
|
 |
Major Averages Fell With Lighter Volume Totals
Kenneth J. Gruneisen - Passed the CAN SLIM® Master's Exam
Stocks were mixed on Monday. The Dow was off 23 points to 17622. The S&P 500 lost 3 points to 2071. The NASDAQ added 2 points to 5034. Volume totals were reported lighter on the NYSE and on the Nasdaq exchange. Breadth was negative as decliners led advancers by nearly a 2-1 margin on the NYSE and by 9-5 on the Nasdaq exchange. Leadership contracted as there were 55 stocks that made it onto the BreakOuts Page, down from the prior session total of 89 high-ranked companies from the Leaders List that made a new 52-week high. The new 52-week highs outnumbered new 52-week lows on the NYSE, and on the Nasdaq exchange. There were gains for 2 of the 6 high-ranked companies currently on the Featured Stocks Page.
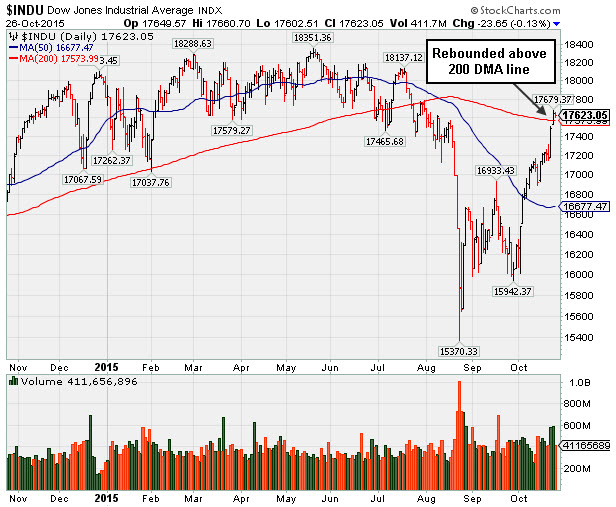
PICTURED: The Dow Jones Industrial Average recently rebounded above its 200-day moving average (DMA) line, helping its technical stance.
The major indices have established a confirmed uptrend (M criteria). Coupled with a reassuring expansion in leadership (stocks hitting new 52-week highs) Friday's big gains helped the S&P 500 Index, Dow Jones Industrial Average, and Nasdaq Composite Index unanimously rally above their respective 200-day moving average lines. The market environment is technically in healthier shape. New buying efforts may be considered in stocks meeting all key criteria, and some new candidates have met the strict guidelines of the fact-based investment system in the recent recovery.
The major averages fluctuated on light trading after a strong rally last week. In economic news, 468,000 new homes were sold in September; well below the 549,000 analysts were expecting and the lowest total since last November. In addition, August’s number was revised lower to 529,000 from 552,000. A separate release showed that October manufacturing activity in the Dallas Fed region declined more than expected.
Seven of the ten sectors in the S&P 500 finished lower on Monday. Energy companies led the declines with Exxon (XOM -2.12%). Tech stocks also underperformed with Apple (AAPL -3.19%) fell ahead of the company’s earnings release Tuesday. Consumer discretionary stocks paced the gains, led by the likes of Netflix (NFLX +3.00%). In M&A news, Piedmont Natural Gas (PNY +36.95%) after agreeing to a takeover offer from Duke Energy (DUK -2.02%). Ctrip (CTRP +22.11%) and Qunar Cayman (QUNR +7.92%) rose after the companies reached a merger agreement.
Treasuries moved higher on the session. The benchmark U.S. 10-year note was up 9/32 to yield 2.05%. Commodities were mixed. WTI crude slid 1.5% to $43.93/barrel. COMEX gold advanced 0.3% to $1167.00/ounce.
Valeant ( VRX) halted its steep slide following damaging losses. When recently revisited in the "Featured Stock Update" section of the Tuesday evening report (read here). members were reminded - "Previously featured stocks which were dropped can serve as educational examples of the investment system's tactics. It is also a reminder that high-ranked leaders eventually fall out of favor. The action demonstrates the importance of recognizing sell signals and limiting losses if any stock falls more than -7% from your purchase price. "
The Featured Stocks Page saw some new names recently added. The most current notes with headline links help members have access to more detailed letter-by-letter analysis including price/volume graphs annotated by our experts. See the Premium Member Homepage for archives to all prior pay reports.
|
 Kenneth J. Gruneisen started out as a licensed stockbroker in August 1987, a couple of months prior to the historic stock market crash that took the Dow Jones Industrial Average down -22.6% in a single day. He has published daily fact-based fundamental and technical analysis on high-ranked stocks online for two decades. Through FACTBASEDINVESTING.COM, Kenneth provides educational articles, news, market commentary, and other information regarding proven investment systems that work in good times and bad.
Comments contained in the body of this report are technical opinions only and are not necessarily those of Gruneisen Growth Corp. The material herein has been obtained from sources believed to be reliable and accurate, however, its accuracy and completeness cannot be guaranteed. Our firm, employees, and customers may effect transactions, including transactions contrary to any recommendation herein, or have positions in the securities mentioned herein or options with respect thereto. Any recommendation contained in this report may not be suitable for all investors and it is not to be deemed an offer or solicitation on our part with respect to the purchase or sale of any securities. |
|
 |
Retail Index Rose; Commodity-Linked Groups and Tech Fell
Kenneth J. Gruneisen - Passed the CAN SLIM® Master's Exam
The Retail Index ($RLX +1.31%) posted a solid gain. Financials were mixed on Monday as the Broker/Dealer Index ($XBD +0.33%) edged higher but the Bank Index ($BKX -0.66%) fell. The Gold & Silver Index ($XAU -3.13%) fell hard and energy-related shares were weak as the Oil Services Index ($OSX -2.53%) and the Integrated Oil Index ($XOI -2.32%) each was solidly lower. The Semiconductor Index ($SOX -1.98%) and Networking Index ($NWX -0.85%) dragged the tech sector lower while the Biotechnology Index ($BTK +0.95%) rose.
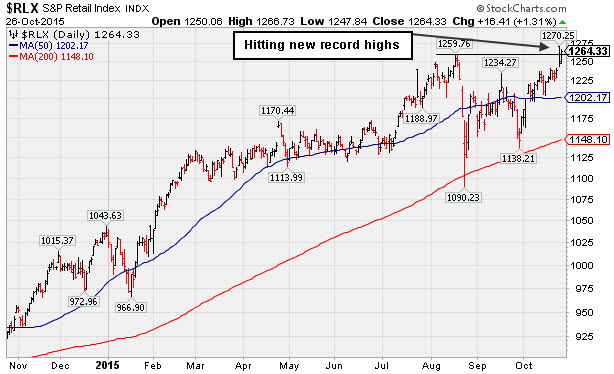
PICTURED: The Retail Index ($RLX +1.31%) has been hitting new record highs again after finding support at its 200-day moving average (DMA) line. Technical improvement and leadership by retail stocks is a very reassuring sign, since consumer spending accounts for nearly 2/3 of the US economy.
| Oil Services |
$OSX |
174.95 |
-4.53 |
-2.52% |
-17.03% |
| Integrated Oil |
$XOI |
1,174.04 |
-27.89 |
-2.32% |
-12.91% |
| Semiconductor |
$SOX |
670.19 |
-13.52 |
-1.98% |
-2.43% |
| Networking |
$NWX |
389.71 |
-3.34 |
-0.85% |
+8.88% |
| Broker/Dealer |
$XBD |
174.93 |
+0.58 |
+0.33% |
-5.26% |
| Retail |
$RLX |
1,264.33 |
+16.41 |
+1.31% |
+22.43% |
| Gold & Silver |
$XAU |
54.54 |
-1.76 |
-3.13% |
-20.70% |
| Bank |
$BKX |
72.75 |
-0.48 |
-0.66% |
-2.03% |
| Biotech |
$BTK |
3,465.70 |
+32.15 |
+0.94% |
+0.77% |
|
|
|
 |
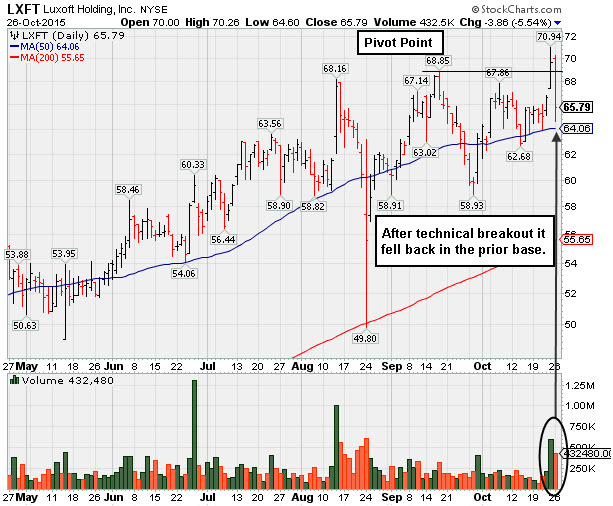
Retreat Into Prior Base Following Latest Breakout
Kenneth J. Gruneisen - Passed the CAN SLIM® Master's Exam
Luxoft Holding Inc Cl A (LXFT -$3.86 or -5.54% to $65.79) slumped back into its prior base as today's abrupt loss with +82% above average volume raised concerns. It had gapped up and hit a new 52-week high triggering a technical buy signal with Friday's big gain on heavier volume +142% above. Disciplined investors always limit losses by selling any stock that falls more than -7% from their purchase price.
The new pivot point cited was based on its 9/17/15 high plus 10 cents. It found support above its 50-day moving average (DMA) line while building a new flat base. LXFT was last shown in this FSU section on 10/13/15 with an annotated graph under the headline, "Consolidating After Rebound Above 50-Day Moving Average". It was first highlighted in yellow with a pivot point cited based on its 4/23/15 high plus 10 cents in the 5/26/15 mid-day report (read here). The high-ranked Computer Software firm is due to report Sep '15 quarterly earnings on November 10th. Earnings +36% on +32% sales revenues for the Jun '15 quarter, so it has a strong quarterly and annual earnings history (C and A criteria) matching the guidelines of the fact-based investment system. Sales revenues growth has been strong while it reported earnings +32%, +23%, +50%, and +28% in the Jun, Sep, Dec '14 and Mar '15 quarters versus the year ago periods.
The number of top-rated funds owning its shares rose from 185 in Jun '14 to 283 in Sep '15, a reassuring sign concerning the I criteria. However, its current Up/Down Volume Ratio of 0.6 is an unbiased indication its shares have been under distributional pressure over the past 50 days. It has earned a Timeliness Rating of A and a Sponsorship Rating of B. Its small supply of only 30.3 million shares (S criteria) in the public float can contribute to greater price volatility in the event of institutional buying or selling.
|
|
|
Color Codes Explained :
Y - Better candidates highlighted by our
staff of experts.
G - Previously featured
in past reports as yellow but may no longer be buyable under the
guidelines.
***Last / Change / Volume data in this table is the closing quote data***
Symbol/Exchange
Company Name
Industry Group |
PRICE |
CHANGE
(%Change) |
Day High |
Volume
(% DAV)
(% 50 day avg vol) |
52 Wk Hi
% From Hi |
Featured
Date |
Price
Featured |
Pivot Featured |
|
Max Buy |
SFNC
-
NASDAQ
Simmons First Natl Cp A
BANKING - Regional - Southeast Banks
|
$52.51
|
+0.08
0.15% |
$53.00
|
112,036
65.14% of 50 DAV
50 DAV is 172,000
|
$52.76
-0.46%
|
10/22/2015
|
$50.13
|
PP = $48.98
|
|
MB = $51.43
|
Most Recent Note - 10/23/2015 5:32:09 PM
G - Color code is changed to green after rallying beyond its "max buy" level. Finished strong after highlighted in yellow with pivot point cited based on its 9/17/15 high plus 10 cents in the 10/22/15 mid-day report (read here). The big gain with 4 times average volume triggered a technical buy signal and no resistance remains due to overhead supply. Reported earnings +35% on +77% sales revenues for the Sep '15 quarter, and prior quarterly comparisons had earnings strong and steady above the +25% minimum earnings guideline (C criteria). See the latest FSU analysis for more details and an annotated graph.
>>> FEATURED STOCK ARTICLE : Triple Average Volume Behind Spike to New HIgh Territory - 10/22/2015 |
View all notes |
Set NEW NOTE alert |
Company Profile |
SEC
News |
Chart |
Request a new note
C
A
S
I |
MANH
-
NASDAQ
Manhattan Associates Inc
COMPUTER SOFTWARE and SERVICES - Technical and System Software
|
$73.29
|
-1.20
-1.61% |
$74.85
|
571,867
114.60% of 50 DAV
50 DAV is 499,000
|
$74.60
-1.76%
|
10/21/2015
|
$69.18
|
PP = $69.91
|
|
MB = $73.41
|
Most Recent Note - 10/23/2015 5:34:41 PM
G - Color code is changed to green after rallying beyond its "max buy" level with today's 3rd consecutive volume-driven gain for new highs. Prior highs in the $69 area define initial support to watch on pullbacks.
>>> FEATURED STOCK ARTICLE : Finished Strong With Gain Backed By Heavy Volume - 10/21/2015 |
View all notes |
Set NEW NOTE alert |
Company Profile |
SEC
News |
Chart |
Request a new note
C
A
S
I |
ULTA
-
NASDAQ
Ulta Salon Cosm & Frag
SPECIALTY RETAIL - Specialty Retail, Other
|
$169.20
|
+3.29
1.98% |
$170.00
|
723,820
74.39% of 50 DAV
50 DAV is 973,000
|
$176.77
-4.28%
|
10/22/2015
|
$168.02
|
PP = $170.31
|
|
MB = $178.83
|
Most Recent Note - 10/22/2015 6:53:54 PM
Y - Consolidating above its 50 DMA line with volume totals cooling, and very little resistance remains due to overhead supply. Color code is changed to yellow with new pivot point cited based on its 9/25/15 high plus 10 cents. Subsequent volume-driven gains above the pivot point may trigger a technical buy signal.
>>> FEATURED STOCK ARTICLE : Consolidating Above 50-Day Moving Average Line - 10/12/2015 |
View all notes |
Set NEW NOTE alert |
Company Profile |
SEC
News |
Chart |
Request a new note
C
A
S
I |
FLTX
-
NYSE
Fleetmatics Group Plc
Computer Sftwr-Enterprse
|
$53.52
|
-0.60
-1.11% |
$55.15
|
277,087
75.09% of 50 DAV
50 DAV is 369,000
|
$56.60
-5.43%
|
9/23/2015
|
$51.26
|
PP = $52.55
|
|
MB = $55.18
|
 Most Recent Note - 10/26/2015 6:25:25 PM
Y - Finished near the session low with a loss today on light volume. Still consolidating in a tight range above its pivot point and below its "max buy" level. Prior highs in the $52 area acted as support.
>>> FEATURED STOCK ARTICLE : Found Support Above Prior Highs Following Breakout - 10/19/2015 |
View all notes |
Set NEW NOTE alert |
Company Profile |
SEC
News |
Chart |
Request a new note
C
A
S
I |
LXFT
-
NYSE
Luxoft Holding Inc Cl A
Comp Sftwr-Spec Enterprs
|
$65.79
|
-3.86
-5.54% |
$70.26
|
432,146
174.96% of 50 DAV
50 DAV is 247,000
|
$70.94
-7.26%
|
10/22/2015
|
$66.65
|
PP = $68.95
|
|
MB = $72.40
|
Most Recent Note - 10/26/2015 6:21:02 PM
Y - Slumped back into its prior base today raising concerns after Friday's gap up and new 52-week high triggered a technical buy signal. New pivot point cited was based on its 9/17/15 high plus 10 cents. See the latest FSU analysis for more details and a new graph.
>>> FEATURED STOCK ARTICLE : Retreat Into Prior Base Following Latest Breakout - 10/26/2015 |
View all notes |
Set NEW NOTE alert |
Company Profile |
SEC
News |
Chart |
Request a new note
C
A
S
I |
Symbol/Exchange
Company Name
Industry Group |
PRICE |
CHANGE
(%Change) |
Day High |
Volume
(% DAV)
(% 50 day avg vol) |
52 Wk Hi
% From Hi |
Featured
Date |
Price
Featured |
Pivot Featured |
|
Max Buy |
NHTC
-
NASDAQ
Natural Health Trends
Cosmetics/Personal Care
|
$41.36
|
-1.19
-2.80% |
$43.84
|
460,926
188.90% of 50 DAV
50 DAV is 244,000
|
$44.75
-7.58%
|
10/23/2015
|
$42.12
|
PP = $44.85
|
|
MB = $47.09
|
Most Recent Note - 10/26/2015 1:00:57 PM
Y - Still perched within striking distance of its 52-week high. Finished strong after highlighted in yellow in the 10/23/15 mid-day report with new pivot point cited based on its 6/25/15 high plus 10 cents - "Subsequent volume-driven gains for new highs are still needed to trigger a proper technical buy signal. Making progress through resistance, still facing some overhead supply up through the $44 level. Due to report Sep '15 quarterly earnings on Tuesday, 10/27/15, and volume and volatility often increase near earnings news. Found support at its 200 DMA line during its deep 4-month cup shaped base. There are 107 top-rated funds reportedly owning an interest through Sep '15, and it has only 7.80 million shares (S criteria) in the public float. Quarterly comparisons through Jun '15 showed strong sales and earnings increases well above the +25% minimum guideline (C criteria). Patience and discipline are paramount. See the latest FSU analysis for more details and a new annotated graph."
>>> FEATURED STOCK ARTICLE : Finished Strong But Approaching Prior Resistance - 10/23/2015 |
View all notes |
Set NEW NOTE alert |
Company Profile |
SEC
News |
Chart |
Request a new note
C
A
S
I |
|
|
|
THESE ARE NOT BUY RECOMMENDATIONS!
Comments contained in the body of this report are technical
opinions only. The material herein has been obtained
from sources believed to be reliable and accurate, however,
its accuracy and completeness cannot be guaranteed.
This site is not an investment advisor, hence it does
not endorse or recommend any securities or other investments.
Any recommendation contained in this report may not
be suitable for all investors and it is not to be deemed
an offer or solicitation on our part with respect to
the purchase or sale of any securities. All trademarks,
service marks and trade names appearing in this report
are the property of their respective owners, and are
likewise used for identification purposes only.
This report is a service available
only to active Paid Premium Members.
You may opt-out of receiving report notifications
at any time. Questions or comments may be submitted
by writing to Premium Membership Services 665 S.E. 10 Street, Suite 201 Deerfield Beach, FL 33441-5634 or by calling 1-800-965-8307
or 954-785-1121.
|
|
|