You are not logged in.
This means you
CAN ONLY VIEW reports that were published prior to Wednesday, April 2, 2025.
You
MUST UPGRADE YOUR MEMBERSHIP if you want to see any current reports.
AFTER MARKET UPDATE - MONDAY, OCTOBER 12TH, 2015
Previous After Market Report Next After Market Report >>>
|
|
|
|
DOW |
+47.37 |
17,131.86 |
+0.28% |
|
Volume |
697,115,410 |
-23% |
|
Volume |
1,236,724,070 |
-26% |
|
NASDAQ |
+8.17 |
4,838.64 |
+0.17% |
|
Advancers |
1,592 |
52% |
|
Advancers |
1,362 |
49% |
|
S&P 500 |
+2.57 |
2,017.46 |
+0.13% |
|
Decliners |
1,450 |
48% |
|
Decliners |
1,445 |
51% |
|
Russell 2000 |
-0.95 |
1,164.40 |
-0.08% |
|
52 Wk Highs |
57 |
|
|
52 Wk Highs |
74 |
|
|
S&P 600 |
+1.28 |
689.04 |
+0.19% |
|
52 Wk Lows |
11 |
|
|
52 Wk Lows |
27 |
|
|
 |
Major Averages Rose With Lighter Volume totals
Kenneth J. Gruneisen - Passed the CAN SLIM® Master's Exam
Stocks finished moderately higher on Monday. The Dow was up 47 points to 17131. The S&P 500 advanced 2 points to 2017. The NASDAQ climbed 8 points to 4838. The volume totals were reported lighter than the prior session totals on the NYSE and on the Nasdaq exchange. Breadth was even as advancers narrowly led decliners on the NYSE but decliners narrowly outnumbered advancers on the Nasdaq exchange. There were 49 stocks that made it onto the BreakOuts Page, matching the prior session total of 49 high-ranked companies from the Leaders List that made a new 52-week high. New 52-week highs outnumbered new 52-week lows on the NYSE and on the Nasdaq exchange. There were gains for 5 of the 6 high-ranked companies currently on the Featured Stocks Page.
PICTURED: The S&P 500 Index has rebounded above its 50-day moving average (DMA) line and also rallied above its prior highs. Near-term resistance to watch is at its July lows and its 200 DMA line.
The S&P 500 Index, Dow Jones Industrial Average, and Nasdaq Composite Index have rebounded above their respective 50 DMA lines. Solid follow-through gains for the major indices established a new confirmed uptrend (M criteria). However, all 3 major averages remain well below their 200-day moving average lines. Members have been repeatedly reminded in recent weeks that at least 2 of the 3 major indices should be trading above their respective 200-day moving average (DMA) lines in order for a market environment to be considered technically "healthy". Additional recovery work must be done to get the indices back into healthy shape, and that improvement could require some considerable time and patience.
The major averages continued last week’s momentum amid light trading volume. Banks and the bond market were closed for Columbus Day, so economic news was light outside of a few Federal Reserve (Fed) speakers. Over the weekend, Fed Vice Chairman Stanley Fisher reiterated that the central bank would be cautious with regards to raising rates, but that the U.S. economy will likely be strong enough to warrant a hike by the end of the year.
Seven out of ten sectors in the S&P 500 traded higher. Utilities and consumer discretionary stocks paced the gains while energy lost 1.1% to bring up the rear. Breadth was even on issues on both the NYSE and the NASDAQ. NYSE Composite volume was 2.8 billion shares.
In corporate news, EMC (EMC +1.76%) rose after agreeing to a takeover offer from Dell. Dell will create tracking stock to reflect their majority stake in VMware (VMW -8.11%). Eli Lilly (LLY -7.78%) tumbled after announcing the discontinuation of heart disease drug evacetrapib.
Commodities were mixed. WTI crude slipped 4.5% to $47.42/barrel after an OPEC release showed the highest production levels in three years. COMEX gold was up 0.7% to $1164.90/ounce. In FOREX, the dollar ebbed against the yen and euro.
The number of stocks listed to the Featured Stocks Page waned during deteriorating market conditions. The most current notes with headline links help members have access to more detailed letter-by-letter analysis including price/volume graphs annotated by our experts. See the Premium Member Homepage for archives to all prior pay reports.
|
 Kenneth J. Gruneisen started out as a licensed stockbroker in August 1987, a couple of months prior to the historic stock market crash that took the Dow Jones Industrial Average down -22.6% in a single day. He has published daily fact-based fundamental and technical analysis on high-ranked stocks online for two decades. Through FACTBASEDINVESTING.COM, Kenneth provides educational articles, news, market commentary, and other information regarding proven investment systems that work in good times and bad.
Comments contained in the body of this report are technical opinions only and are not necessarily those of Gruneisen Growth Corp. The material herein has been obtained from sources believed to be reliable and accurate, however, its accuracy and completeness cannot be guaranteed. Our firm, employees, and customers may effect transactions, including transactions contrary to any recommendation herein, or have positions in the securities mentioned herein or options with respect thereto. Any recommendation contained in this report may not be suitable for all investors and it is not to be deemed an offer or solicitation on our part with respect to the purchase or sale of any securities. |
|
 |
Commodity-Linked Groups Fell; Retail Index Rose
Kenneth J. Gruneisen - Passed the CAN SLIM® Master's Exam
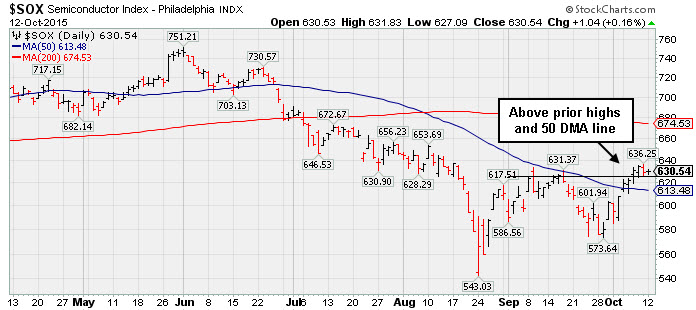
Commodity-linked groups fell and the Gold & Silver Index ($XAU -3.73%) slumped worst on Monday while the Oil Services Index ($OSX -2.91%) and the Integrated Oil Index ($XOI -0.82%) both were lower. The Retail Index ($RLX +0.85%) was higher while the Bank Index ($BKX +0.11%) and Broker/Dealer Index ($XBD +0.09%) both were essentially unchanged. The tech sector was indecisive as the Biotechnology Index ($BTK -0.17%) edged lower, the Networking Index ($NWX -0.01%) was unchanged, and the Semiconductor Index ($SOX +0.16%) inched higher.
PICTURED: The Semiconductor Index ($SOX +0.16%) is fighting to make progress above its 50-day moving average (DMA) line and prior highs.
| Oil Services |
$OSX |
180.16 |
-5.40 |
-2.91% |
-14.56% |
| Integrated Oil |
$XOI |
1,200.01 |
-9.93 |
-0.82% |
-10.99% |
| Semiconductor |
$SOX |
630.54 |
+1.03 |
+0.16% |
-8.20% |
| Networking |
$NWX |
379.90 |
+0.03 |
+0.01% |
+6.14% |
| Broker/Dealer |
$XBD |
168.13 |
+0.15 |
+0.09% |
-8.94% |
| Retail |
$RLX |
1,233.13 |
+10.45 |
+0.85% |
+19.40% |
| Gold & Silver |
$XAU |
53.95 |
-2.09 |
-3.73% |
-21.56% |
| Bank |
$BKX |
70.93 |
+0.08 |
+0.11% |
-4.48% |
| Biotech |
$BTK |
3,444.55 |
-5.77 |
-0.17% |
+0.16% |
|
|
|
 |
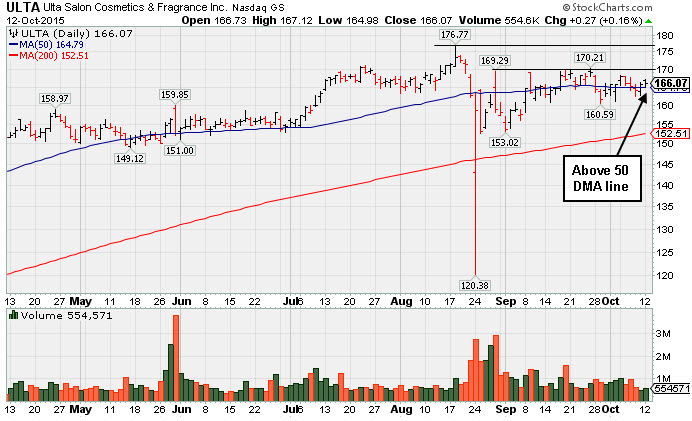
Consolidating Above 50-Day Moving Average Line
Kenneth J. Gruneisen - Passed the CAN SLIM® Master's Exam
Ulta Salon Cosmetics & Fragrance, Inc. (ULTA +$0.27 or +0.16% to $166.07) is quietly consolidating just above its 50-day moving average (DMA) line. It has not formed a sound base following the deep shakeout on 8/24/15. ULTA was last shown with an annotated graph in this FSU section on 9/21/15 under the headline, "Consolidating Above 50-Day Moving Average Line". The impressive rebound was indicative of institutional support. The high-ranked firm had tallied a gain on 8/18/15 with solid +54% above average volume, but it stalled immediately afterward and soon triggered technical sell signals. It made limited headway since highlighted in yellow with pivot point cited based on its 4/24/15 high plus 10 cents in the 5/29/15 mid-day report (read here).
For the latest quarterly period, ULTA reported earnings +22% on +19% sales revenues for the Jul '15 quarter, below the +25% minimum earnings guideline (C criteria), raising fundamental concerns. Earnings rose +34%, +26%, +22%, and +35% in the Jul '14, Oct '14, Jan '15 and Apr '15 quarterly comparisons, respectively. Its strong earnings have been underpinned by steady sales revenues increases in the +21-22% range during that span of time. Its solid annual earnings (A criteria) history is very reassuring.
It has a small supply (S criteria) of only 62.7 million shares in the public float. The number of top-rated funds with an ownership interest has grown from 566 funds in Jun '14 to 815 funds as of Jun '15, which is a very encouraging sign of increasing institutional interest (the I criteria).
|
|
|
Color Codes Explained :
Y - Better candidates highlighted by our
staff of experts.
G - Previously featured
in past reports as yellow but may no longer be buyable under the
guidelines.
***Last / Change / Volume data in this table is the closing quote data***
Symbol/Exchange
Company Name
Industry Group |
PRICE |
CHANGE
(%Change) |
Day High |
Volume
(% DAV)
(% 50 day avg vol) |
52 Wk Hi
% From Hi |
Featured
Date |
Price
Featured |
Pivot Featured |
|
Max Buy |
BOFI
-
NASDAQ
B O F I Holding Inc
BANKING - Savings andamp; Loans
|
$142.54
|
+1.46
1.03% |
$143.92
|
250,640
78.33% of 50 DAV
50 DAV is 320,000
|
$143.69
-0.80%
|
6/10/2015
|
$101.47
|
PP = $97.78
|
|
MB = $102.67
|
Most Recent Note - 10/9/2015 5:46:24 PM
G - Small loss today following a streak of 8 gains for new highs. No resistance remains due to overhead supply. The "V" shaped consolidation over the past 10 weeks is not recognized as a sound base.
>>> FEATURED STOCK ARTICLE : Rebounding Near Prior High After "V" Shaped Consolidation - 10/5/2015 |
View all notes |
Set NEW NOTE alert |
Company Profile |
SEC
News |
Chart |
Request a new note
C
A
S
I |
HAWK
-
NASDAQ
Blackhawk Network Inc
DIVERSIFIED SERVICES - Business/Management Services
|
$46.05
|
+0.11
0.24% |
$46.69
|
807,793
169.35% of 50 DAV
50 DAV is 477,000
|
$46.97
-1.96%
|
10/9/2015
|
$45.82
|
PP = $46.23
|
|
MB = $48.54
|
Most Recent Note - 10/9/2015 5:53:06 PM
Y - Finished in the lower half of its intra-day range after highlighted in yellow with new pivot point cited based on the 8/03/15 high plus 10 cents. A volume driven gain and strong close above the pivot may trigger a technical buy signal. Found support at its 200 DMA line and rebounded through overhead supply to hit a new 52-week high today. Reported earnings +36% on +31% sales revenues for the Jun '15 quarter, its 3rd consecutive quarterly comparison above the +25% minimum earnings guideline (C criteria), helping it better match the winning models of the fact-based investment system. See the latest FSU analysis for more details and an annotated graph.
>>> FEATURED STOCK ARTICLE : Met Some Resistance After Touching a New 52-Week High - 10/9/2015 |
View all notes |
Set NEW NOTE alert |
Company Profile |
SEC
News |
Chart |
Request a new note
C
A
S
I |
ULTA
-
NASDAQ
Ulta Salon Cosm & Frag
SPECIALTY RETAIL - Specialty Retail, Other
|
$166.07
|
+0.27
0.16% |
$167.12
|
554,071
57.36% of 50 DAV
50 DAV is 966,000
|
$176.77
-6.05%
|
5/29/2015
|
$155.03
|
PP = $159.95
|
|
MB = $167.95
|
 Most Recent Note - 10/12/2015 5:55:18 PM
G - Still quietly consolidating just above its 50 DMA line. It has not formed a sound base following the deep shakeout on 8/24/15. See the latest FSU analysis for more details and a new annotated graph.
>>> FEATURED STOCK ARTICLE : Consolidating Above 50-Day Moving Average Line - 10/12/2015 |
View all notes |
Set NEW NOTE alert |
Company Profile |
SEC
News |
Chart |
Request a new note
C
A
S
I |
FLTX
-
NYSE
Fleetmatics Group Plc
Computer Sftwr-Enterprse
|
$56.22
|
+0.38
0.68% |
$56.39
|
502,151
137.58% of 50 DAV
50 DAV is 365,000
|
$56.19
0.06%
|
9/23/2015
|
$51.26
|
PP = $52.55
|
|
MB = $55.18
|
Most Recent Note - 10/9/2015 11:09:30 AM
G - Color code is changed to green after rallying above its "max buy" level hitting a new 52-week high. Prior highs in the $52 area define initial support to watch on pullbacks. See the latest FSU analysis for more details and an annotated graph.
>>> FEATURED STOCK ARTICLE : Holding Ground Following Volume-Driven Breakout - 10/8/2015 |
View all notes |
Set NEW NOTE alert |
Company Profile |
SEC
News |
Chart |
Request a new note
C
A
S
I |
LXFT
-
NYSE
Luxoft Holding Inc Cl A
Comp Sftwr-Spec Enterprs
|
$65.98
|
-0.34
-0.51% |
$67.03
|
153,819
62.02% of 50 DAV
50 DAV is 248,000
|
$68.85
-4.17%
|
5/26/2015
|
$51.90
|
PP = $57.40
|
|
MB = $60.27
|
Most Recent Note - 10/9/2015 5:48:30 PM
G - Quietly consolidating above its 50 DMA line, perched within close striking distance of prior highs. Little resistance remains due to overhead supply however it has not formed a sound base.
>>> FEATURED STOCK ARTICLE : Volume-Driven Gain and Rebound Above 50-Day Moving Average Line - 9/30/2015 |
View all notes |
Set NEW NOTE alert |
Company Profile |
SEC
News |
Chart |
Request a new note
C
A
S
I |
Symbol/Exchange
Company Name
Industry Group |
PRICE |
CHANGE
(%Change) |
Day High |
Volume
(% DAV)
(% 50 day avg vol) |
52 Wk Hi
% From Hi |
Featured
Date |
Price
Featured |
Pivot Featured |
|
Max Buy |
INGN
-
NASDAQ
Inogen Inc
HEALTH SERVICES - Medical Instruments and Supplies
|
$44.47
|
+0.01
0.02% |
$44.91
|
166,071
47.72% of 50 DAV
50 DAV is 348,000
|
$55.98
-20.56%
|
8/12/2015
|
$49.01
|
PP = $45.85
|
|
MB = $48.14
|
Most Recent Note - 10/9/2015 5:51:42 PM
G - Slump well below its 50 DMA line raised concerns amid widespread losses in the Medical group. The 200 DMA line ($39.52) defines important near-term support.
>>> FEATURED STOCK ARTICLE : Met Resistance at 50-Day Moving Average Following Violation - 10/1/2015 |
View all notes |
Set NEW NOTE alert |
Company Profile |
SEC
News |
Chart |
Request a new note
C
A
S
I |
|
|
|
THESE ARE NOT BUY RECOMMENDATIONS!
Comments contained in the body of this report are technical
opinions only. The material herein has been obtained
from sources believed to be reliable and accurate, however,
its accuracy and completeness cannot be guaranteed.
This site is not an investment advisor, hence it does
not endorse or recommend any securities or other investments.
Any recommendation contained in this report may not
be suitable for all investors and it is not to be deemed
an offer or solicitation on our part with respect to
the purchase or sale of any securities. All trademarks,
service marks and trade names appearing in this report
are the property of their respective owners, and are
likewise used for identification purposes only.
This report is a service available
only to active Paid Premium Members.
You may opt-out of receiving report notifications
at any time. Questions or comments may be submitted
by writing to Premium Membership Services 665 S.E. 10 Street, Suite 201 Deerfield Beach, FL 33441-5634 or by calling 1-800-965-8307
or 954-785-1121.
|
|
|