You are not logged in.
This means you
CAN ONLY VIEW reports that were published prior to Monday, April 7, 2025.
You
MUST UPGRADE YOUR MEMBERSHIP if you want to see any current reports.
AFTER MARKET UPDATE - MONDAY, OCTOBER 3RD, 2016
Previous After Market Report Next After Market Report >>>
|
|
|
|
DOW |
-54.30 |
18,253.85 |
-0.30% |
|
Volume |
798,023,320 |
-31% |
|
Volume |
1,461,798,580 |
-22% |
|
NASDAQ |
-11.13 |
5,300.87 |
-0.21% |
|
Advancers |
1,243 |
42% |
|
Advancers |
1,176 |
41% |
|
S&P 500 |
-7.07 |
2,161.20 |
-0.33% |
|
Decliners |
1,725 |
58% |
|
Decliners |
1,664 |
59% |
|
Russell 2000 |
-5.86 |
1,245.78 |
-0.47% |
|
52 Wk Highs |
111 |
|
|
52 Wk Highs |
117 |
|
|
S&P 600 |
-2.66 |
754.24 |
-0.35% |
|
52 Wk Lows |
23 |
|
|
52 Wk Lows |
43 |
|
|
 |
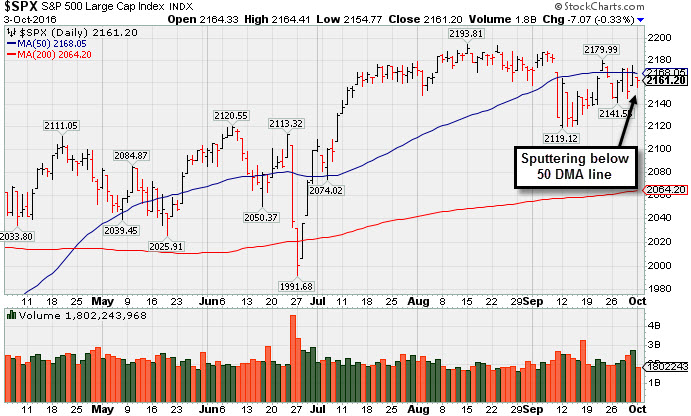
S&P 500 Index -1.5% Off Record, But Below 50-Day Moving Average
Kenneth J. Gruneisen - Passed the CAN SLIM® Master's Exam
Stocks declined modestly on Monday. The Dow was off 54 points to 18253. The S&P 500 lost 7 points to 2161 and the Nasdaq Composite fell 11 points to 5300. The volume totals were lighter than the prior session on the NYSE and on the Nasdaq exchange. Decliners led advancers by 3-2 on the NYSE and 4-3 on the Nasdaq exchange. There were 14 high-ranked companies from the Leaders List that made new 52-week highs and were listed on the BreakOuts Page, versus 30 on the prior session. New 52-week highs totals outnumbered new 52-week lows on both the NYSE and the Nasdaq exchange. PICTURED: The S&P 500 Index is sputtering below its 50-day moving average (DMA) line, still only -1.5% off record highs.
The recent move into new high territory for the Nasdaq Composite Index was noted as a sign of technical strength in the market (M criteria) reassuring investors. The S&P 500 Index is near its 50-day moving average (DMA) line, meanwhile the Dow Jones Industrial Average has still been sputtering below its 50 DMA line. The Featured Stocks Page lists noteworthy high-ranked leaders.
The major averages finished lower as investors digested updates on the manufacturing sector. Research firm Markit revealed that U.S. manufacturing PMI came in at 51.5 in September, slightly above expectations of 51.4. ISM’s gauge of manufacturing activity climbed to 51.5 in September, above August’s reading of 49.4, and projections of 50.4. Finally, construction spending unexpectedly fell 0.7% in August.
Nine out of 11 sectors in the S&P 500 finished in negative territory with Real Estate and Utilities leading the losses. Teradata (TDC -5.03%) was a notable decliner after being the subject of an analyst downgrade. In M&A news, Janus Capital (JNS +12.06%) after the asset manager agreed to merge with the U.K.’s Henderson Group. Cabela’s (CAB +15.02%) rose on news it will be acquired by a consortium led by Bass Pro Shops. Tesla (TSLA +4.74%) rose after posting quarterly auto shipments above analyst estimates.
Treasuries were lower along the curve with the 10-year note falling 8/32 to yield 1.62%. In commodities, NYMEX WTI crude added 0.9% to $48.66/barrel. COMEX gold was down 0.3% to $1309.00/ounce. In FOREX, the dollar gained on the British pound on news that Brexit proceedings will commence by the end of March. |
 Kenneth J. Gruneisen started out as a licensed stockbroker in August 1987, a couple of months prior to the historic stock market crash that took the Dow Jones Industrial Average down -22.6% in a single day. He has published daily fact-based fundamental and technical analysis on high-ranked stocks online for two decades. Through FACTBASEDINVESTING.COM, Kenneth provides educational articles, news, market commentary, and other information regarding proven investment systems that work in good times and bad.
Comments contained in the body of this report are technical opinions only and are not necessarily those of Gruneisen Growth Corp. The material herein has been obtained from sources believed to be reliable and accurate, however, its accuracy and completeness cannot be guaranteed. Our firm, employees, and customers may effect transactions, including transactions contrary to any recommendation herein, or have positions in the securities mentioned herein or options with respect thereto. Any recommendation contained in this report may not be suitable for all investors and it is not to be deemed an offer or solicitation on our part with respect to the purchase or sale of any securities. |
|
 |
Commodity-Linked Groups, Tech and Financial Groups Fell
Kenneth J. Gruneisen - Passed the CAN SLIM® Master's Exam
The Broker/Dealer Index ($XBD -0.36%) and the Bank Index ($BKX -0.34%) both edged lower and were a negative influence on the major averages while the Retail Index ($RLX -0.01%) finished flat on Monday. The Semiconductor Index ($SOX -0.73%) and Networking Index ($NWX -0.51%) ended lower while the Biotechnology Index ($BTK -0.05%) finished flat. The Gold & Silver Index ($XAU -2.06%) was a standout decliner and the Oil Services Index ($OSX -0.40%) edged lower while the Integrated Oil Index ($XOI -0.01%) was unchanged. Charts courtesy www.stockcharts.com

PICTURED: The Gold & Silver Index ($XAU -2.06%) met resistance at its 50-day moving average (DMA) line when rebounding after a slump in August.
| Oil Services |
$OSX |
162.96 |
-0.65 |
-0.40% |
+3.32% |
| Integrated Oil |
$XOI |
1,152.40 |
-0.10 |
-0.01% |
+7.43% |
| Semiconductor |
$SOX |
829.49 |
-6.11 |
-0.73% |
+25.02% |
| Networking |
$NWX |
402.22 |
-2.07 |
-0.51% |
+6.99% |
| Broker/Dealer |
$XBD |
173.07 |
-0.63 |
-0.36% |
-2.82% |
| Retail |
$RLX |
1,356.82 |
-0.19 |
-0.01% |
+5.71% |
| Gold & Silver |
$XAU |
92.07 |
-1.93 |
-2.05% |
+103.25% |
| Bank |
$BKX |
70.61 |
-0.24 |
-0.34% |
-3.38% |
| Biotech |
$BTK |
3,369.39 |
-1.62 |
-0.05% |
-11.66% |
|
|
|
 |
Seriously Applying the Fact-Based System Now
Kenneth J. Gruneisen - Passed the CAN SLIM® Master's Exam
Asset Management Services Using the Fact-Based Investment System You can have professional help in limiting your losses and maximizing your gains in all market environments. For help with how your portfolio is managed click here and indicate "Find a Broker". Account minimum $250,000. |
|
|
Color Codes Explained :
Y - Better candidates highlighted by our
staff of experts.
G - Previously featured
in past reports as yellow but may no longer be buyable under the
guidelines.
***Last / Change / Volume data in this table is the closing quote data***
Symbol/Exchange
Company Name
Industry Group |
PRICE |
CHANGE
(%Change) |
Day High |
Volume
(% DAV)
(% 50 day avg vol) |
52 Wk Hi
% From Hi |
Featured
Date |
Price
Featured |
Pivot Featured |
|
Max Buy |
TDG
-
NYSE
Transdigm Group Inc
AEROSPACE/DEFENSE - Aerospace/Defense Products and; Services
|
$289.86
|
+0.74
0.26% |
$290.20
|
164,843
51.67% of 50 DAV
50 DAV is 319,000
|
$294.38
-1.54%
|
5/11/2016
|
$248.33
|
PP = $245.00
|
|
MB = $257.25
|
Most Recent Note - 9/30/2016 5:32:11 PM
G - Quietly consolidating above its 50 DMA line ($284), extended from any sound base. Subsequent losses undercutting the 50 DMA line or recent low ($278.52) would raise greater concerns
>>> FEATURED STOCK ARTICLE : Light Volume Behind Gains Wedging for New Highs - 9/7/2016 |
View all notes |
Set NEW NOTE alert |
Company Profile |
SEC
News |
Chart |
Request a new note
C
A
S
I |
IESC
-
NASDAQ
I E S Holdings Inc
Bldg-Maintenance and Svc
|
$17.68
|
-0.11
-0.62% |
$18.15
|
120,630
143.61% of 50 DAV
50 DAV is 84,000
|
$18.16
-2.64%
|
7/26/2016
|
$15.79
|
PP = $15.74
|
|
MB = $16.53
|
 Most Recent Note - 10/3/2016 12:17:45 PM
G - Hovering near its 52-week high following a big volume-driven gain on the prior session. Recently found support at its 50 DMA line ($15.81).
>>> FEATURED STOCK ARTICLE : Wedging Higher With Recent Gains Lacking Great Volume - 9/27/2016 |
View all notes |
Set NEW NOTE alert |
Company Profile |
SEC
News |
Chart |
Request a new note
C
A
S
I |
NTES
-
NASDAQ
Netease Inc Adr
INTERNET - Internet Information Providers
|
$244.86
|
+4.08
1.69% |
$247.87
|
646,698
56.63% of 50 DAV
50 DAV is 1,142,000
|
$254.48
-3.78%
|
6/29/2016
|
$182.42
|
PP = $186.55
|
|
MB = $195.88
|
Most Recent Note - 9/30/2016 5:28:26 PM
G - Hovering near its all-time high, very extended from any sound base. Its 50 DMA line ($218) defines near-term support to watch.
>>> FEATURED STOCK ARTICLE : Extended From Prior Base After +37% Rally Since Featured 6/29/16 - 9/21/2016 |
View all notes |
Set NEW NOTE alert |
Company Profile |
SEC
News |
Chart |
Request a new note
C
A
S
I |
HTHT
-
NASDAQ
China Lodging Group Ads
LEISURE - Lodging
|
$45.64
|
+0.55
1.22% |
$45.85
|
63,373
32.17% of 50 DAV
50 DAV is 197,000
|
$47.72
-4.36%
|
9/29/2016
|
$46.12
|
PP = $47.82
|
|
MB = $50.21
|
Most Recent Note - 9/29/2016 12:37:07 PM
Y - Color code is changed to yellow with a new pivot point cited based on its 8/29/16 high plus 10 cents. Subsequent volume-driven gains for new highs may trigger a new (or add-on) technical buy signal. Volume totals cooled while stubbornly holding its ground near all-time highs in recent weeks. Recent lows and its 50 DMA line ($42.65) define near term support to watch on pullbacks.
>>> FEATURED STOCK ARTICLE : Possibly Forming New Base While Holding Ground Near Highs - 9/20/2016 |
View all notes |
Set NEW NOTE alert |
Company Profile |
SEC
News |
Chart |
Request a new note
C
A
S
I |
PATK
-
NASDAQ
Patrick Industries Inc
WHOLESALE - Building Materials Wholesale
|
$62.92
|
+1.00
1.61% |
$63.02
|
160,242
73.84% of 50 DAV
50 DAV is 217,000
|
$69.53
-9.51%
|
9/28/2016
|
$64.85
|
PP = $66.87
|
|
MB = $70.21
|
Most Recent Note - 9/30/2016 5:30:07 PM
G - Slumped below its 50 DMA line with today's loss on average volume and its color code is changed to green. Only a prompt rebound above the 50 DMA line would help its outlook improve. A new pivot point was cited based on its 9/06/16 high, however volume-driven gains are still needed to trigger a new (or add-on) technical buy signal. See the latest FSU analysis for more details and an annotated graph.
>>> FEATURED STOCK ARTICLE : Found Support While Building on a New "Double Bottom" Base Pattern - 9/28/2016 |
View all notes |
Set NEW NOTE alert |
Company Profile |
SEC
News |
Chart |
Request a new note
C
A
S
I |
Symbol/Exchange
Company Name
Industry Group |
PRICE |
CHANGE
(%Change) |
Day High |
Volume
(% DAV)
(% 50 day avg vol) |
52 Wk Hi
% From Hi |
Featured
Date |
Price
Featured |
Pivot Featured |
|
Max Buy |
LGIH
-
NASDAQ
L G I Homes Inc
Bldg-Resident/Comml
|
$36.97
|
+0.13
0.35% |
$37.21
|
253,250
48.42% of 50 DAV
50 DAV is 523,000
|
$40.47
-8.65%
|
8/29/2016
|
$37.08
|
PP = $36.44
|
|
MB = $38.26
|
Most Recent Note - 9/29/2016 5:39:56 PM
Y - Still quietly consolidating above its 50 DMA line ($35.73). Violations of the 50 DMA line and recent lows ($34.18 on 9/09/16) would raise greater concerns and trigger worrisome technical sell signals. See the latest FSU analysis for more details and a new annotated graph.
>>> FEATURED STOCK ARTICLE : 50-Day Moving Average Line Recently Acted as Support - 9/29/2016 |
View all notes |
Set NEW NOTE alert |
Company Profile |
SEC
News |
Chart |
Request a new note
C
A
S
I |
SFBS
-
NASDAQ
"ServisFirst Bancshares, Inc"
BANKING - Regional - Southeast Banks
|
$51.82
|
-0.09
-0.17% |
$51.86
|
59,265
118.29% of 50 DAV
50 DAV is 50,100
|
$53.58
-3.28%
|
7/19/2016
|
$53.28
|
PP = $52.82
|
|
MB = $55.46
|
Most Recent Note - 9/30/2016 5:26:20 PM
G - Finished the week above its 50 DMA line with a volume-driven gain. Subsequent volume-driven gains for new highs would be a very reassuring sign of institutional buying demand. Relative Strength Rating is currently 74, below the 80+ minimum guideline for buy candidates.
>>> FEATURED STOCK ARTICLE : Relative Strength Rating is Under Guidelines While Perched Near Highs - 9/22/2016 |
View all notes |
Set NEW NOTE alert |
Company Profile |
SEC
News |
Chart |
Request a new note
C
A
S
I |
INGN
-
NASDAQ
Inogen Inc
HEALTH SERVICES - Medical Instruments and Supplies
|
$59.45
|
-0.45
-0.75% |
$60.00
|
108,338
58.56% of 50 DAV
50 DAV is 185,000
|
$61.87
-3.91%
|
8/5/2016
|
$51.72
|
PP = $56.08
|
|
MB = $58.88
|
Most Recent Note - 10/3/2016 5:39:16 PM
G - Still stubbornly holding its ground, extended from any sound base. Its 50 DMA line ($57.20) defines important near-term support above its Sep '15 highs.
>>> FEATURED STOCK ARTICLE : Stubbornly Holding Ground Near All-Time High - 9/12/2016 |
View all notes |
Set NEW NOTE alert |
Company Profile |
SEC
News |
Chart |
Request a new note
C
A
S
I |
|
|
|
THESE ARE NOT BUY RECOMMENDATIONS!
Comments contained in the body of this report are technical
opinions only. The material herein has been obtained
from sources believed to be reliable and accurate, however,
its accuracy and completeness cannot be guaranteed.
This site is not an investment advisor, hence it does
not endorse or recommend any securities or other investments.
Any recommendation contained in this report may not
be suitable for all investors and it is not to be deemed
an offer or solicitation on our part with respect to
the purchase or sale of any securities. All trademarks,
service marks and trade names appearing in this report
are the property of their respective owners, and are
likewise used for identification purposes only.
This report is a service available
only to active Paid Premium Members.
You may opt-out of receiving report notifications
at any time. Questions or comments may be submitted
by writing to Premium Membership Services 665 S.E. 10 Street, Suite 201 Deerfield Beach, FL 33441-5634 or by calling 1-800-965-8307
or 954-785-1121.
|
|
|