You are not logged in.
This means you
CAN ONLY VIEW reports that were published prior to Thursday, April 3, 2025.
You
MUST UPGRADE YOUR MEMBERSHIP if you want to see any current reports.
AFTER MARKET UPDATE - THURSDAY, SEPTEMBER 29TH, 2016
Previous After Market Report Next After Market Report >>>
|
|
|
|
DOW |
-195.79 |
18,143.45 |
-1.07% |
|
Volume |
971,363,530 |
+7% |
|
Volume |
1,777,879,270 |
+6% |
|
NASDAQ |
-49.40 |
5,269.15 |
-0.93% |
|
Advancers |
625 |
21% |
|
Advancers |
700 |
24% |
|
S&P 500 |
-20.24 |
2,151.13 |
-0.93% |
|
Decliners |
2,377 |
79% |
|
Decliners |
2,196 |
76% |
|
Russell 2000 |
-17.91 |
1,237.75 |
-1.43% |
|
52 Wk Highs |
103 |
|
|
52 Wk Highs |
98 |
|
|
S&P 600 |
-9.24 |
748.98 |
-1.22% |
|
52 Wk Lows |
24 |
|
|
52 Wk Lows |
38 |
|
|
 |
Breadth Negative as Major Averages Fell With Higher Volume Totals
Kenneth J. Gruneisen - Passed the CAN SLIM® Master's Exam
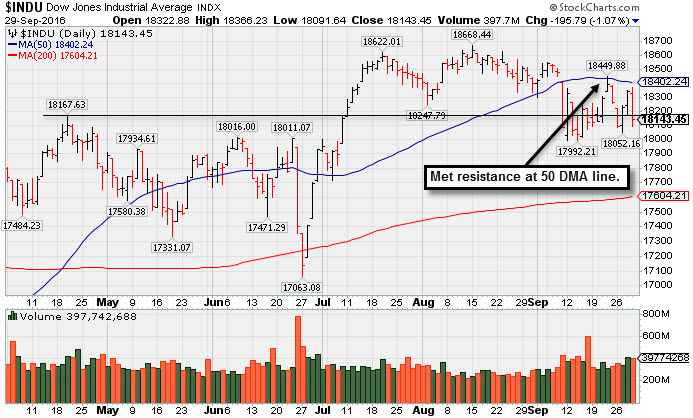
Stocks closed lower Thursday. The Dow fell 196 points to 18143. The S&P 500 slumped back below its 50-day moving average line as it lost 20 points to 2151 and the Nasdaq Composite dropped 49 points to 5269. The volume totals were higher than the prior session on the NYSE and on the Nasdaq exchange. Breadth was negative as decliners led advancers by nearly 4-1 on the NYSE and by more than 3-1 on the Nasdaq exchange. There were 35 high-ranked companies from the Leaders List that made new 52-week highs and were listed on the BreakOuts Page, versus 44 on the prior session. New 52-week highs totals outnumbered new 52-week lows on both the NYSE and the Nasdaq exchange. PICTURED: The Dow Jones Industrial Average met resistance at its 50-day moving average (DMA) line when trying to rebound following damaging volume-driven losses.
Last Thursday's move into new high territory for the Nasdaq Composite Index was a sign of technical strength in the market (M criteria) reassuring investors. The Dow Jones Industrial Average remains below its 50-day moving average (DMA) line. The Featured Stocks Page lists noteworthy high-ranked leaders.
The major averages finished firmly in negative territory led by Financials. J.P. Morgan (JPM -1.59%) and Citigroup (C -2.28%) both fell on concerns problems at Deutsche Bank (DB -6.67%) could spread across the sector. On the data front, second-quarter GDP was revised to a 1.4% annualized rate from 1.1%. Initial jobless claims ticked up 3,000 to 254,000 while pending home sales fell 2.4% in August. Atlanta President Dennis Lockhart said with employment and inflation are nearing the Fed’s stated targets, the economy may be ready higher interest rates.
Along with Financials, Health Care was the biggest drag on the market with Endo International (ENDP -6.40%). Energy was the lone sector up on the session as oil advanced after OPEC reached a preliminary deal to cut production for the first time in eight years. Transocean (RIG +6.09%) rose in sympathy with crude’s rise and news activist investor Carl Icahn cut his stake in the company by 75%. ConAgra (CAG +7.23%), Pepsi (PEP +0.35%) and Accenture (ACN +4.28%) rose following their positive quarterly results.
Treasuries finished up with the 10-year note up 4/32 to yield 1.56%. In commodities, NYMEX WTI crude rose 1.3% to $47.65/barrel. COMEX gold increased 0.1% to $1320.50/ounce. |
 Kenneth J. Gruneisen started out as a licensed stockbroker in August 1987, a couple of months prior to the historic stock market crash that took the Dow Jones Industrial Average down -22.6% in a single day. He has published daily fact-based fundamental and technical analysis on high-ranked stocks online for two decades. Through FACTBASEDINVESTING.COM, Kenneth provides educational articles, news, market commentary, and other information regarding proven investment systems that work in good times and bad.
Comments contained in the body of this report are technical opinions only and are not necessarily those of Gruneisen Growth Corp. The material herein has been obtained from sources believed to be reliable and accurate, however, its accuracy and completeness cannot be guaranteed. Our firm, employees, and customers may effect transactions, including transactions contrary to any recommendation herein, or have positions in the securities mentioned herein or options with respect thereto. Any recommendation contained in this report may not be suitable for all investors and it is not to be deemed an offer or solicitation on our part with respect to the purchase or sale of any securities. |
|
 |
Oil Services and Semiconductor Indexes Rose
Kenneth J. Gruneisen - Passed the CAN SLIM® Master's Exam
The Oil Services Index ($OSX +2.26%) posted a big gain while the Integrated Oil Index ($XOI +0.08%) finished flat and the Gold & Silver Index ($XAU -0.69%) edged lower on Thursday. The Broker/Dealer Index ($XBD -1.09%) and the Bank Index ($BKX -1.53%) both suffered greater than -1%v losses and the Retail Index ($RLX -0.25%) edged lower. The Biotechnology Index ($BTK -2.72%) outpaced the Networking Index ($NWX -0.89%) to the downside while the Semiconductor Index ($SOX +1.25%) finished higher. Charts courtesy www.stockcharts.com
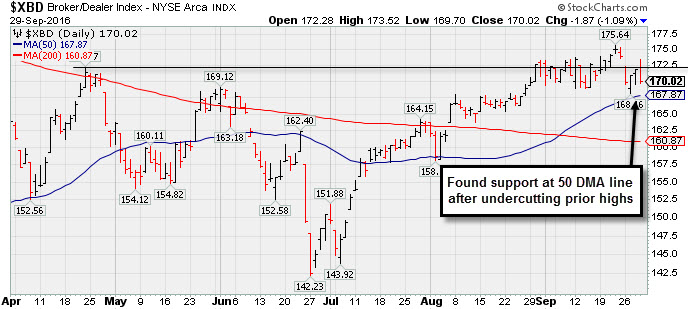
PICTURED: The Broker/Dealer Index ($XBD -1.09%) found support at its 50-day moving average (DMA) line recently after undercutting prior highs.
| Oil Services |
$OSX |
160.97 |
+3.55 |
+2.26% |
+2.05% |
| Integrated Oil |
$XOI |
1,138.15 |
+0.90 |
+0.08% |
+6.10% |
| Semiconductor |
$SOX |
822.64 |
+10.17 |
+1.25% |
+23.99% |
| Networking |
$NWX |
401.73 |
-3.59 |
-0.89% |
+6.86% |
| Broker/Dealer |
$XBD |
170.02 |
-1.87 |
-1.09% |
-4.53% |
| Retail |
$RLX |
1,344.79 |
-3.40 |
-0.25% |
+4.78% |
| Gold & Silver |
$XAU |
95.01 |
-0.66 |
-0.69% |
+109.74% |
| Bank |
$BKX |
69.71 |
-1.09 |
-1.54% |
-4.61% |
| Biotech |
$BTK |
3,332.65 |
-93.06 |
-2.72% |
-12.62% |
|
|
|
 |
50-Day Moving Average Line Recently Acted as Support
Kenneth J. Gruneisen - Passed the CAN SLIM® Master's Exam
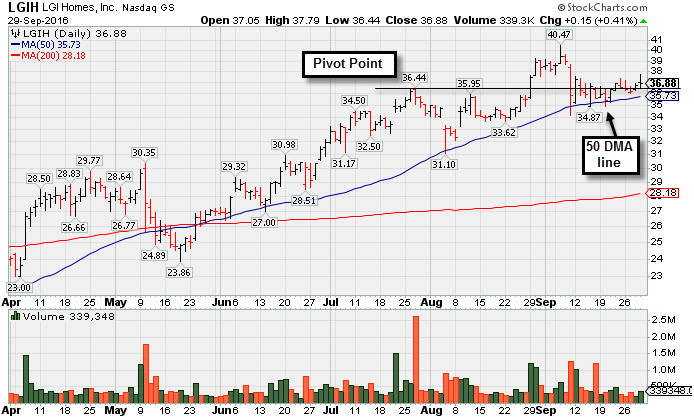
L G I Homes Inc (LGIH +$0.15 or +0.41% to $36.88) is still quietly consolidating above its 50-day moving average (DMA) line ($35.73) which has acted as support. Violations of the 50 DMA line and recent lows ($34.18 on 9/09/16) would raise greater concerns and trigger worrisome technical sell signals. The Building - Residential / Commercial firm was last shown in this FSU section on 8/29/16 under the headline, "Finished Strong While Rallying From Cup-With-Handle Base". It finished strong after highlighted in yellow with pivot point cited based on its 7/26/16 high in the earlier mid-day report (read here). It hit a new 52-week high today with +130% above average volume while rising from a 39-week long cup-with-handle base, triggering a technical buy signal. LGIH has a limited history since its IPO at $11 on 11/07/13. It reported +45% earnings on +40% sales revenues for the second quarter ended June 30, 2016 versus the year ago period, marking the 6th consecutive quarterly comparison above the +25% minimum earnings guideline (C criteria) and backed by solid sales revenues increases. Fundamentals remain strong. However, the current Group Relative Strength Rating of 62 reveals mediocre leadership (L criteria) in the industry group. The number of top-rated funds owning its shares rose from 126 in Dec '14 to 220 in Jun '16, a reassuring sign considering the I criteria. Its Up/Down Volume Ratio of 1.0 is an unbiased indication its shares have been neutral over the past 50 days. It has a Timeliness Rating of B and a Sponsorship Rating of D. LGIH was dropped from the Featured Stocks list on 12/09/15 and rebounded later from a very deep consolidation. It deteriorated quickly after last shown in this FSU section on 12/01/15 under the headline, "Volume Heavy Behind Breakout Gain". Stocks that get clobbered like that don't always come back. If and when they do, this example still serves as a reminder that it can take a long time and it can be very painful if losses are not limited whenever any stock falls more than -7% from your purchase price. Charts courtesy www.stockcharts.com
 |
|
|
Color Codes Explained :
Y - Better candidates highlighted by our
staff of experts.
G - Previously featured
in past reports as yellow but may no longer be buyable under the
guidelines.
***Last / Change / Volume data in this table is the closing quote data***
Symbol/Exchange
Company Name
Industry Group |
PRICE |
CHANGE
(%Change) |
Day High |
Volume
(% DAV)
(% 50 day avg vol) |
52 Wk Hi
% From Hi |
Featured
Date |
Price
Featured |
Pivot Featured |
|
Max Buy |
TDG
-
NYSE
Transdigm Group Inc
AEROSPACE/DEFENSE - Aerospace/Defense Products and; Services
|
$287.09
|
-4.25
-1.46% |
$290.83
|
280,883
86.96% of 50 DAV
50 DAV is 323,000
|
$294.38
-2.48%
|
5/11/2016
|
$248.33
|
PP = $245.00
|
|
MB = $257.25
|
Most Recent Note - 9/26/2016 5:42:56 PM
G - Rallied further above its 50 DMA line ($282) toward prior highs with today's volume-driven gain. Subsequent losses undercutting the 50 DMA line or recent low ($278.52) would raise greater concerns
>>> FEATURED STOCK ARTICLE : Light Volume Behind Gains Wedging for New Highs - 9/7/2016 |
View all notes |
Set NEW NOTE alert |
Company Profile |
SEC
News |
Chart |
Request a new note
C
A
S
I |
IESC
-
NASDAQ
I E S Holdings Inc
Bldg-Maintenance and Svc
|
$17.10
|
-0.28
-1.61% |
$17.40
|
61,825
75.40% of 50 DAV
50 DAV is 82,000
|
$18.16
-5.84%
|
7/26/2016
|
$15.79
|
PP = $15.74
|
|
MB = $16.53
|
Most Recent Note - 9/28/2016 12:26:41 PM
G - Wedging higher with gains lacking great volume conviction after recently finding support at its 50 DMA line ($15.64). That short-term average and the prior low ($15.00 on 9/14/16) define near-term support. See the latest FSU analysis for additional details and an annotated graph.
>>> FEATURED STOCK ARTICLE : Wedging Higher With Recent Gains Lacking Great Volume - 9/27/2016 |
View all notes |
Set NEW NOTE alert |
Company Profile |
SEC
News |
Chart |
Request a new note
C
A
S
I |
NTES
-
NASDAQ
Netease Inc Adr
INTERNET - Internet Information Providers
|
$242.06
|
-1.43
-0.59% |
$244.30
|
840,509
73.47% of 50 DAV
50 DAV is 1,144,000
|
$254.48
-4.88%
|
6/29/2016
|
$182.42
|
PP = $186.55
|
|
MB = $195.88
|
Most Recent Note - 9/26/2016 12:41:29 PM
G - Gapped down today retreating after getting very extended from any sound base. Its 50 DMA line ($214.72) defines near-term support to watch.
>>> FEATURED STOCK ARTICLE : Extended From Prior Base After +37% Rally Since Featured 6/29/16 - 9/21/2016 |
View all notes |
Set NEW NOTE alert |
Company Profile |
SEC
News |
Chart |
Request a new note
C
A
S
I |
HTHT
-
NASDAQ
China Lodging Group Ads
LEISURE - Lodging
|
$46.22
|
+0.64
1.40% |
$47.45
|
266,567
138.84% of 50 DAV
50 DAV is 192,000
|
$47.72
-3.14%
|
9/29/2016
|
$46.12
|
PP = $47.82
|
|
MB = $50.21
|
 Most Recent Note - 9/29/2016 12:37:07 PM
Y - Color code is changed to yellow with a new pivot point cited based on its 8/29/16 high plus 10 cents. Subsequent volume-driven gains for new highs may trigger a new (or add-on) technical buy signal. Volume totals cooled while stubbornly holding its ground near all-time highs in recent weeks. Recent lows and its 50 DMA line ($42.65) define near term support to watch on pullbacks.
>>> FEATURED STOCK ARTICLE : Possibly Forming New Base While Holding Ground Near Highs - 9/20/2016 |
View all notes |
Set NEW NOTE alert |
Company Profile |
SEC
News |
Chart |
Request a new note
C
A
S
I |
PATK
-
NASDAQ
Patrick Industries Inc
WHOLESALE - Building Materials Wholesale
|
$63.30
|
-1.55
-2.39% |
$65.05
|
97,435
45.32% of 50 DAV
50 DAV is 215,000
|
$69.53
-8.96%
|
9/28/2016
|
$64.85
|
PP = $66.87
|
|
MB = $70.21
|
Most Recent Note - 9/29/2016 5:43:20 PM
Y - Pulled back near its 50 DMA line with today's loss on light volume. A new pivot point was cited based on its 9/06/16 high, however volume-driven gains are still needed to trigger a new (or add-on) technical buy signal. See the latest FSU analysis for more details and an annotated graph.
>>> FEATURED STOCK ARTICLE : Found Support While Building on a New "Double Bottom" Base Pattern - 9/28/2016 |
View all notes |
Set NEW NOTE alert |
Company Profile |
SEC
News |
Chart |
Request a new note
C
A
S
I |
Symbol/Exchange
Company Name
Industry Group |
PRICE |
CHANGE
(%Change) |
Day High |
Volume
(% DAV)
(% 50 day avg vol) |
52 Wk Hi
% From Hi |
Featured
Date |
Price
Featured |
Pivot Featured |
|
Max Buy |
LGIH
-
NASDAQ
L G I Homes Inc
Bldg-Resident/Comml
|
$36.88
|
+0.15
0.41% |
$37.79
|
339,298
62.03% of 50 DAV
50 DAV is 547,000
|
$40.47
-8.87%
|
8/29/2016
|
$37.08
|
PP = $36.44
|
|
MB = $38.26
|
Most Recent Note - 9/29/2016 5:39:56 PM
Y - Still quietly consolidating above its 50 DMA line ($35.73). Violations of the 50 DMA line and recent lows ($34.18 on 9/09/16) would raise greater concerns and trigger worrisome technical sell signals. See the latest FSU analysis for more details and a new annotated graph.
>>> FEATURED STOCK ARTICLE : 50-Day Moving Average Line Recently Acted as Support - 9/29/2016 |
View all notes |
Set NEW NOTE alert |
Company Profile |
SEC
News |
Chart |
Request a new note
C
A
S
I |
SFBS
-
NASDAQ
"ServisFirst Bancshares, Inc"
BANKING - Regional - Southeast Banks
|
$50.85
|
-1.15
-2.21% |
$52.20
|
43,095
82.56% of 50 DAV
50 DAV is 52,200
|
$53.58
-5.10%
|
7/19/2016
|
$53.28
|
PP = $52.82
|
|
MB = $55.46
|
Most Recent Note - 9/29/2016 5:47:05 PM
G - A volume-driven gain for new highs would be a reassuring sign of institutional buying demand. Currently sputtering near its 50 DMA line, its Relative Strength Rating has slumped to 69, well below the 80+ minimum guideline.
>>> FEATURED STOCK ARTICLE : Relative Strength Rating is Under Guidelines While Perched Near Highs - 9/22/2016 |
View all notes |
Set NEW NOTE alert |
Company Profile |
SEC
News |
Chart |
Request a new note
C
A
S
I |
INGN
-
NASDAQ
Inogen Inc
HEALTH SERVICES - Medical Instruments and Supplies
|
$59.00
|
-0.50
-0.84% |
$59.67
|
129,959
69.87% of 50 DAV
50 DAV is 186,000
|
$61.87
-4.64%
|
8/5/2016
|
$51.72
|
PP = $56.08
|
|
MB = $58.88
|
Most Recent Note - 9/27/2016 5:43:56 PM
G - Quietly holding its ground, extended from any sound base. Its 50 DMA line ($56.51) defines important near-term support coinciding with its Sep '15 highs.
>>> FEATURED STOCK ARTICLE : Stubbornly Holding Ground Near All-Time High - 9/12/2016 |
View all notes |
Set NEW NOTE alert |
Company Profile |
SEC
News |
Chart |
Request a new note
C
A
S
I |
|
|
|
THESE ARE NOT BUY RECOMMENDATIONS!
Comments contained in the body of this report are technical
opinions only. The material herein has been obtained
from sources believed to be reliable and accurate, however,
its accuracy and completeness cannot be guaranteed.
This site is not an investment advisor, hence it does
not endorse or recommend any securities or other investments.
Any recommendation contained in this report may not
be suitable for all investors and it is not to be deemed
an offer or solicitation on our part with respect to
the purchase or sale of any securities. All trademarks,
service marks and trade names appearing in this report
are the property of their respective owners, and are
likewise used for identification purposes only.
This report is a service available
only to active Paid Premium Members.
You may opt-out of receiving report notifications
at any time. Questions or comments may be submitted
by writing to Premium Membership Services 665 S.E. 10 Street, Suite 201 Deerfield Beach, FL 33441-5634 or by calling 1-800-965-8307
or 954-785-1121.
|
|
|