You are not logged in.
This means you
CAN ONLY VIEW reports that were published prior to Saturday, April 5, 2025.
You
MUST UPGRADE YOUR MEMBERSHIP if you want to see any current reports.
AFTER MARKET UPDATE - MONDAY, SEPTEMBER 12TH, 2016
Previous After Market Report Next After Market Report >>>
|
|
|
|
DOW |
+239.62 |
18,325.07 |
+1.32% |
|
Volume |
992,309,380 |
-6% |
|
Volume |
1,832,093,830 |
-9% |
|
NASDAQ |
+85.98 |
5,211.89 |
+1.68% |
|
Advancers |
2,159 |
72% |
|
Advancers |
2,074 |
72% |
|
S&P 500 |
+31.23 |
2,159.04 |
+1.47% |
|
Decliners |
843 |
28% |
|
Decliners |
789 |
28% |
|
Russell 2000 |
+16.66 |
1,235.87 |
+1.37% |
|
52 Wk Highs |
32 |
|
|
52 Wk Highs |
36 |
|
|
S&P 600 |
+8.21 |
748.18 |
+1.11% |
|
52 Wk Lows |
40 |
|
|
52 Wk Lows |
61 |
|
|
 |
Major Averages Rebounded With Less Volume and Thin Leadership
Kenneth J. Gruneisen - Passed the CAN SLIM® Master's Exam
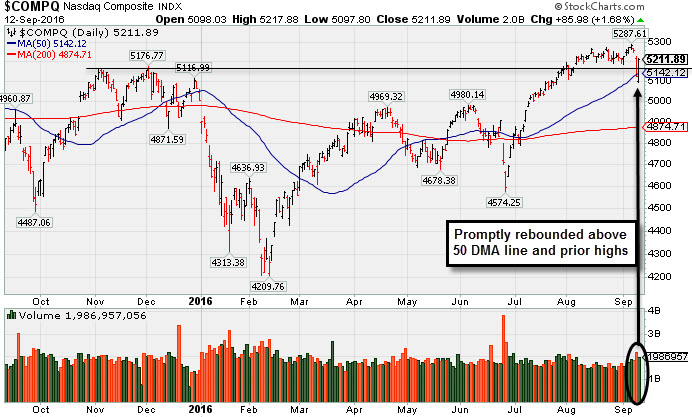
Stocks finished firmly higher on Monday. The Dow was up 239 points to 18325. The S&P 500 added 31 points to 2159 and the Nasdaq Composite gained 85 points to 5211. Behind the gains the volume totals were lighter than the prior session on both the NYSE and the Nasdaq exchange. Breadth was positive as advancers led decliners by an 11-4 margin on the NYSE and on the Nasdaq exchange. Leadership remained thin as only 8 high-ranked companies from the Leaders List made new 52-week highs and were listed on the BreakOuts Page, down abruptly from 71 last Wednesday. New 52-week lows totals outnumbered shrinking lists of new 52-week highs on the NYSE and the Nasdaq exchange, raising more concerns regarding the recently deteriorating market environment. PICTURED: The Nasdaq Composite Index chart shows that there was heavier volume behind Friday's damaging losses. Monday's gain helped it promptly rebound above its short-term moving average.
The major indices' charts have shown the worrisome look of a "correction", and the recently noted "healthy crop" of leading stocks abruptly dried up. Very few stocks reached new 52-week highs on Friday or Monday. In periods of market weakness the fact-based investment system suggests reducing exposure to stocks as they weaken and on a case-by-case basis. The Featured Stocks Page lists noteworthy candidates that have made headway. Technical damage for the market (M criteria) still remains after Monday's bounce, as both the Dow Jones Industrial Average and the S&P 500 Index remain below their respective 50-day moving average (DMA) lines.
The major averages rebounded from Friday’s sell-off amid tempered concerns of a September interest rate hike. Fed Governor Lael Brainard stated Monday while economic progress continues, it would be wise for the central bank to keep monetary policy loose. Brainard said that the case to preemptively hike rates is less compelling and offered cautionary tones in the Fed moving too fast. According to Bloomberg data, futures are currently pricing a 20% probability of a rate hike in September versus 30% odds after Friday’s market sell-off.
All 11 sectors in the S&P 500 finished in positive territory. Telecom stocks rallied 2% higher with AT&T (T +2.52%). Consumer Staples shares advanced with Phillip Morris (PM +3.18%) up after being the subject of positive analyst commentary. Pandora Media (P +4.92%) rose with news the company may announce a $5/month streaming service this week. Polaris (PII -5.01%) was a notable decliner as the recreational vehicle manufacturer lowered its yearly sales guidance.
Treasuries finished mostly higher with the benchmark 10-year note up 2/32 to yield 1.67%. In commodities, NYMEX WTI crude gained 0.4% to $46.07/barrel. COMEX gold lost 0.3% to $1327.10/ounce. In FOREX, the Dollar Index fell 0.2%. |
 Kenneth J. Gruneisen started out as a licensed stockbroker in August 1987, a couple of months prior to the historic stock market crash that took the Dow Jones Industrial Average down -22.6% in a single day. He has published daily fact-based fundamental and technical analysis on high-ranked stocks online for two decades. Through FACTBASEDINVESTING.COM, Kenneth provides educational articles, news, market commentary, and other information regarding proven investment systems that work in good times and bad.
Comments contained in the body of this report are technical opinions only and are not necessarily those of Gruneisen Growth Corp. The material herein has been obtained from sources believed to be reliable and accurate, however, its accuracy and completeness cannot be guaranteed. Our firm, employees, and customers may effect transactions, including transactions contrary to any recommendation herein, or have positions in the securities mentioned herein or options with respect thereto. Any recommendation contained in this report may not be suitable for all investors and it is not to be deemed an offer or solicitation on our part with respect to the purchase or sale of any securities. |
|
 |
Widespread Group Gains Helped Indices Rebound
Kenneth J. Gruneisen - Passed the CAN SLIM® Master's Exam
On Monday the Broker/Dealer Index ($XBD +1.55%) and Bank Index ($BKX +1.03%) both rebounded and the Retail Index ($RLX +1.34%) recovered part of Friday's big loss. The Biotechnology Index ($BTK +2.97%) and Semiconductor Index ($SOX +2.03%) both outpaced the Networking Index ($NWX +0.85%) as the tech sector bounced back. Commodity-linked groups also recovered partly from big setbacks as the Gold & Silver Index ($XAU +3.53%), Oil Services Index ($OSX +1.13%) and the Integrated Oil Index ($XOI +0.78%). Charts courtesy www.stockcharts.com
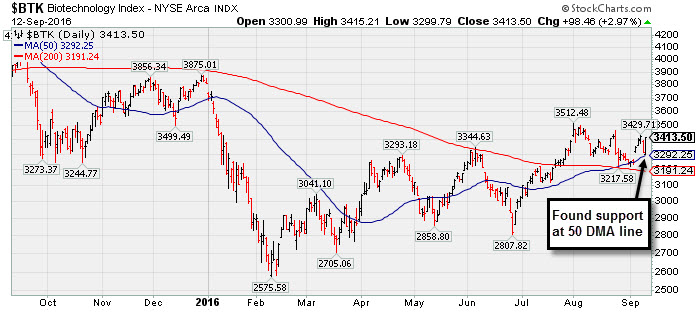
PICTURED: The Biotechnology Index ($BTK +2.97%) found support at its 50-day moving average (DMA) line.
| Oil Services |
$OSX |
155.78 |
+1.73 |
+1.12% |
-1.24% |
| Integrated Oil |
$XOI |
1,143.41 |
+8.88 |
+0.78% |
+6.59% |
| Semiconductor |
$SOX |
783.95 |
+15.58 |
+2.03% |
+18.16% |
| Networking |
$NWX |
393.91 |
+3.33 |
+0.85% |
+4.78% |
| Broker/Dealer |
$XBD |
173.55 |
+2.65 |
+1.55% |
-2.55% |
| Retail |
$RLX |
1,323.34 |
+17.44 |
+1.34% |
+3.11% |
| Gold & Silver |
$XAU |
96.75 |
+3.29 |
+3.52% |
+113.58% |
| Bank |
$BKX |
72.24 |
+0.74 |
+1.03% |
-1.15% |
| Biotech |
$BTK |
3,413.50 |
+98.46 |
+2.97% |
-10.50% |
|
|
|
 |
Stubbornly Holding Ground Near All-Time High
Kenneth J. Gruneisen - Passed the CAN SLIM® Master's Exam
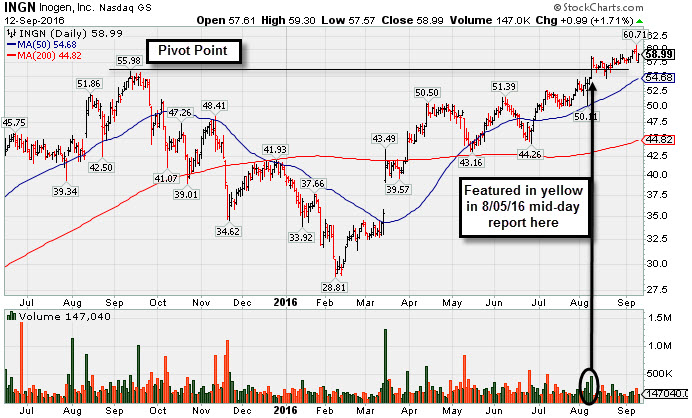
Inogen Inc (INGN +$0.99 or +1.71% to $58.99) posted a gain with light volume today. It remains near its 52-week high, stubbornly holding its ground. INGN was highlighted in yellow with new pivot point cited based on its 9/14/15 high plus 10 cents in 8/05/16 mid-day report (read here). It was last shown in this FSU section on 8/05/16 with an annotated graph under the headline, "Perched Within Striking Distance of Highs Following Rebound". It has made limited progress since its 8/09/16 volume-driven gain triggered a technical buy signal.
The Dec '15, Mar and Jun '16 quarters showed earnings increases above the +25% minimum guideline (C criteria). Sales revenues growth has been in the +24-39% range, a reassuring sign of increasing demand for its new products and services (N criteria). Annual earnings (A criteria) growth has been strong.
The number of top-rated funds owning its shares rose from 114 in Sep '14 to 317 in Jun '16, a reassuring sign concerning the I criteria. Its small supply of only 15.3 million shares (S criteria) in the public float can contribute to greater price volatility in the event of institutional buying or selling. it is up considerably from its $16 IPO on 2/14/14 followed by a Secondary Offering on 10/30/14.
|
|
|
Color Codes Explained :
Y - Better candidates highlighted by our
staff of experts.
G - Previously featured
in past reports as yellow but may no longer be buyable under the
guidelines.
***Last / Change / Volume data in this table is the closing quote data***
Symbol/Exchange
Company Name
Industry Group |
PRICE |
CHANGE
(%Change) |
Day High |
Volume
(% DAV)
(% 50 day avg vol) |
52 Wk Hi
% From Hi |
Featured
Date |
Price
Featured |
Pivot Featured |
|
Max Buy |
TDG
-
NYSE
Transdigm Group Inc
AEROSPACE/DEFENSE - Aerospace/Defense Products and; Services
|
$286.46
|
+3.05
1.08% |
$287.22
|
348,028
99.15% of 50 DAV
50 DAV is 351,000
|
$294.38
-2.69%
|
5/11/2016
|
$248.33
|
PP = $245.00
|
|
MB = $257.25
|
Most Recent Note - 9/7/2016 6:05:15 PM
G - Wedged to new all-time highs with today's 4th consecutive gain backed by light volume. Its 50 DMA line and prior highs define important near-term support to watch on pullbacks. See the latest FSU analysis for more details and a new annotated graph.
>>> FEATURED STOCK ARTICLE : Light Volume Behind Gains Wedging for New Highs - 9/7/2016 |
View all notes |
Set NEW NOTE alert |
Company Profile |
SEC
News |
Chart |
Request a new note
C
A
S
I |
IESC
-
NASDAQ
I E S Holdings Inc
Bldg-Maintenance and Svc
|
$15.76
|
+0.16
1.03% |
$15.89
|
97,330
115.87% of 50 DAV
50 DAV is 84,000
|
$18.16
-13.22%
|
7/26/2016
|
$15.79
|
PP = $15.74
|
|
MB = $16.53
|
Most Recent Note - 9/9/2016 6:02:11 PM
G - Suffered a big loss on higher volume today following a "negative reversal" on 9/06/16. Its 50 DMA line and the recent low (13.50 on 8/02/16) define important near-term support to watch.
>>> FEATURED STOCK ARTICLE : Strength Returned With Heavier Volume Gains for Highs - 8/30/2016 |
View all notes |
Set NEW NOTE alert |
Company Profile |
SEC
News |
Chart |
Request a new note
C
A
S
I |
NTES
-
NASDAQ
Netease Inc Adr
INTERNET - Internet Information Providers
|
$230.07
|
+16.90
7.93% |
$230.55
|
1,754,154
153.20% of 50 DAV
50 DAV is 1,145,000
|
$224.18
2.63%
|
6/29/2016
|
$182.42
|
PP = $186.55
|
|
MB = $195.88
|
 Most Recent Note - 9/12/2016 6:09:37 PM
G - Manged a "positive reversal" and posted a considerable gain today, rallying further into new all-time high territory with above average volume. It is extended from any sound base. Its 50 DMA line ($204) defines near-term support.
>>> FEATURED STOCK ARTICLE : Pulled Back on Higher Volume Following Earnings Report - 8/18/2016 |
View all notes |
Set NEW NOTE alert |
Company Profile |
SEC
News |
Chart |
Request a new note
C
A
S
I |
HTHT
-
NASDAQ
China Lodging Group Ads
LEISURE - Lodging
|
$46.00
|
+1.61
3.63% |
$46.08
|
322,749
140.94% of 50 DAV
50 DAV is 229,000
|
$47.72
-3.60%
|
7/13/2016
|
$38.87
|
PP = $39.29
|
|
MB = $41.25
|
Most Recent Note - 9/12/2016 6:11:53 PM
G - Posted a gain with above average volume and finished near the session high today for its second-best close ever. Extended from any sound base after rallying well above its "max buy" level. Prior highs and its 50 DMA line define near term support to watch on pullbacks.
>>> FEATURED STOCK ARTICLE : Volume-Driven Gains for New Highs Signal Institutional Demand - 8/17/2016 |
View all notes |
Set NEW NOTE alert |
Company Profile |
SEC
News |
Chart |
Request a new note
C
A
S
I |
MXL
-
NYSE
Maxlinear Inc Cl A
Telecom-Infrastructure
|
$18.53
|
+0.03
0.16% |
$18.56
|
1,612,759
117.29% of 50 DAV
50 DAV is 1,375,000
|
$22.50
-17.64%
|
5/16/2016
|
$19.24
|
PP = $19.20
|
|
MB = $20.16
|
Most Recent Note - 9/9/2016 6:05:07 PM
G - Sputtering below its 50 DMA line, and a rebound above that short-term average is needed for its outlook to improve. Its 200 DMA line and prior lows in the $17 area define the next important support level where violations would raise serious concerns.
>>> FEATURED STOCK ARTICLE : Rebound to 50-Day Moving Average After Abrupt Drop to 200-Day Line - 9/1/2016 |
View all notes |
Set NEW NOTE alert |
Company Profile |
SEC
News |
Chart |
Request a new note
C
A
S
I |
Symbol/Exchange
Company Name
Industry Group |
PRICE |
CHANGE
(%Change) |
Day High |
Volume
(% DAV)
(% 50 day avg vol) |
52 Wk Hi
% From Hi |
Featured
Date |
Price
Featured |
Pivot Featured |
|
Max Buy |
PATK
-
NASDAQ
Patrick Industries Inc
WHOLESALE - Building Materials Wholesale
|
$62.58
|
-0.56
-0.89% |
$62.84
|
209,704
96.64% of 50 DAV
50 DAV is 217,000
|
$69.53
-10.00%
|
9/8/2016
|
$64.74
|
PP = $69.63
|
|
MB = $73.11
|
Most Recent Note - 9/8/2016 6:12:35 PM
Y - Color code is changed to yellow with new pivot point cited based on its 7/28/16 high plus 10 cents. Volume-driven gains for new highs may trigger a new (or add-on) technical buy signal, meanwhile, it is quietly consolidating above the 50 DMA line ($63.84) which has acted as support in recent weeks. Subsequent losses leading to a violation may trigger a technical sell signal.
>>> FEATURED STOCK ARTICLE : Building a New Base Above 50-Day Moving Average Line - 8/31/2016 |
View all notes |
Set NEW NOTE alert |
Company Profile |
SEC
News |
Chart |
Request a new note
C
A
S
I |
FBHS
-
NYSE
Fortune Brands Hme & Sec
Bldg-Constr Prds/Misc
|
$59.00
|
+0.28
0.48% |
$59.26
|
1,905,528
161.75% of 50 DAV
50 DAV is 1,178,100
|
$64.47
-8.48%
|
6/22/2016
|
$57.71
|
PP = $60.08
|
|
MB = $63.08
|
Most Recent Note - 9/12/2016 6:14:35 PM
G - Halted its slide with a gain today backed by above average volume. A rebound above its 50 DMA line is needed for its outlook to improve after damaging losses last week triggered technical sell signals.
>>> FEATURED STOCK ARTICLE : Pullback Testing Important Near-Term Support Level - 9/8/2016 |
View all notes |
Set NEW NOTE alert |
Company Profile |
SEC
News |
Chart |
Request a new note
C
A
S
I |
LGIH
-
NASDAQ
L G I Homes Inc
Bldg-Resident/Comml
|
$37.26
|
+1.44
4.02% |
$37.52
|
1,021,735
186.11% of 50 DAV
50 DAV is 549,000
|
$40.47
-7.93%
|
8/29/2016
|
$37.08
|
PP = $36.44
|
|
MB = $38.26
|
Most Recent Note - 9/12/2016 12:51:50 PM
Y - Color code is changed to yellow after pulling back below its "max buy" level. Finding prompt support today after a big loss on the prior session with heavy volume tested prior highs in the $36 area and its 50 DMA line defining initial support to watch.
>>> FEATURED STOCK ARTICLE : Finished Strong While Rallying From Cup-With-Handle Base - 8/29/2016 |
View all notes |
Set NEW NOTE alert |
Company Profile |
SEC
News |
Chart |
Request a new note
C
A
S
I |
NVEE
-
NASDAQ
N V 5 Global Inc
Comml Svcs-Consulting
|
$29.97
|
+0.26
0.88% |
$29.99
|
33,240
42.62% of 50 DAV
50 DAV is 78,000
|
$37.00
-19.00%
|
4/19/2016
|
$28.20
|
PP = $28.10
|
|
MB = $29.51
|
Most Recent Note - 9/9/2016 6:06:52 PM
G - Sank below its 50 DMA line with a big loss today on lighter than average volume. Prior highs in the $30 area define important near-term support, and more damaging losses may trigger worrisome technical sell signals.
>>> FEATURED STOCK ARTICLE : Technically Strong Despite Fundamental Concerns - 8/22/2016 |
View all notes |
Set NEW NOTE alert |
Company Profile |
SEC
News |
Chart |
Request a new note
C
A
S
I |
SFBS
-
NASDAQ
"ServisFirst Bancshares, Inc"
BANKING - Regional - Southeast Banks
|
$52.03
|
+0.38
0.74% |
$52.41
|
47,546
71.82% of 50 DAV
50 DAV is 66,200
|
$53.58
-2.89%
|
7/19/2016
|
$53.28
|
PP = $52.82
|
|
MB = $55.46
|
Most Recent Note - 9/6/2016 4:18:47 PM
Y - Today's quiet loss broke a streak of 8 small gains challenging its 52-week high. Members were previously reminded - "A volume-driven gain and strong close above the pivot point are needed to clinch a convincing technical buy signal. It has been quietly consolidating since highlighted in yellow in the 7/19/16 mid-day report with pivot point cited based on the 6/01/16 high plus 10 cents."
>>> FEATURED STOCK ARTICLE : Still Consolidating Within Close Striking Distance of New Highs - 8/25/2016 |
View all notes |
Set NEW NOTE alert |
Company Profile |
SEC
News |
Chart |
Request a new note
C
A
S
I |
Symbol/Exchange
Company Name
Industry Group |
PRICE |
CHANGE
(%Change) |
Day High |
Volume
(% DAV)
(% 50 day avg vol) |
52 Wk Hi
% From Hi |
Featured
Date |
Price
Featured |
Pivot Featured |
|
Max Buy |
INGN
-
NASDAQ
Inogen Inc
HEALTH SERVICES - Medical Instruments and Supplies
|
$58.99
|
+0.99
1.71% |
$59.30
|
149,159
73.84% of 50 DAV
50 DAV is 202,000
|
$60.71
-2.83%
|
8/5/2016
|
$51.72
|
PP = $56.08
|
|
MB = $58.88
|
Most Recent Note - 9/12/2016 6:06:55 PM
G - Posted a gain above its "max buy" level with light volume and its color code is changed to green. Remains at its 52-week high, stubbornly holding its ground since 8/09/16 when a volume-driven gain triggered a technical buy signal. See the latest FSU analysis for additional details and a new annotated graph.
>>> FEATURED STOCK ARTICLE : Stubbornly Holding Ground Near All-Time High - 9/12/2016 |
View all notes |
Set NEW NOTE alert |
Company Profile |
SEC
News |
Chart |
Request a new note
C
A
S
I |
OLLI
-
NASDAQ
Ollie's Bargain Outlet
Retail-DiscountandVariety
|
$25.69
|
+0.52
2.07% |
$25.83
|
1,607,708
199.96% of 50 DAV
50 DAV is 804,000
|
$28.72
-10.55%
|
7/19/2016
|
$26.42
|
PP = $28.82
|
|
MB = $30.26
|
Most Recent Note - 9/12/2016 1:00:47 PM
G - Sputtering today after violating its 50 DMA line with considerable volume-driven losses. A rebound above that important short-term average is needed for its outlook to improve. Recent weakness followed news of a Secondary Offering. Reported earnings +50% on +16% sales revenues for the Jul '16 quarter. Members were repeatedly reminded in prior notes - "Volume-driven gains above the pivot point are still needed to trigger a convincing technical buy signal."
>>> FEATURED STOCK ARTICLE : Near High Awaiting Volume-Driven Gain to Trigger Technical Buy Signal - 8/24/2016 |
View all notes |
Set NEW NOTE alert |
Company Profile |
SEC
News |
Chart |
Request a new note
C
A
S
I |
|
|
|
THESE ARE NOT BUY RECOMMENDATIONS!
Comments contained in the body of this report are technical
opinions only. The material herein has been obtained
from sources believed to be reliable and accurate, however,
its accuracy and completeness cannot be guaranteed.
This site is not an investment advisor, hence it does
not endorse or recommend any securities or other investments.
Any recommendation contained in this report may not
be suitable for all investors and it is not to be deemed
an offer or solicitation on our part with respect to
the purchase or sale of any securities. All trademarks,
service marks and trade names appearing in this report
are the property of their respective owners, and are
likewise used for identification purposes only.
This report is a service available
only to active Paid Premium Members.
You may opt-out of receiving report notifications
at any time. Questions or comments may be submitted
by writing to Premium Membership Services 665 S.E. 10 Street, Suite 201 Deerfield Beach, FL 33441-5634 or by calling 1-800-965-8307
or 954-785-1121.
|
|
|