You are not logged in.
This means you
CAN ONLY VIEW reports that were published prior to Sunday, March 30, 2025.
You
MUST UPGRADE YOUR MEMBERSHIP if you want to see any current reports.
AFTER MARKET UPDATE - TUESDAY, SEPTEMBER 27TH, 2016
Previous After Market Report Next After Market Report >>>
|
|
|
|
DOW |
+133.47 |
18,228.30 |
+0.74% |
|
Volume |
826,829,750 |
+7% |
|
Volume |
1,601,365,610 |
+4% |
|
NASDAQ |
+48.22 |
5,305.71 |
+0.92% |
|
Advancers |
1,751 |
59% |
|
Advancers |
1,886 |
66% |
|
S&P 500 |
+13.83 |
2,159.93 |
+0.64% |
|
Decliners |
1,233 |
41% |
|
Decliners |
977 |
34% |
|
Russell 2000 |
+5.44 |
1,246.38 |
+0.44% |
|
52 Wk Highs |
78 |
|
|
52 Wk Highs |
87 |
|
|
S&P 600 |
+1.26 |
751.34 |
+0.17% |
|
52 Wk Lows |
21 |
|
|
52 Wk Lows |
29 |
|
|
 |
Breadth Positive as Indices Rose on Higher Volume
Kenneth J. Gruneisen - Passed the CAN SLIM® Master's Exam
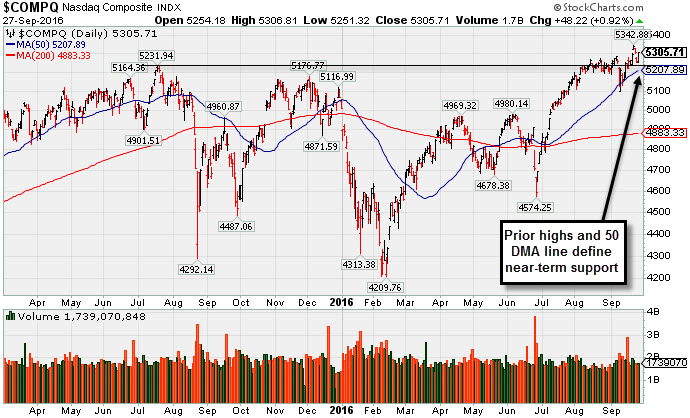
Stocks finished higher on Tuesday. The Dow was up 133 points to 18228. The S&P 500 added 13 points to 2159 and the Nasdaq Composite gained 48 points to 5305. The volume totals were higher than the prior session on the NYSE and on the Nasdaq exchange. Breadth was positive as advancers led decliners by 3-2 on the NYSE and by 9-5 on the Nasdaq exchange. There were 29 high-ranked companies from the Leaders List that made new 52-week highs and were listed on the BreakOuts Page, up from 11 on the prior session. New 52-week highs totals outnumbered new 52-week lows on both the NYSE and the Nasdaq exchange. PICTURED: The Nasdaq Composite Index's prior highs and 50-day moving average (DMA) line define near-term support.
Last Thursday's move into new high territory for the Nasdaq Composite Index was a sign of technical strength in the market (M criteria) reassuring investors. However, the Dow Jones Industrial Average and S&P 500 Index both are again slumping below their 50-day moving average (DMA) lines. The Featured Stocks Page lists noteworthy high-ranked leaders.
The major averages rebounded from Monday’s retreat as Technology shares advanced and investors digested optimistic updates on the economy. On the data front, consumer sentiment rose in September to the highest level since August 2007 amid upbeat signs of an improving labor market. Separately, the Case-Shiller Index showed U.S. home prices increased 5.1% year-over-year in July. Finally, Markit’s survey of U.S. business activity expanded to 51.9 in August.
Eight of 11 sectors in the S&P 500 finished in positive territory. In Tech, Microsoft (MSFT +1.85%) rose amid reports that the company is a possible suitor to purchase Twitter. Shares of Twitter (TWTR +1.50%) edged higher with the news. In the consumer space, Amazon.com (AMZN +2.12%) advanced to an all-time high. Kite Pharma (KITE 9.20%) as the company reported upbeat results in a mid-stage clinical trial for its non-Hodgkins lymphoma treatment. On the M&A front, Rice Energy (RICE +7.89%) rose after agreeing to acquire privately held Vantage Energy for $2.7 billion.
Treasuries advanced with the benchmark 10-year note up 8/32 to yield 1.55%. In commodities, NYMEX WTI crude fell 2.7% to $44.67/barrel. COMEX gold lost 1% to $1326.70/ounce. In FOREX, the Dollar Index gained 0.2%. |
 Kenneth J. Gruneisen started out as a licensed stockbroker in August 1987, a couple of months prior to the historic stock market crash that took the Dow Jones Industrial Average down -22.6% in a single day. He has published daily fact-based fundamental and technical analysis on high-ranked stocks online for two decades. Through FACTBASEDINVESTING.COM, Kenneth provides educational articles, news, market commentary, and other information regarding proven investment systems that work in good times and bad.
Comments contained in the body of this report are technical opinions only and are not necessarily those of Gruneisen Growth Corp. The material herein has been obtained from sources believed to be reliable and accurate, however, its accuracy and completeness cannot be guaranteed. Our firm, employees, and customers may effect transactions, including transactions contrary to any recommendation herein, or have positions in the securities mentioned herein or options with respect thereto. Any recommendation contained in this report may not be suitable for all investors and it is not to be deemed an offer or solicitation on our part with respect to the purchase or sale of any securities. |
|
 |
Tech, Financial, and Retail Indexes Rose
Kenneth J. Gruneisen - Passed the CAN SLIM® Master's Exam
The Broker/Dealer Index ($XBD +0.63%) and the Bank Index ($BKX +1.00%) both rose along with the Retail Index ($RLX +1.36%) on Tuesday. The Networking Index ($NWX +1.29%), Biotechnology Index ($BTK +1.52%), and the Semiconductor Index ($SOX +1.78%) ended unanimously higher. Commodity-linked groups ended lower as the Gold & Silver Index ($XAU -1.55%) outpaced the Integrated Oil Index ($XOI -0.37%) and the Oil Services Index ($OSX -0.54%) to the downside. Charts courtesy www.stockcharts.com

PICTURED: The Semiconductor Index ($SOX +1.78%) found support near its 50-day moving average (DMA) line recently and rallied to new highs.
| Oil Services |
$OSX |
148.88 |
-0.81 |
-0.54% |
-5.61% |
| Integrated Oil |
$XOI |
1,093.10 |
-4.10 |
-0.37% |
+1.90% |
| Semiconductor |
$SOX |
810.84 |
+14.20 |
+1.78% |
+22.21% |
| Networking |
$NWX |
403.47 |
+5.14 |
+1.29% |
+7.33% |
| Broker/Dealer |
$XBD |
170.91 |
+1.08 |
+0.63% |
-4.03% |
| Retail |
$RLX |
1,343.11 |
+18.00 |
+1.36% |
+4.65% |
| Gold & Silver |
$XAU |
92.98 |
-1.47 |
-1.56% |
+105.25% |
| Bank |
$BKX |
70.42 |
+0.69 |
+0.99% |
-3.64% |
| Biotech |
$BTK |
3,463.97 |
+51.82 |
+1.52% |
-9.18% |
|
|
|
 |
Wedging Higher With Recent Gains Lacking Great Volume
Kenneth J. Gruneisen - Passed the CAN SLIM® Master's Exam
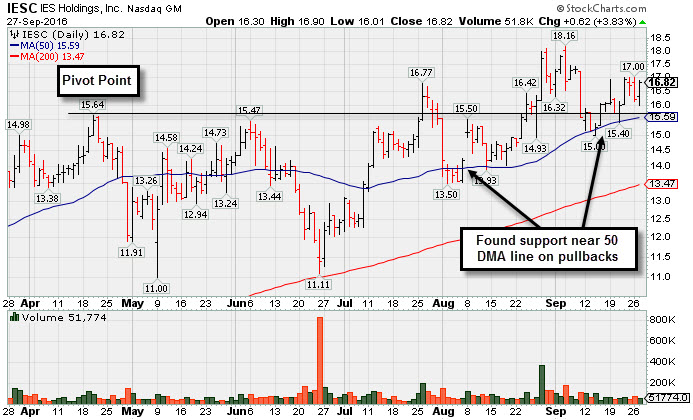
I E S Holdings Inc (IESC -$0.62 or -3.83% to $16.82) has been wedging higher with gains lacking great volume conviction after recently finding support at its 50-day moving average (DMA) line ($15.59). That short-term average and the prior low ($15.00 on 9/14/16) define near-term support.
IESC was last shown in this FSU section on 8/30/16 with an annotated graph under the headline, "Strength Returned With Heavier Volume Gains for Highs", pulling back after hitting new highs above its "max buy" level with a considerable gain backed by +270% above average volume on the prior session.
Members were previously reminded - "Under the fact-based system a stock which was previously sold can be bought back again if strength returns." The usual sell rules apply if a stock is repurchased, and in the Certification the teach investors to make a 10% larger purchase than on the prior entry.
IESC was shown in this FSU section on 7/26/16 with an annotated graph under the headline, "Volume-Driven Gain for New Highs Clinched Technical Buy Signal". It cleared the pivot point cited based on its 4/20/16 high plus 10 cents. Subsequent losses raised concerns for investors and likely triggered the fact-based investment system's sell rule at -7% from the purchase price. It slumped in the prior base and undercut its 50-day moving average (DMA) line before finding support. It gapped up on 8/08/16.
The high-ranked Building - Maintenance & Service firm reported Jun '16 quarterly earnings +79% on +25% sales revenues, continuing its strong earnings track record. That marked its 4th consecutive quarterly earnings increase above the +25% minimum earnings guideline in addition to the fact its sales revenues growth rate showed encouraging acceleration, helping it better match the fact-based investment system's guidelines. Annual earnings (A criteria) growth has been strong for the past 3 years.
Today it has a Timeliness rating of A, but its Sponsorship rating is currently a D. It found support at its 200-day moving average (DMA) line and rebounded after previously dropped from the Featured Stocks list on 6/21/16. The number of top rated funds owning its shares rose from 52 in Jun '15 to 123 in Jun '16, a reassuring sign concerning the I criteria. Its small supply of only 7.51 million shares (S criteria) in the public float can contribute to greater price volatility in the event of institutional buying or selling
|
|
|
Color Codes Explained :
Y - Better candidates highlighted by our
staff of experts.
G - Previously featured
in past reports as yellow but may no longer be buyable under the
guidelines.
***Last / Change / Volume data in this table is the closing quote data***
Symbol/Exchange
Company Name
Industry Group |
PRICE |
CHANGE
(%Change) |
Day High |
Volume
(% DAV)
(% 50 day avg vol) |
52 Wk Hi
% From Hi |
Featured
Date |
Price
Featured |
Pivot Featured |
|
Max Buy |
TDG
-
NYSE
Transdigm Group Inc
AEROSPACE/DEFENSE - Aerospace/Defense Products and; Services
|
$290.57
|
+0.39
0.13% |
$292.40
|
269,767
81.50% of 50 DAV
50 DAV is 331,000
|
$294.38
-1.29%
|
5/11/2016
|
$248.33
|
PP = $245.00
|
|
MB = $257.25
|
Most Recent Note - 9/26/2016 5:42:56 PM
G - Rallied further above its 50 DMA line ($282) toward prior highs with today's volume-driven gain. Subsequent losses undercutting the 50 DMA line or recent low ($278.52) would raise greater concerns
>>> FEATURED STOCK ARTICLE : Light Volume Behind Gains Wedging for New Highs - 9/7/2016 |
View all notes |
Set NEW NOTE alert |
Company Profile |
SEC
News |
Chart |
Request a new note
C
A
S
I |
IESC
-
NASDAQ
I E S Holdings Inc
Bldg-Maintenance and Svc
|
$16.82
|
+0.62
3.83% |
$16.90
|
51,774
63.92% of 50 DAV
50 DAV is 81,000
|
$18.16
-7.38%
|
7/26/2016
|
$15.79
|
PP = $15.74
|
|
MB = $16.53
|
 Most Recent Note - 9/27/2016 5:39:43 PM
G - Wedging higher with gains lacking great volume conviction after recently finding support at its 50 DMA line ($15.59). That short-term average and the prior low ($15.00 on 9/14/16) define near-term support. See the latest FSU analysis for additional details and a new annotated graph.
>>> FEATURED STOCK ARTICLE : Wedging Higher With Recent Gains Lacking Great Volume - 9/27/2016 |
View all notes |
Set NEW NOTE alert |
Company Profile |
SEC
News |
Chart |
Request a new note
C
A
S
I |
NTES
-
NASDAQ
Netease Inc Adr
INTERNET - Internet Information Providers
|
$244.15
|
+2.94
1.22% |
$248.57
|
1,023,959
88.73% of 50 DAV
50 DAV is 1,154,000
|
$254.48
-4.06%
|
6/29/2016
|
$182.42
|
PP = $186.55
|
|
MB = $195.88
|
Most Recent Note - 9/26/2016 12:41:29 PM
G - Gapped down today retreating after getting very extended from any sound base. Its 50 DMA line ($214.72) defines near-term support to watch.
>>> FEATURED STOCK ARTICLE : Extended From Prior Base After +37% Rally Since Featured 6/29/16 - 9/21/2016 |
View all notes |
Set NEW NOTE alert |
Company Profile |
SEC
News |
Chart |
Request a new note
C
A
S
I |
HTHT
-
NASDAQ
China Lodging Group Ads
LEISURE - Lodging
|
$45.25
|
-0.08
-0.18% |
$45.49
|
61,099
31.17% of 50 DAV
50 DAV is 196,000
|
$47.72
-5.18%
|
7/13/2016
|
$38.87
|
PP = $39.29
|
|
MB = $41.25
|
Most Recent Note - 9/27/2016 5:44:37 PM
G - Volume totals have still been cooling while stubbornly holding its ground near all-time highs. Prior highs and its 50 DMA line in the $41 area define near term support to watch on pullbacks.
>>> FEATURED STOCK ARTICLE : Possibly Forming New Base While Holding Ground Near Highs - 9/20/2016 |
View all notes |
Set NEW NOTE alert |
Company Profile |
SEC
News |
Chart |
Request a new note
C
A
S
I |
PATK
-
NASDAQ
Patrick Industries Inc
WHOLESALE - Building Materials Wholesale
|
$64.08
|
+2.65
4.31% |
$64.74
|
314,529
150.49% of 50 DAV
50 DAV is 209,000
|
$69.53
-7.84%
|
9/8/2016
|
$64.74
|
PP = $69.63
|
|
MB = $73.11
|
Most Recent Note - 9/27/2016 5:42:38 PM
Y - Rallied above its 50 DMA line ($63.23) with above average volume behind today's considerable gain and its color code is changed to yellow. Damaging losses below the 50 DMA line again would raise concerns.
>>> FEATURED STOCK ARTICLE : Building a New Base Above 50-Day Moving Average Line - 8/31/2016 |
View all notes |
Set NEW NOTE alert |
Company Profile |
SEC
News |
Chart |
Request a new note
C
A
S
I |
Symbol/Exchange
Company Name
Industry Group |
PRICE |
CHANGE
(%Change) |
Day High |
Volume
(% DAV)
(% 50 day avg vol) |
52 Wk Hi
% From Hi |
Featured
Date |
Price
Featured |
Pivot Featured |
|
Max Buy |
LGIH
-
NASDAQ
L G I Homes Inc
Bldg-Resident/Comml
|
$36.22
|
-0.16
-0.44% |
$36.61
|
318,367
58.20% of 50 DAV
50 DAV is 547,000
|
$40.47
-10.50%
|
8/29/2016
|
$37.08
|
PP = $36.44
|
|
MB = $38.26
|
Most Recent Note - 9/26/2016 5:38:11 PM
Y - Still quietly consolidating above its 50 DMA line ($35.54). Violations of the 50 DMA line and recent lows ($34.18 on 9/09/16) would raise greater concerns and trigger worrisome technical sell signals.
>>> FEATURED STOCK ARTICLE : Finished Strong While Rallying From Cup-With-Handle Base - 8/29/2016 |
View all notes |
Set NEW NOTE alert |
Company Profile |
SEC
News |
Chart |
Request a new note
C
A
S
I |
SFBS
-
NASDAQ
"ServisFirst Bancshares, Inc"
BANKING - Regional - Southeast Banks
|
$51.46
|
+0.96
1.90% |
$51.54
|
48,098
80.84% of 50 DAV
50 DAV is 59,500
|
$53.58
-3.96%
|
7/19/2016
|
$53.28
|
PP = $52.82
|
|
MB = $55.46
|
Most Recent Note - 9/26/2016 5:40:48 PM
G - Gapped down today and undercut its 50 DMA line raising concerns and its color code is changed to green. Only a prompt rebound above the 50 DMA line would help its outlook improve. See the latest FSU analysis for more details and an annotated graph.
>>> FEATURED STOCK ARTICLE : Relative Strength Rating is Under Guidelines While Perched Near Highs - 9/22/2016 |
View all notes |
Set NEW NOTE alert |
Company Profile |
SEC
News |
Chart |
Request a new note
C
A
S
I |
INGN
-
NASDAQ
Inogen Inc
HEALTH SERVICES - Medical Instruments and Supplies
|
$59.50
|
+0.32
0.54% |
$59.59
|
132,495
70.48% of 50 DAV
50 DAV is 188,000
|
$61.87
-3.83%
|
8/5/2016
|
$51.72
|
PP = $56.08
|
|
MB = $58.88
|
Most Recent Note - 9/27/2016 5:43:56 PM
G - Quietly holding its ground, extended from any sound base. Its 50 DMA line ($56.51) defines important near-term support coinciding with its Sep '15 highs.
>>> FEATURED STOCK ARTICLE : Stubbornly Holding Ground Near All-Time High - 9/12/2016 |
View all notes |
Set NEW NOTE alert |
Company Profile |
SEC
News |
Chart |
Request a new note
C
A
S
I |
|
|
|
THESE ARE NOT BUY RECOMMENDATIONS!
Comments contained in the body of this report are technical
opinions only. The material herein has been obtained
from sources believed to be reliable and accurate, however,
its accuracy and completeness cannot be guaranteed.
This site is not an investment advisor, hence it does
not endorse or recommend any securities or other investments.
Any recommendation contained in this report may not
be suitable for all investors and it is not to be deemed
an offer or solicitation on our part with respect to
the purchase or sale of any securities. All trademarks,
service marks and trade names appearing in this report
are the property of their respective owners, and are
likewise used for identification purposes only.
This report is a service available
only to active Paid Premium Members.
You may opt-out of receiving report notifications
at any time. Questions or comments may be submitted
by writing to Premium Membership Services 665 S.E. 10 Street, Suite 201 Deerfield Beach, FL 33441-5634 or by calling 1-800-965-8307
or 954-785-1121.
|
|
|