You are not logged in.
This means you
CAN ONLY VIEW reports that were published prior to Sunday, March 30, 2025.
You
MUST UPGRADE YOUR MEMBERSHIP if you want to see any current reports.
AFTER MARKET UPDATE - WEDNESDAY, SEPTEMBER 28TH, 2016
Previous After Market Report Next After Market Report >>>
|
|
|
|
DOW |
+110.94 |
18,339.24 |
+0.61% |
|
Volume |
903,965,910 |
+9% |
|
Volume |
1,672,981,470 |
+4% |
|
NASDAQ |
+12.84 |
5,318.55 |
+0.24% |
|
Advancers |
2,273 |
76% |
|
Advancers |
1,713 |
60% |
|
S&P 500 |
+11.44 |
2,171.37 |
+0.53% |
|
Decliners |
727 |
24% |
|
Decliners |
1,142 |
40% |
|
Russell 2000 |
+9.29 |
1,255.67 |
+0.75% |
|
52 Wk Highs |
105 |
|
|
52 Wk Highs |
121 |
|
|
S&P 600 |
+6.88 |
758.22 |
+0.92% |
|
52 Wk Lows |
13 |
|
|
52 Wk Lows |
32 |
|
|
 |
Major Averages Rose With Better Volume and More Leadership
Kenneth J. Gruneisen - Passed the CAN SLIM® Master's Exam
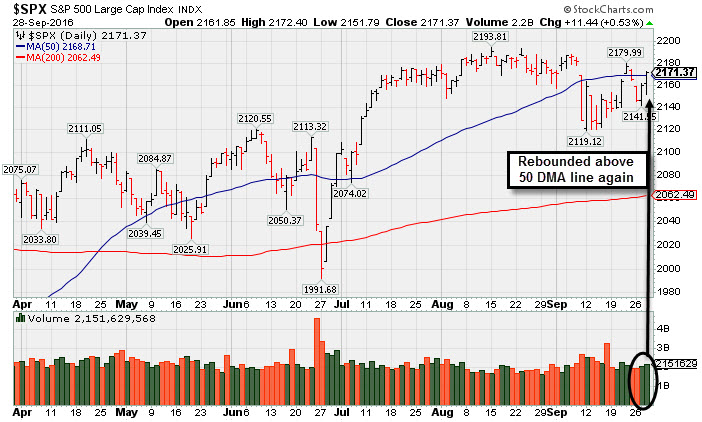
Stocks finished higher Wednesday. The Dow rose 111 points to 18339. The S&P 500 gained 11 points to 2171. The Nasdaq Composite advanced 13 points to close at 5318. The volume totals were higher than the prior session on the NYSE and on the Nasdaq exchange. Breadth was positive as advancers led decliners by 3-1 on the NYSE and by 3-2 on the Nasdaq exchange. There were 44 high-ranked companies from the Leaders List that made new 52-week highs and were listed on the BreakOuts Page, versus 29 on the prior session. New 52-week highs totals outnumbered new 52-week lows on both the NYSE and the Nasdaq exchange. PICTURED: The S&P 500 Index rebounded above its 50-day moving average (DMA) line again.
Last Thursday's move into new high territory for the Nasdaq Composite Index was a sign of technical strength in the market (M criteria) reassuring investors. The Dow Jones Industrial Average remains below its 50-day moving average (DMA) line. The Featured Stocks Page lists noteworthy high-ranked leaders.
The major averages ended a choppy session in positive territory led by the Energy sector. Exxon climbed 4.4% to $86.90 and Chevron increased 3.2% to $102.15 as oil rallied on reports OPEC agreed to its first production cut in eight years. The Fed was also in focus during the session. In her semi-annual testimony to the House Financial Services Committee, Chair Janet Yellen told lawmakers that the current rate of job creation is solid but not sustainable over the long-term and that future rate increases will likely be gradual. On the data front, a preliminary report showed durable goods orders were flat in August versus a projected 1.5% decline.
In addition to energy, Materials and Industrials outperformed on the session as Freeport McMoRan (FCX +6.86%) and Caterpillar (CAT +4.48%) rose. Telecom was the worst performing group with AT&T (T -1.47%) down. In earnings news, Cintas (CTAS +2.42%) rose after posting positive quarterly results and raising its guidance. Shares of Nike (NKE -3.78%) fell as orders came in short of consensus estimates.
Treasuries were lower with the 10-year note down 4/32 to yield 1.57% In commodities, NYMEX WTI crude jumped 4.6% to $46.75/barrel. COMEX gold lost 0.3% to $1321.60/ounce. |
 Kenneth J. Gruneisen started out as a licensed stockbroker in August 1987, a couple of months prior to the historic stock market crash that took the Dow Jones Industrial Average down -22.6% in a single day. He has published daily fact-based fundamental and technical analysis on high-ranked stocks online for two decades. Through FACTBASEDINVESTING.COM, Kenneth provides educational articles, news, market commentary, and other information regarding proven investment systems that work in good times and bad.
Comments contained in the body of this report are technical opinions only and are not necessarily those of Gruneisen Growth Corp. The material herein has been obtained from sources believed to be reliable and accurate, however, its accuracy and completeness cannot be guaranteed. Our firm, employees, and customers may effect transactions, including transactions contrary to any recommendation herein, or have positions in the securities mentioned herein or options with respect thereto. Any recommendation contained in this report may not be suitable for all investors and it is not to be deemed an offer or solicitation on our part with respect to the purchase or sale of any securities. |
|
 |
Commodity-Linked Groups Posted Standout Gains
Kenneth J. Gruneisen - Passed the CAN SLIM® Master's Exam
Commodity-linked groups were the leading gainers as the Gold & Silver Index ($XAU +2.89%), Integrated Oil Index ($XOI +4.04%) and the Oil Services Index ($OSX +5.73%) posted big gains on Wednesday. The Broker/Dealer Index ($XBD +0.57%) and the Bank Index ($BKX +0.53%) both edged higher along with the Retail Index ($RLX +0.36%). The Networking Index ($NWX +0.46%) and the Semiconductor Index ($SOX +0.20%) also edged higher, meanwhile the Biotechnology Index ($BTK -1.10%) fell. Charts courtesy www.stockcharts.com
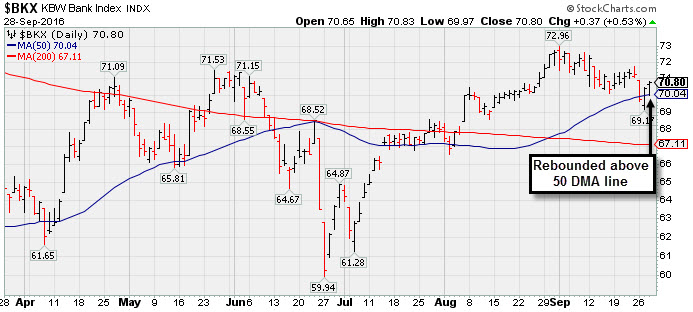
PICTURED: The Bank Index ($BKX +0.53%) found support at its 50-day moving average (DMA) line recently.
| Oil Services |
$OSX |
157.42 |
+8.54 |
+5.74% |
-0.20% |
| Integrated Oil |
$XOI |
1,137.24 |
+44.14 |
+4.04% |
+6.02% |
| Semiconductor |
$SOX |
812.47 |
+1.63 |
+0.20% |
+22.46% |
| Networking |
$NWX |
405.32 |
+1.85 |
+0.46% |
+7.82% |
| Broker/Dealer |
$XBD |
171.89 |
+0.98 |
+0.57% |
-3.48% |
| Retail |
$RLX |
1,348.19 |
+5.08 |
+0.38% |
+5.04% |
| Gold & Silver |
$XAU |
95.67 |
+2.69 |
+2.89% |
+111.19% |
| Bank |
$BKX |
70.80 |
+0.37 |
+0.53% |
-3.12% |
| Biotech |
$BTK |
3,425.71 |
-38.26 |
-1.10% |
-10.18% |
|
|
|
 |
Found Support While Building on a New "Double Bottom" Base Pattern
Kenneth J. Gruneisen - Passed the CAN SLIM® Master's Exam
Patrick Industries Inc (PATK +$0.77 or +1.20% to $64.85) rallied above its 50-day moving average (DMA) line ($63.23) with above average volume behind a considerable gain on the prior session and its color code was changed to yellow. Little resistance exists due to overhead supply, and a new pivot point is cited based on its 9/06 16 high while building on a "double bottom" base. Subsequent volume-driven gains above the pivot point may trigger a new (or add-on) technical buy signal. Meanwhile, more damaging losses below the 50 DMA line again would raise concerns.
PATK was last shown in this FSU section on 8/31/16 with an annotated graph under the headline, "Building a New Base Above 50-Day Moving Average Line". It reported earnings +41% on +35% sales revenues for the Jun '16 quarter, continuing its streak of quarterly comparisons steadily above the +25% minimum earnings guideline (C criteria). A small downturn in FY '13 was a flaw previously noted in its annual earnings (A criteria) history. It was first highlighted in yellow with pivot point based on its 4/28/16 high plus 10 cents in the 5/24/16 mid-day report (read here).
Its current Up/Down Volume ratio of 1.4 is an unbiased indication that its shares were under accumulation over the past 50 days. The number of top-rated funds owning its share rose from 218 in Jun '15 to 268 in Jun '16, a reassuring trend concerning the I criteria. Its small supply of 14.3 million shares (S criteria) in the public float can contribute to greater price volatility in the event of institutional buying or selling. |
|
|
Color Codes Explained :
Y - Better candidates highlighted by our
staff of experts.
G - Previously featured
in past reports as yellow but may no longer be buyable under the
guidelines.
***Last / Change / Volume data in this table is the closing quote data***
Symbol/Exchange
Company Name
Industry Group |
PRICE |
CHANGE
(%Change) |
Day High |
Volume
(% DAV)
(% 50 day avg vol) |
52 Wk Hi
% From Hi |
Featured
Date |
Price
Featured |
Pivot Featured |
|
Max Buy |
TDG
-
NYSE
Transdigm Group Inc
AEROSPACE/DEFENSE - Aerospace/Defense Products and; Services
|
$291.34
|
+0.77
0.26% |
$292.57
|
202,940
61.68% of 50 DAV
50 DAV is 329,000
|
$294.38
-1.03%
|
5/11/2016
|
$248.33
|
PP = $245.00
|
|
MB = $257.25
|
Most Recent Note - 9/26/2016 5:42:56 PM
G - Rallied further above its 50 DMA line ($282) toward prior highs with today's volume-driven gain. Subsequent losses undercutting the 50 DMA line or recent low ($278.52) would raise greater concerns
>>> FEATURED STOCK ARTICLE : Light Volume Behind Gains Wedging for New Highs - 9/7/2016 |
View all notes |
Set NEW NOTE alert |
Company Profile |
SEC
News |
Chart |
Request a new note
C
A
S
I |
IESC
-
NASDAQ
I E S Holdings Inc
Bldg-Maintenance and Svc
|
$17.38
|
+0.56
3.33% |
$17.48
|
108,421
135.53% of 50 DAV
50 DAV is 80,000
|
$18.16
-4.30%
|
7/26/2016
|
$15.79
|
PP = $15.74
|
|
MB = $16.53
|
 Most Recent Note - 9/28/2016 12:26:41 PM
G - Wedging higher with gains lacking great volume conviction after recently finding support at its 50 DMA line ($15.64). That short-term average and the prior low ($15.00 on 9/14/16) define near-term support. See the latest FSU analysis for additional details and an annotated graph.
>>> FEATURED STOCK ARTICLE : Wedging Higher With Recent Gains Lacking Great Volume - 9/27/2016 |
View all notes |
Set NEW NOTE alert |
Company Profile |
SEC
News |
Chart |
Request a new note
C
A
S
I |
NTES
-
NASDAQ
Netease Inc Adr
INTERNET - Internet Information Providers
|
$243.49
|
-0.66
-0.27% |
$246.23
|
594,817
51.95% of 50 DAV
50 DAV is 1,145,000
|
$254.48
-4.32%
|
6/29/2016
|
$182.42
|
PP = $186.55
|
|
MB = $195.88
|
Most Recent Note - 9/26/2016 12:41:29 PM
G - Gapped down today retreating after getting very extended from any sound base. Its 50 DMA line ($214.72) defines near-term support to watch.
>>> FEATURED STOCK ARTICLE : Extended From Prior Base After +37% Rally Since Featured 6/29/16 - 9/21/2016 |
View all notes |
Set NEW NOTE alert |
Company Profile |
SEC
News |
Chart |
Request a new note
C
A
S
I |
HTHT
-
NASDAQ
China Lodging Group Ads
LEISURE - Lodging
|
$45.58
|
+0.33
0.73% |
$45.65
|
105,300
54.28% of 50 DAV
50 DAV is 194,000
|
$47.72
-4.48%
|
7/13/2016
|
$38.87
|
PP = $39.29
|
|
MB = $41.25
|
Most Recent Note - 9/27/2016 5:44:37 PM
G - Volume totals have still been cooling while stubbornly holding its ground near all-time highs. Prior highs and its 50 DMA line in the $41 area define near term support to watch on pullbacks.
>>> FEATURED STOCK ARTICLE : Possibly Forming New Base While Holding Ground Near Highs - 9/20/2016 |
View all notes |
Set NEW NOTE alert |
Company Profile |
SEC
News |
Chart |
Request a new note
C
A
S
I |
PATK
-
NASDAQ
Patrick Industries Inc
WHOLESALE - Building Materials Wholesale
|
$64.85
|
+0.77
1.20% |
$65.18
|
176,856
82.64% of 50 DAV
50 DAV is 214,000
|
$69.53
-6.73%
|
9/28/2016
|
$64.85
|
PP = $66.87
|
|
MB = $70.21
|
Most Recent Note - 9/28/2016 5:40:39 PM
Y - Rallied above its 50 DMA line with above average volume behind a considerable gain on the prior session. Color code was changed to yellow and a new pivot point was cited based on its 9/06/16 high. See the latest FSU analysis for more details and a new annotated graph.
>>> FEATURED STOCK ARTICLE : Found Support While Building on a New "Double Bottom" Base Pattern - 9/28/2016 |
View all notes |
Set NEW NOTE alert |
Company Profile |
SEC
News |
Chart |
Request a new note
C
A
S
I |
Symbol/Exchange
Company Name
Industry Group |
PRICE |
CHANGE
(%Change) |
Day High |
Volume
(% DAV)
(% 50 day avg vol) |
52 Wk Hi
% From Hi |
Featured
Date |
Price
Featured |
Pivot Featured |
|
Max Buy |
LGIH
-
NASDAQ
L G I Homes Inc
Bldg-Resident/Comml
|
$36.73
|
+0.51
1.41% |
$36.91
|
187,716
34.25% of 50 DAV
50 DAV is 548,000
|
$40.47
-9.24%
|
8/29/2016
|
$37.08
|
PP = $36.44
|
|
MB = $38.26
|
Most Recent Note - 9/26/2016 5:38:11 PM
Y - Still quietly consolidating above its 50 DMA line ($35.54). Violations of the 50 DMA line and recent lows ($34.18 on 9/09/16) would raise greater concerns and trigger worrisome technical sell signals.
>>> FEATURED STOCK ARTICLE : Finished Strong While Rallying From Cup-With-Handle Base - 8/29/2016 |
View all notes |
Set NEW NOTE alert |
Company Profile |
SEC
News |
Chart |
Request a new note
C
A
S
I |
SFBS
-
NASDAQ
"ServisFirst Bancshares, Inc"
BANKING - Regional - Southeast Banks
|
$52.00
|
+0.54
1.05% |
$52.07
|
33,701
57.22% of 50 DAV
50 DAV is 58,900
|
$53.58
-2.95%
|
7/19/2016
|
$53.28
|
PP = $52.82
|
|
MB = $55.46
|
Most Recent Note - 9/26/2016 5:40:48 PM
G - Gapped down today and undercut its 50 DMA line raising concerns and its color code is changed to green. Only a prompt rebound above the 50 DMA line would help its outlook improve. See the latest FSU analysis for more details and an annotated graph.
>>> FEATURED STOCK ARTICLE : Relative Strength Rating is Under Guidelines While Perched Near Highs - 9/22/2016 |
View all notes |
Set NEW NOTE alert |
Company Profile |
SEC
News |
Chart |
Request a new note
C
A
S
I |
INGN
-
NASDAQ
Inogen Inc
HEALTH SERVICES - Medical Instruments and Supplies
|
$59.50
|
+0.00
0.00% |
$59.91
|
112,267
60.04% of 50 DAV
50 DAV is 187,000
|
$61.87
-3.83%
|
8/5/2016
|
$51.72
|
PP = $56.08
|
|
MB = $58.88
|
Most Recent Note - 9/27/2016 5:43:56 PM
G - Quietly holding its ground, extended from any sound base. Its 50 DMA line ($56.51) defines important near-term support coinciding with its Sep '15 highs.
>>> FEATURED STOCK ARTICLE : Stubbornly Holding Ground Near All-Time High - 9/12/2016 |
View all notes |
Set NEW NOTE alert |
Company Profile |
SEC
News |
Chart |
Request a new note
C
A
S
I |
|
|
|
THESE ARE NOT BUY RECOMMENDATIONS!
Comments contained in the body of this report are technical
opinions only. The material herein has been obtained
from sources believed to be reliable and accurate, however,
its accuracy and completeness cannot be guaranteed.
This site is not an investment advisor, hence it does
not endorse or recommend any securities or other investments.
Any recommendation contained in this report may not
be suitable for all investors and it is not to be deemed
an offer or solicitation on our part with respect to
the purchase or sale of any securities. All trademarks,
service marks and trade names appearing in this report
are the property of their respective owners, and are
likewise used for identification purposes only.
This report is a service available
only to active Paid Premium Members.
You may opt-out of receiving report notifications
at any time. Questions or comments may be submitted
by writing to Premium Membership Services 665 S.E. 10 Street, Suite 201 Deerfield Beach, FL 33441-5634 or by calling 1-800-965-8307
or 954-785-1121.
|
|
|