You are not logged in.
This means you
CAN ONLY VIEW reports that were published prior to Saturday, April 5, 2025.
You
MUST UPGRADE YOUR MEMBERSHIP if you want to see any current reports.
AFTER MARKET UPDATE - WEDNESDAY, SEPTEMBER 21ST, 2016
Previous After Market Report Next After Market Report >>>
|
|
|
|
DOW |
+163.74 |
18,293.70 |
+0.90% |
|
Volume |
873,743,630 |
+18% |
|
Volume |
1,836,150,500 |
+19% |
|
NASDAQ |
+53.83 |
5,295.18 |
+1.03% |
|
Advancers |
2,600 |
86% |
|
Advancers |
2,063 |
72% |
|
S&P 500 |
+23.36 |
2,163.12 |
+1.09% |
|
Decliners |
416 |
14% |
|
Decliners |
792 |
28% |
|
Russell 2000 |
+16.71 |
1,245.04 |
+1.36% |
|
52 Wk Highs |
71 |
|
|
52 Wk Highs |
96 |
|
|
S&P 600 |
+10.77 |
753.13 |
+1.45% |
|
52 Wk Lows |
18 |
|
|
52 Wk Lows |
32 |
|
|
 |
Major Indices Rebound Further With Big Gains on Higher Volume
Kenneth J. Gruneisen - Passed the CAN SLIM® Master's Exam
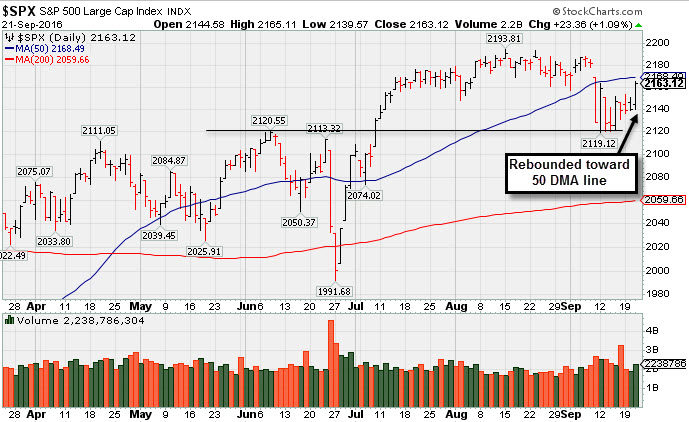
Stocks finished firmly higher on Wednesday. The Dow was up 163 points to 18293. The S&P 500 added 23 points to 2163 and the Nasdaq Composite gained 53 points to 5295. The volume totals were higher than the prior session on the NYSE and on the Nasdaq exchange. Advancers led decliners by more than a 6-1 margin on the NYSE and by nearly 3-1 on the Nasdaq exchange. There were 30 high-ranked companies from the Leaders List that made new 52-week highs and were listed on the BreakOuts Page, versus the total of 19 on the prior session. New 52-week highs outnumbered new 52-week lows on the NYSE and on the Nasdaq exchange. PICTURED: The S&P 500 Index rebounded with higher volume behind its gain. It remains below its 50-day moving average (DMA) line which may act as resistance following damaging volume-driven losses.
The major indices' charts have shown the worrisome look of a "correction", and the recently noted "healthy crop" of leading stocks has withered considerably. In periods of market weakness the fact-based investment system suggests reducing exposure to stocks as they weaken and on a case-by-case basis. Technical damage for the market (M criteria) remains while both the Dow Jones Industrial Average and the S&P 500 Index have failed to rebounded from below their respective 50-day moving average (DMA) lines. The Featured Stocks Page lists noteworthy candidates that have made headway.
The major averages rallied late in the session after Federal Reserve officials signaled a strong indication that rates could increase before the end of the year. The central bank left the benchmark interest rate unchanged amid mixed economic growth and below-target inflation. Overseas, the Bank of Japan kept its benchmark interest rate in negative territory but will aim to push yields on long-term government bonds higher.
All 11 sectors in the S&P 500 finished in positive territory with Energy shares leading the advance. In earnings, FedEx (FDX +6.89%) rallied as the delivery services company posted better-than-expected quarterly profit and revenue. Shares of Adobe (ADBE +7.12%) rose after providing upbeat current-quarter guidance. In the consumer space, Target (TGT +1.24%) rose amid news the retailer announced a $5 billion stock repurchase program. Carmax (KMX -2.04%) fell after citing a slowdown in showroom traffic. American Airlines (AAL -1.37%) was a notable decliner after being the subject of negative analyst commentary.
Treasuries finished higher with the benchmark 10-year note up 8/32 to yield 1.66%. In commodities, NYMEX WTI crude added 3.4% to $45.55/barrel. COMEX gold gained 1.5% to $1333.10/ounce. In FOREX, the Dollar Index fell 0.5% |
 Kenneth J. Gruneisen started out as a licensed stockbroker in August 1987, a couple of months prior to the historic stock market crash that took the Dow Jones Industrial Average down -22.6% in a single day. He has published daily fact-based fundamental and technical analysis on high-ranked stocks online for two decades. Through FACTBASEDINVESTING.COM, Kenneth provides educational articles, news, market commentary, and other information regarding proven investment systems that work in good times and bad.
Comments contained in the body of this report are technical opinions only and are not necessarily those of Gruneisen Growth Corp. The material herein has been obtained from sources believed to be reliable and accurate, however, its accuracy and completeness cannot be guaranteed. Our firm, employees, and customers may effect transactions, including transactions contrary to any recommendation herein, or have positions in the securities mentioned herein or options with respect thereto. Any recommendation contained in this report may not be suitable for all investors and it is not to be deemed an offer or solicitation on our part with respect to the purchase or sale of any securities. |
|
 |
Gold & Silver, Energy, Tech, Retail and Financial Indexes Rose
Kenneth J. Gruneisen - Passed the CAN SLIM® Master's Exam
The Networking Index ($NWX +1.47%), Semiconductor Index ($SOX +1.44%), and the Biotechnology Index ($BTK +1.04%) posted unanimous gains on Wednesday. The Broker/Dealer Index ($XBD +1.110%) and the Bank Index ($BKX +0.50%) both edged higher along with a solid gain from the Retail Index ($RLX +0.87%). The Gold & Silver Index ($XAU +7.32%) posted a standout gain while energy-linked groups including the Integrated Oil Index ($XOI +2.16%) and the Oil Services Index ($OSX +2.57%) both ended the session solidly higher. Charts courtesy www.stockcharts.com
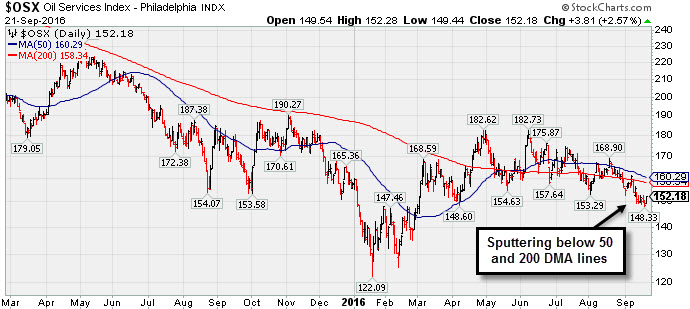
PICTURED: The Oil Services Index ($OSX +2.57%) is still sputtering below its 50-day and 200-day moving average (DMA) lines.
| Oil Services |
$OSX |
152.18 |
+3.81 |
+2.57% |
-3.52% |
| Integrated Oil |
$XOI |
1,117.81 |
+23.64 |
+2.16% |
+4.20% |
| Semiconductor |
$SOX |
810.65 |
+11.54 |
+1.44% |
+22.18% |
| Networking |
$NWX |
398.91 |
+5.79 |
+1.47% |
+6.11% |
| Broker/Dealer |
$XBD |
174.05 |
+1.91 |
+1.11% |
-2.27% |
| Retail |
$RLX |
1,329.52 |
+11.46 |
+0.87% |
+3.59% |
| Gold & Silver |
$XAU |
99.20 |
+6.77 |
+7.32% |
+118.98% |
| Bank |
$BKX |
71.15 |
+0.35 |
+0.49% |
-2.64% |
| Biotech |
$BTK |
3,445.11 |
+35.42 |
+1.04% |
-9.67% |
|
|
|
 |
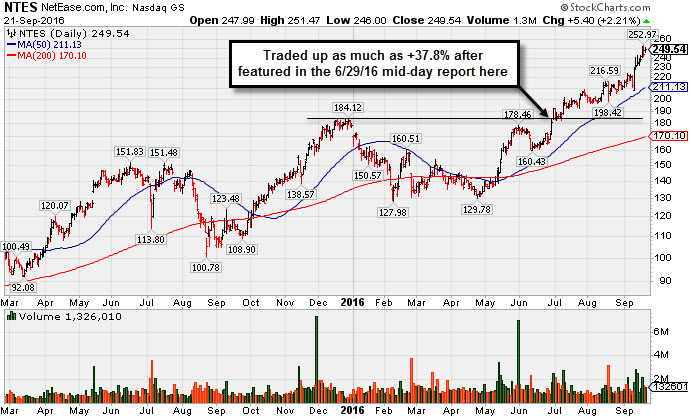
Extended From Prior Base After +37% Rally Since Featured 6/29/16
Kenneth J. Gruneisen - Passed the CAN SLIM® Master's Exam
Netease Inc (NTES +5.40% or +2.21% to $249.54) is perched at all-time highs today, very extended from any sound base. Its 50-day moving average (DMA) line ($211) defines near-term support to watch on pullbacks. NTES was last shown in this FSU section on 8/18/16 with an annotated graph under the headline, "Pulled Back on Higher Volume Following Earnings Report", as it pulled back with above average volume. It reported earnings +89% on +83% sales revenues for the Jun '16 quarter, continuing its strong earnings track record and marking its 4th consecutive quarter with earnings above the +25% minimum guideline (C criteria). Annual earnings (A criteria) growth also has been strong.
Since shown in this FSU section on 6/29/16 the Computer Software - gaming group has seen its Group Relative Strength Rating of rise to 97 from 37, a reassuring improvement regarding the L criteria. NTES has traded up as much +37.8% since highlighted in yellow with pivot point cited based on its 12/29/15 high plus 10 cents in the 6/29/16 mid-day report (read here).
The number of top-rated funds owning its shares rose from 467 in Jun '15 to 787 in Jun '16, a reassuring sign concerning the I criteria. Its current Up/Down Volume Ratio of 1.6 is also an unbiased indication its shares have been under accumulation over the past 50 days. |
|
|
Color Codes Explained :
Y - Better candidates highlighted by our
staff of experts.
G - Previously featured
in past reports as yellow but may no longer be buyable under the
guidelines.
***Last / Change / Volume data in this table is the closing quote data***
Symbol/Exchange
Company Name
Industry Group |
PRICE |
CHANGE
(%Change) |
Day High |
Volume
(% DAV)
(% 50 day avg vol) |
52 Wk Hi
% From Hi |
Featured
Date |
Price
Featured |
Pivot Featured |
|
Max Buy |
TDG
-
NYSE
Transdigm Group Inc
AEROSPACE/DEFENSE - Aerospace/Defense Products and; Services
|
$282.69
|
+2.98
1.07% |
$282.69
|
322,588
97.17% of 50 DAV
50 DAV is 332,000
|
$294.38
-3.97%
|
5/11/2016
|
$248.33
|
PP = $245.00
|
|
MB = $257.25
|
 Most Recent Note - 9/21/2016 6:47:22 PM
G - Found support today near its 50 DMA line ($281). More damaging losses would raise greater concerns
>>> FEATURED STOCK ARTICLE : Light Volume Behind Gains Wedging for New Highs - 9/7/2016 |
View all notes |
Set NEW NOTE alert |
Company Profile |
SEC
News |
Chart |
Request a new note
C
A
S
I |
IESC
-
NASDAQ
I E S Holdings Inc
Bldg-Maintenance and Svc
|
$16.01
|
+0.28
1.78% |
$16.13
|
51,213
61.70% of 50 DAV
50 DAV is 83,000
|
$18.16
-11.84%
|
7/26/2016
|
$15.79
|
PP = $15.74
|
|
MB = $16.53
|
Most Recent Note - 9/20/2016 5:30:24 PM
G - Consolidating above support at its 50 DMA line ($15.42) following a "negative reversal" noted on 9/06/16. Below that important short-term average, the prior low (13.50 on 8/02/16) defines the next important near-term support to watch.
>>> FEATURED STOCK ARTICLE : Strength Returned With Heavier Volume Gains for Highs - 8/30/2016 |
View all notes |
Set NEW NOTE alert |
Company Profile |
SEC
News |
Chart |
Request a new note
C
A
S
I |
NTES
-
NASDAQ
Netease Inc Adr
INTERNET - Internet Information Providers
|
$249.54
|
+5.40
2.21% |
$251.47
|
1,321,696
116.35% of 50 DAV
50 DAV is 1,136,000
|
$252.97
-1.36%
|
6/29/2016
|
$182.42
|
PP = $186.55
|
|
MB = $195.88
|
Most Recent Note - 9/21/2016 6:32:39 PM
G - Perched at all-time highs after getting very extended from any sound base. Its 50 DMA line ($211) defines near-term support to watch on pullbacks. See the latest FSU analysis for more details and a new annotated graph illustrating the +37.8% rally since featured in 6/29/16 mid-day report.
>>> FEATURED STOCK ARTICLE : Extended From Prior Base After +37% Rally Since Featured 6/29/16 - 9/21/2016 |
View all notes |
Set NEW NOTE alert |
Company Profile |
SEC
News |
Chart |
Request a new note
C
A
S
I |
HTHT
-
NASDAQ
China Lodging Group Ads
LEISURE - Lodging
|
$45.85
|
+0.27
0.59% |
$46.02
|
128,501
60.61% of 50 DAV
50 DAV is 212,000
|
$47.72
-3.92%
|
7/13/2016
|
$38.87
|
PP = $39.29
|
|
MB = $41.25
|
Most Recent Note - 9/20/2016 5:29:21 PM
G - Ended near session low with a gain today on light volume after challenging all-time highs. Prior highs and its 50 DMA line in the $41 area define near term support to watch on pullbacks. See latest FSU analysis for more details and a new annotated graph.
>>> FEATURED STOCK ARTICLE : Possibly Forming New Base While Holding Ground Near Highs - 9/20/2016 |
View all notes |
Set NEW NOTE alert |
Company Profile |
SEC
News |
Chart |
Request a new note
C
A
S
I |
PATK
-
NASDAQ
Patrick Industries Inc
WHOLESALE - Building Materials Wholesale
|
$60.05
|
+0.69
1.16% |
$60.37
|
175,470
83.16% of 50 DAV
50 DAV is 211,000
|
$69.53
-13.63%
|
9/8/2016
|
$64.74
|
PP = $69.63
|
|
MB = $73.11
|
Most Recent Note - 9/19/2016 5:20:16 PM
G - Still sputtering below its 50 DMA line, and gains above that short-term average are needed for its outlook to improve. New pivot point was recently cited based on its 7/28/16 high plus 10 cents, however gains above the pivot point with heavy volume did not show up after members were reminded - "Volume-driven gains for new highs may trigger a new (or add-on) technical buy signal."
>>> FEATURED STOCK ARTICLE : Building a New Base Above 50-Day Moving Average Line - 8/31/2016 |
View all notes |
Set NEW NOTE alert |
Company Profile |
SEC
News |
Chart |
Request a new note
C
A
S
I |
Symbol/Exchange
Company Name
Industry Group |
PRICE |
CHANGE
(%Change) |
Day High |
Volume
(% DAV)
(% 50 day avg vol) |
52 Wk Hi
% From Hi |
Featured
Date |
Price
Featured |
Pivot Featured |
|
Max Buy |
LGIH
-
NASDAQ
L G I Homes Inc
Bldg-Resident/Comml
|
$36.35
|
+0.96
2.71% |
$36.41
|
389,965
69.89% of 50 DAV
50 DAV is 558,000
|
$40.47
-10.18%
|
8/29/2016
|
$37.08
|
PP = $36.44
|
|
MB = $38.26
|
Most Recent Note - 9/21/2016 6:39:31 PM
Y - Consolidating just above its 50 DMA line ($35.35). Violations of the 50 DMA line and recent lows ($34.18 on 9/09/16) would raise greater concerns and trigger worrisome technical sell signals.
>>> FEATURED STOCK ARTICLE : Finished Strong While Rallying From Cup-With-Handle Base - 8/29/2016 |
View all notes |
Set NEW NOTE alert |
Company Profile |
SEC
News |
Chart |
Request a new note
C
A
S
I |
SFBS
-
NASDAQ
"ServisFirst Bancshares, Inc"
BANKING - Regional - Southeast Banks
|
$51.81
|
+0.89
1.75% |
$51.86
|
49,689
82.13% of 50 DAV
50 DAV is 60,500
|
$53.58
-3.30%
|
7/19/2016
|
$53.28
|
PP = $52.82
|
|
MB = $55.46
|
Most Recent Note - 9/21/2016 6:44:32 PM
Y - Color code is changed to yellow while still trading near its 50 DMA line ($51.35). Members were previously reminded - "A volume-driven gain and strong close above the pivot point are needed to clinch a convincing technical buy signal. It has been quietly consolidating since highlighted in yellow in the 7/19/16 mid-day report with pivot point cited based on the 6/01/16 high plus 10 cents."
>>> FEATURED STOCK ARTICLE : Still Consolidating Within Close Striking Distance of New Highs - 8/25/2016 |
View all notes |
Set NEW NOTE alert |
Company Profile |
SEC
News |
Chart |
Request a new note
C
A
S
I |
INGN
-
NASDAQ
Inogen Inc
HEALTH SERVICES - Medical Instruments and Supplies
|
$60.20
|
+0.47
0.79% |
$60.71
|
154,392
80.41% of 50 DAV
50 DAV is 192,000
|
$60.95
-1.23%
|
8/5/2016
|
$51.72
|
PP = $56.08
|
|
MB = $58.88
|
Most Recent Note - 9/21/2016 6:43:01 PM
G - Quietly consolidating above its "max buy" level, stubbornly holding its ground near its 52-week high. Its 50 DMA line ($55.79) defines important near-term support coinciding with its Sep '15 highs.
>>> FEATURED STOCK ARTICLE : Stubbornly Holding Ground Near All-Time High - 9/12/2016 |
View all notes |
Set NEW NOTE alert |
Company Profile |
SEC
News |
Chart |
Request a new note
C
A
S
I |
|
|
|
THESE ARE NOT BUY RECOMMENDATIONS!
Comments contained in the body of this report are technical
opinions only. The material herein has been obtained
from sources believed to be reliable and accurate, however,
its accuracy and completeness cannot be guaranteed.
This site is not an investment advisor, hence it does
not endorse or recommend any securities or other investments.
Any recommendation contained in this report may not
be suitable for all investors and it is not to be deemed
an offer or solicitation on our part with respect to
the purchase or sale of any securities. All trademarks,
service marks and trade names appearing in this report
are the property of their respective owners, and are
likewise used for identification purposes only.
This report is a service available
only to active Paid Premium Members.
You may opt-out of receiving report notifications
at any time. Questions or comments may be submitted
by writing to Premium Membership Services 665 S.E. 10 Street, Suite 201 Deerfield Beach, FL 33441-5634 or by calling 1-800-965-8307
or 954-785-1121.
|
|
|