You are not logged in.
This means you
CAN ONLY VIEW reports that were published prior to Thursday, May 1, 2025.
You
MUST UPGRADE YOUR MEMBERSHIP if you want to see any current reports.
AFTER MARKET UPDATE - THURSDAY, SEPTEMBER 22ND, 2016
Previous After Market Report Next After Market Report >>>
|
|
|
|
DOW |
+98.76 |
18,392.46 |
+0.54% |
|
Volume |
833,389,750 |
-5% |
|
Volume |
1,754,539,430 |
-4% |
|
NASDAQ |
+44.34 |
5,339.52 |
+0.84% |
|
Advancers |
2,504 |
83% |
|
Advancers |
2,049 |
72% |
|
S&P 500 |
+14.06 |
2,177.18 |
+0.65% |
|
Decliners |
521 |
17% |
|
Decliners |
805 |
28% |
|
Russell 2000 |
+18.40 |
1,263.44 |
+1.48% |
|
52 Wk Highs |
154 |
|
|
52 Wk Highs |
203 |
|
|
S&P 600 |
+11.51 |
764.64 |
+1.53% |
|
52 Wk Lows |
2 |
|
|
52 Wk Lows |
19 |
|
|
 |
Leadership Improved as Nasdaq Rallied into Record Territory
Kenneth J. Gruneisen - Passed the CAN SLIM® Master's Exam
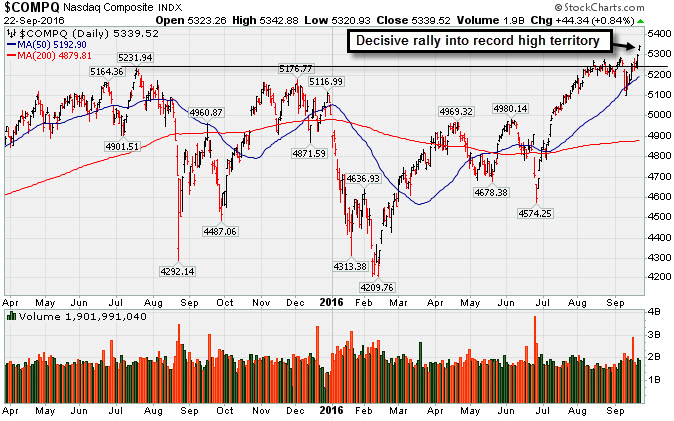
Stocks finished higher on Thursday. The Dow was up 98 points to 18392. The S&P 500 added 14 points to 2177 and the Nasdaq Composite gained 44 points to 5339. The volume totals were lighter than the prior session on the NYSE and on the Nasdaq exchange, revealing a lack of institutional buying demand behind the gains. Advancers led decliners by nearly a 5-1 margin on the NYSE and by 5-2 on the Nasdaq exchange. Leadership improved as there were 58 high-ranked companies from the Leaders List that made new 52-week highs and were listed on the BreakOuts Page, versus the total of 30 on the prior session. New 52-week highs totals expanded and solidly outnumbered new 52-week lows on both the NYSE and the Nasdaq exchange. PICTURED: The Nasdaq Composite Index found support near its 50-day moving average (DMA) line and it has resumed rallying decisively into record high territory.
The S&P 500 Index rebounded above its 50-day moving average (DMA) line convincingly on Thursday, however the Dow Jones Industrial Average met resistance at its respective short-term average. Breadth was positive and leadership improved. Technical strength in the market (M criteria) is noted as a reassuring sign for investors who may be considering new buy candidates in the days and weeks ahead. The Featured Stocks Page lists noteworthy candidates.
The major averages advanced for a third session as Real Estate shares rallied and investors digested the Federal Reserve’s decision yesterday to leave interest rates unchanged. The central bank elected to wait for further evidence of stronger inflation while also scaling back the number of hikes it expects in 2017. On the data front, existing home sales unexpectedly declined to a six-month low in August. Initial jobless claims came in at 252,000, below the reported 260,000 in the previous week.
All 11 sectors in the S&P 500 finished in positive territory. Real Estate shares paced the gains with Weyerhaeuser (WY +5.74%) rose after being the subject of positive analyst commentary. In Tech, Red Hat (RHT +3.87%) rose as the software provider reported better-than-expected quarterly profit. On the M&A front, WCI Communities (WCIC +37.94%) rose after agreeing to a $643 million takeover bid from rival homebuilder Lennar Corp (LEN +0.35%). AutoZone (AZO -0.43%) was a notable decliner as the auto parts retailer’s revenue missed Wall Street estimates despite a double-digit increase in year-over-year earnings.
Treasuries advanced with the benchmark 10-year note up 8/32 to yield 1.62%. In commodities, NYMEX WTI crude added 1.7% to $46.13/barrel. In FOREX, the Dollar Index fell 0.3%. |
 Kenneth J. Gruneisen started out as a licensed stockbroker in August 1987, a couple of months prior to the historic stock market crash that took the Dow Jones Industrial Average down -22.6% in a single day. He has published daily fact-based fundamental and technical analysis on high-ranked stocks online for two decades. Through FACTBASEDINVESTING.COM, Kenneth provides educational articles, news, market commentary, and other information regarding proven investment systems that work in good times and bad.
Comments contained in the body of this report are technical opinions only and are not necessarily those of Gruneisen Growth Corp. The material herein has been obtained from sources believed to be reliable and accurate, however, its accuracy and completeness cannot be guaranteed. Our firm, employees, and customers may effect transactions, including transactions contrary to any recommendation herein, or have positions in the securities mentioned herein or options with respect thereto. Any recommendation contained in this report may not be suitable for all investors and it is not to be deemed an offer or solicitation on our part with respect to the purchase or sale of any securities. |
|
 |
Tech, Retail, Energy and Financial Groups Rose
Kenneth J. Gruneisen - Passed the CAN SLIM® Master's Exam
The Networking Index ($NWX +1.35%), Semiconductor Index ($SOX +0.35%), and the Biotechnology Index ($BTK +0.71%) posted unanimous gains on Thursday. The Broker/Dealer Index ($XBD +0.60%) and the Bank Index ($BKX +0.20%) both edged higher along with another solid gain from the Retail Index ($RLX +0.85%). Energy-linked groups including the Integrated Oil Index ($XOI +0.33%) and the Oil Services Index ($OSX +1.14%) both edged higher, meanwhile the Gold & Silver Index ($XAU -0.43%) pulled back from its prior big gain. Charts courtesy www.stockcharts.com
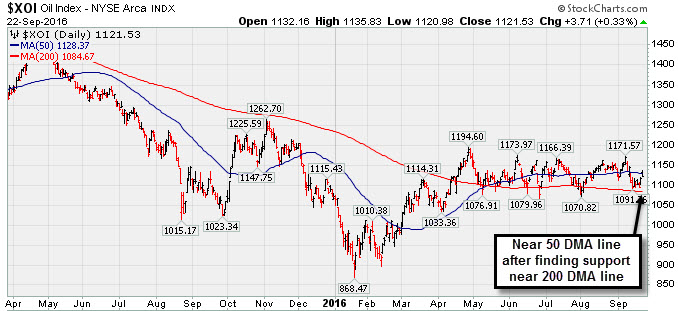
PICTURED: The Integrated Oil Index ($XOI +0.33%) is near its 50-day moving average (DMA) line after finding support near its 200 DMA line.
| Oil Services |
$OSX |
153.90 |
+1.72 |
+1.13% |
-2.43% |
| Integrated Oil |
$XOI |
1,121.53 |
+3.71 |
+0.33% |
+4.55% |
| Semiconductor |
$SOX |
813.51 |
+2.86 |
+0.35% |
+22.61% |
| Networking |
$NWX |
404.28 |
+5.37 |
+1.35% |
+7.54% |
| Broker/Dealer |
$XBD |
175.09 |
+1.04 |
+0.60% |
-1.68% |
| Retail |
$RLX |
1,340.79 |
+11.27 |
+0.85% |
+4.47% |
| Gold & Silver |
$XAU |
98.78 |
-0.42 |
-0.42% |
+118.06% |
| Bank |
$BKX |
71.30 |
+0.14 |
+0.20% |
-2.44% |
| Biotech |
$BTK |
3,469.67 |
+24.56 |
+0.71% |
-9.03% |
|
|
|
 |
Relative Strength Rating is Under Guidelines While Perched Near Highs
Kenneth J. Gruneisen - Passed the CAN SLIM® Master's Exam
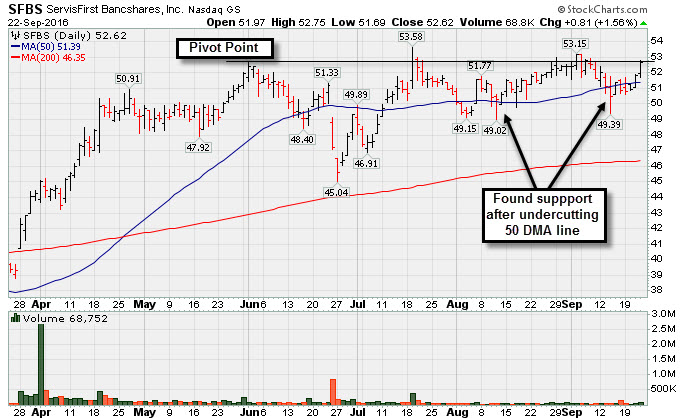
ServisFirst Bancshares Inc (SFBS +$0.81 or +1.56% to $52.62) rose within close striking distance of its 52-week high with its gain on Thursday. A new pivot point might be cited based on its 7/19/16 high, however, it has made little headway in recent months and its Relative Strength Rating has slumped to a 74 currently, below the 80+ minimum guideline for buy candidates under the fact-based investment system.
It was last shown in this FSU section on 8/25/16 with an annotated graph under the headline, "Still Consolidating Within Close Striking Distance of New Highs". SFBS reported earnings +31% on +17% sales revenues for the Jun '16 quarter, its 3rd consecutive quarterly comparison above the +25% minimum earnings guideline (C criteria), helping it better match the fact-based investment system's guidelines. Earnings rose +28% and +34% in the Dec '15 and Mar '16 quarters, respectively, and underlying sales revenues growth has been in the +17-26% range. Its annual earnings (A criteria) history has been strong.
The number of top-rated funds owning its shares rose from 159 in Sep '15 to 233 in Jun '16, a reassuring sign concerning the I criteria. Its current Up/Down Volume Ratio of 1.1 is an unbiased indication its shares have been only under slight accumulation over the past 50 days. Its small supply of only 23.1 million shares (S criteria) in the public float can contribute to greater price volatility in the event of institutional buying or selling. |
|
|
Color Codes Explained :
Y - Better candidates highlighted by our
staff of experts.
G - Previously featured
in past reports as yellow but may no longer be buyable under the
guidelines.
***Last / Change / Volume data in this table is the closing quote data***
Symbol/Exchange
Company Name
Industry Group |
PRICE |
CHANGE
(%Change) |
Day High |
Volume
(% DAV)
(% 50 day avg vol) |
52 Wk Hi
% From Hi |
Featured
Date |
Price
Featured |
Pivot Featured |
|
Max Buy |
TDG
-
NYSE
Transdigm Group Inc
AEROSPACE/DEFENSE - Aerospace/Defense Products and; Services
|
$286.85
|
+4.16
1.47% |
$288.69
|
271,594
81.81% of 50 DAV
50 DAV is 332,000
|
$294.38
-2.56%
|
5/11/2016
|
$248.33
|
PP = $245.00
|
|
MB = $257.25
|
Most Recent Note - 9/21/2016 6:47:22 PM
G - Found support today near its 50 DMA line ($281). More damaging losses would raise greater concerns
>>> FEATURED STOCK ARTICLE : Light Volume Behind Gains Wedging for New Highs - 9/7/2016 |
View all notes |
Set NEW NOTE alert |
Company Profile |
SEC
News |
Chart |
Request a new note
C
A
S
I |
IESC
-
NASDAQ
I E S Holdings Inc
Bldg-Maintenance and Svc
|
$16.91
|
+0.90
5.62% |
$16.98
|
60,141
74.25% of 50 DAV
50 DAV is 81,000
|
$18.16
-6.88%
|
7/26/2016
|
$15.79
|
PP = $15.74
|
|
MB = $16.53
|
 Most Recent Note - 9/22/2016 4:42:14 PM
G - Wedging higher with gains lacking great volume conviction after recently finding support at its 50 DMA line ($15.48). That short-term average and the prior low ($15.00 on 9/14/16) define near-term support.
>>> FEATURED STOCK ARTICLE : Strength Returned With Heavier Volume Gains for Highs - 8/30/2016 |
View all notes |
Set NEW NOTE alert |
Company Profile |
SEC
News |
Chart |
Request a new note
C
A
S
I |
NTES
-
NASDAQ
Netease Inc Adr
INTERNET - Internet Information Providers
|
$252.05
|
+2.51
1.01% |
$254.48
|
1,284,914
114.01% of 50 DAV
50 DAV is 1,127,000
|
$252.97
-0.36%
|
6/29/2016
|
$182.42
|
PP = $186.55
|
|
MB = $195.88
|
Most Recent Note - 9/22/2016 12:51:41 PM
G - Steadily hitting new all-time highs but very extended from any sound base. Its 50 DMA line ($212) defines near-term support to watch on pullbacks. See the latest FSU analysis for more details and an annotated graph illustrating the +38% rally since featured in 6/29/16 mid-day report.
>>> FEATURED STOCK ARTICLE : Extended From Prior Base After +37% Rally Since Featured 6/29/16 - 9/21/2016 |
View all notes |
Set NEW NOTE alert |
Company Profile |
SEC
News |
Chart |
Request a new note
C
A
S
I |
HTHT
-
NASDAQ
China Lodging Group Ads
LEISURE - Lodging
|
$46.74
|
+0.89
1.94% |
$46.89
|
156,359
75.17% of 50 DAV
50 DAV is 208,000
|
$47.72
-2.05%
|
7/13/2016
|
$38.87
|
PP = $39.29
|
|
MB = $41.25
|
Most Recent Note - 9/20/2016 5:29:21 PM
G - Ended near session low with a gain today on light volume after challenging all-time highs. Prior highs and its 50 DMA line in the $41 area define near term support to watch on pullbacks. See latest FSU analysis for more details and a new annotated graph.
>>> FEATURED STOCK ARTICLE : Possibly Forming New Base While Holding Ground Near Highs - 9/20/2016 |
View all notes |
Set NEW NOTE alert |
Company Profile |
SEC
News |
Chart |
Request a new note
C
A
S
I |
PATK
-
NASDAQ
Patrick Industries Inc
WHOLESALE - Building Materials Wholesale
|
$61.64
|
+1.59
2.65% |
$61.84
|
132,449
62.48% of 50 DAV
50 DAV is 212,000
|
$69.53
-11.35%
|
9/8/2016
|
$64.74
|
PP = $69.63
|
|
MB = $73.11
|
Most Recent Note - 9/22/2016 4:46:12 PM
G - Posted a second consecutive gain on light volume, still sputtering below its 50 DMA line. Gains above that short-term average are needed for its outlook to improve. More damaging losses would raise greater concerns.
>>> FEATURED STOCK ARTICLE : Building a New Base Above 50-Day Moving Average Line - 8/31/2016 |
View all notes |
Set NEW NOTE alert |
Company Profile |
SEC
News |
Chart |
Request a new note
C
A
S
I |
Symbol/Exchange
Company Name
Industry Group |
PRICE |
CHANGE
(%Change) |
Day High |
Volume
(% DAV)
(% 50 day avg vol) |
52 Wk Hi
% From Hi |
Featured
Date |
Price
Featured |
Pivot Featured |
|
Max Buy |
LGIH
-
NASDAQ
L G I Homes Inc
Bldg-Resident/Comml
|
$36.88
|
+0.53
1.46% |
$36.93
|
473,564
85.33% of 50 DAV
50 DAV is 555,000
|
$40.47
-8.87%
|
8/29/2016
|
$37.08
|
PP = $36.44
|
|
MB = $38.26
|
Most Recent Note - 9/21/2016 6:39:31 PM
Y - Consolidating just above its 50 DMA line ($35.35). Violations of the 50 DMA line and recent lows ($34.18 on 9/09/16) would raise greater concerns and trigger worrisome technical sell signals.
>>> FEATURED STOCK ARTICLE : Finished Strong While Rallying From Cup-With-Handle Base - 8/29/2016 |
View all notes |
Set NEW NOTE alert |
Company Profile |
SEC
News |
Chart |
Request a new note
C
A
S
I |
SFBS
-
NASDAQ
"ServisFirst Bancshares, Inc"
BANKING - Regional - Southeast Banks
|
$52.62
|
+0.81
1.56% |
$52.75
|
68,446
114.27% of 50 DAV
50 DAV is 59,900
|
$53.58
-1.79%
|
7/19/2016
|
$53.28
|
PP = $52.82
|
|
MB = $55.46
|
Most Recent Note - 9/22/2016 5:53:23 PM
Y - Perched within striking distance of its 52-week high. See the latest FSU analysis for more details and a new annotated graph.
>>> FEATURED STOCK ARTICLE : Relative Strength Rating is Under Guidelines While Perched Near Highs - 9/22/2016 |
View all notes |
Set NEW NOTE alert |
Company Profile |
SEC
News |
Chart |
Request a new note
C
A
S
I |
INGN
-
NASDAQ
Inogen Inc
HEALTH SERVICES - Medical Instruments and Supplies
|
$60.79
|
+0.59
0.98% |
$61.11
|
174,262
90.76% of 50 DAV
50 DAV is 192,000
|
$60.95
-0.26%
|
8/5/2016
|
$51.72
|
PP = $56.08
|
|
MB = $58.88
|
Most Recent Note - 9/22/2016 4:44:27 PM
G - Quietly hit another new high today, getting more extended from any sound base. Its 50 DMA line ($55.97) defines important near-term support coinciding with its Sep '15 highs.
>>> FEATURED STOCK ARTICLE : Stubbornly Holding Ground Near All-Time High - 9/12/2016 |
View all notes |
Set NEW NOTE alert |
Company Profile |
SEC
News |
Chart |
Request a new note
C
A
S
I |
|
|
|
THESE ARE NOT BUY RECOMMENDATIONS!
Comments contained in the body of this report are technical
opinions only. The material herein has been obtained
from sources believed to be reliable and accurate, however,
its accuracy and completeness cannot be guaranteed.
This site is not an investment advisor, hence it does
not endorse or recommend any securities or other investments.
Any recommendation contained in this report may not
be suitable for all investors and it is not to be deemed
an offer or solicitation on our part with respect to
the purchase or sale of any securities. All trademarks,
service marks and trade names appearing in this report
are the property of their respective owners, and are
likewise used for identification purposes only.
This report is a service available
only to active Paid Premium Members.
You may opt-out of receiving report notifications
at any time. Questions or comments may be submitted
by writing to Premium Membership Services 665 S.E. 10 Street, Suite 201 Deerfield Beach, FL 33441-5634 or by calling 1-800-965-8307
or 954-785-1121.
|
|
|