You are not logged in.
This means you
CAN ONLY VIEW reports that were published prior to Saturday, April 5, 2025.
You
MUST UPGRADE YOUR MEMBERSHIP if you want to see any current reports.
AFTER MARKET UPDATE - TUESDAY, SEPTEMBER 20TH, 2016
Previous After Market Report Next After Market Report >>>
|
|
|
|
DOW |
+9.79 |
18,129.96 |
+0.05% |
|
Volume |
741,239,360 |
-2% |
|
Volume |
1,548,336,310 |
-6% |
|
NASDAQ |
+6.32 |
5,241.35 |
+0.12% |
|
Advancers |
1,296 |
44% |
|
Advancers |
1,347 |
47% |
|
S&P 500 |
+0.64 |
2,139.76 |
+0.03% |
|
Decliners |
1,668 |
56% |
|
Decliners |
1,495 |
53% |
|
Russell 2000 |
-4.20 |
1,228.33 |
-0.34% |
|
52 Wk Highs |
33 |
|
|
52 Wk Highs |
81 |
|
|
S&P 600 |
-2.49 |
742.36 |
-0.33% |
|
52 Wk Lows |
26 |
|
|
52 Wk Lows |
35 |
|
|
 |
Less Leadership as Market Watchers Eye Fed Policy Meeting
Kenneth J. Gruneisen - Passed the CAN SLIM® Master's Exam
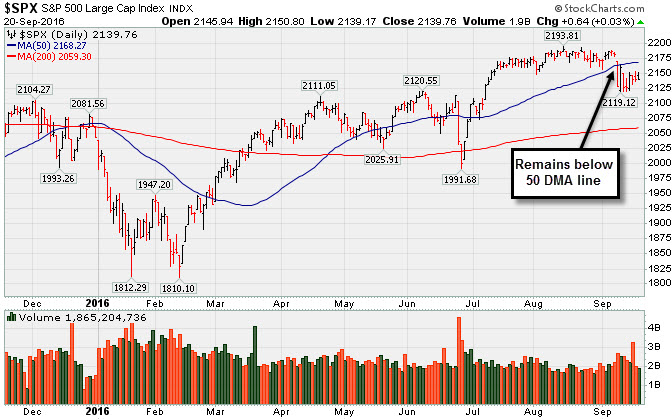
Stocks finished higher on Tuesday. The Dow was up 9 points to 18129. The S&P 500 added less than a point to 2139 and the Nasdaq Composite gained 6 points to 5241. The volume totals were lighter than the prior session on the NYSE and on the Nasdaq exchange. Decliners led advancers by a 4-3 margin on the NYSE and by a narrower margin on the Nasdaq exchange. There were 19 high-ranked companies from the Leaders List that made new 52-week highs and were listed on the BreakOuts Page, halving the total of 38 on the prior session. New 52-week highs outnumbered new 52-week lows on the NYSE and on the Nasdaq exchange. PICTURED: The S&P 500 Index is still sputtering below its 50-day moving average (DMA) line following damaging volume-driven losses.
The major indices' charts have shown the worrisome look of a "correction", and the recently noted "healthy crop" of leading stocks has withered considerably. In periods of market weakness the fact-based investment system suggests reducing exposure to stocks as they weaken and on a case-by-case basis. Technical damage for the market (M criteria) remains while both the Dow Jones Industrial Average and the S&P 500 Index have failed to rebounded from below their respective 50-day moving average (DMA) lines. The Featured Stocks Page lists noteworthy candidates that have made headway.
The major averages pared early gains to advance modestly on Tuesday as the Fed began its two-day September policy meeting. The central bank is widely expected to leave interest rates unchanged as investors digest mixed economic data and global growth concerns. On the data front, housing starts declined by 5.8% in August, well below analyst expectations. In a separate release, building permits fell 0.4% versus projections of a 1.8% increase.
Six of 11 sectors in the S&P 500 finished in negative territory. Health Care shares outperformed with DaVita (DVA +2.19%) after being the subject of positive analyst commentary. Shares of FedEx (FDX +0.86%) helped to lead Industrials higher amid reports the company plans to raise shipping rates in 2017. In earnings, Lennar Corp (LEN -3.53%) fell as the homebuilder reported new orders missed estimates. Ascena Retail (ASNA -29.93%) tumbled after providing weaker-than-expected forward guidance. In the consumer space, HNI Corp (HNI - 24.42%) fell as the office furniture manufacturer revised its third-quarter profit outlook lower.
Treasuries finished higher with the benchmark 10-year note up 7/32 to yield 1.68%. In commodities, NYMEX WTI crude added 0.3% to $43.44/barrel. In FOREX, the Dollar Index gained 0.2%. |
 Kenneth J. Gruneisen started out as a licensed stockbroker in August 1987, a couple of months prior to the historic stock market crash that took the Dow Jones Industrial Average down -22.6% in a single day. He has published daily fact-based fundamental and technical analysis on high-ranked stocks online for two decades. Through FACTBASEDINVESTING.COM, Kenneth provides educational articles, news, market commentary, and other information regarding proven investment systems that work in good times and bad.
Comments contained in the body of this report are technical opinions only and are not necessarily those of Gruneisen Growth Corp. The material herein has been obtained from sources believed to be reliable and accurate, however, its accuracy and completeness cannot be guaranteed. Our firm, employees, and customers may effect transactions, including transactions contrary to any recommendation herein, or have positions in the securities mentioned herein or options with respect thereto. Any recommendation contained in this report may not be suitable for all investors and it is not to be deemed an offer or solicitation on our part with respect to the purchase or sale of any securities. |
|
 |
Biotech Led as Financial and Retail Indexes Posted Smaller Gains
Kenneth J. Gruneisen - Passed the CAN SLIM® Master's Exam
The Networking Index ($NWX -0.64%) and the Semiconductor Index ($SOX -0.49%) suffered modest losses while the Biotechnology Index ($BTK +1.41%) posted a solid gain on Tuesday. The Broker/Dealer Index ($XBD +0.10%) and the Bank Index ($BKX +0.16%) both inched higher along with the Retail Index ($RLX +0.17%). The Gold & Silver Index ($XAU +0.17%) also edged higher, but weakness in energy-linked groups led the Integrated Oil Index ($XOI -0.74%) and the Oil Services Index ($OSX -0.98%) both lower. Charts courtesy www.stockcharts.com
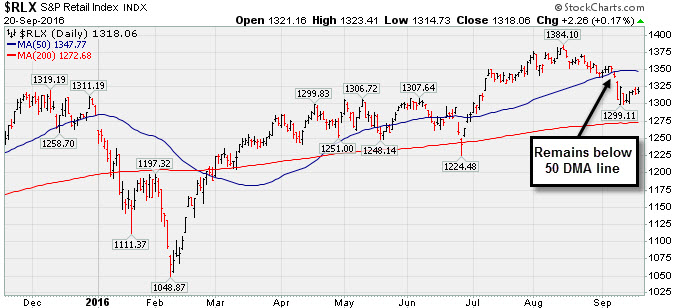
PICTURED: The Retail Index ($RLX +0.17%) is still consolidating below its 50-day moving average (DMA) line after recent weakness was noted. A rebound above that short-term average for the index would help the outlook for retail stocks.
| Oil Services |
$OSX |
148.37 |
-1.46 |
-0.97% |
-5.93% |
| Integrated Oil |
$XOI |
1,094.18 |
-8.16 |
-0.74% |
+2.00% |
| Semiconductor |
$SOX |
799.11 |
-3.95 |
-0.49% |
+20.44% |
| Networking |
$NWX |
393.12 |
-2.52 |
-0.64% |
+4.57% |
| Broker/Dealer |
$XBD |
172.14 |
+0.18 |
+0.10% |
-3.34% |
| Retail |
$RLX |
1,318.06 |
+2.26 |
+0.17% |
+2.70% |
| Gold & Silver |
$XAU |
92.43 |
+0.15 |
+0.16% |
+104.04% |
| Bank |
$BKX |
70.80 |
+0.12 |
+0.17% |
-3.12% |
| Biotech |
$BTK |
3,409.69 |
+47.54 |
+1.41% |
-10.60% |
|
|
|
 |
Possibly Forming New Base While Holding Ground Near Highs
Kenneth J. Gruneisen - Passed the CAN SLIM® Master's Exam
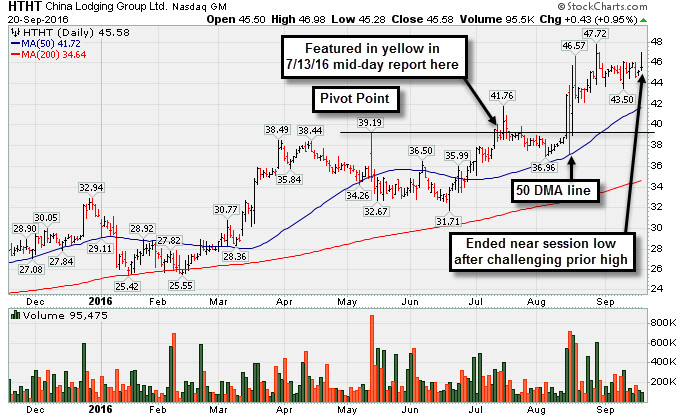
China Lodging Group Ads (HTHT +$0.43 or +0.95% to $45.58) finished near the session low with a small gain on light volume after challenging its all-time highs. It has traded up as much as +22.7% since first featured in yellow in the 7/13/16 mid-day report (read here). Prior highs and its 50-day moving average (DMA) line in the $41 area define near term support to watch on pullbacks.
It has been trading in a tight range and may be forming a new base. HTHT was last shown in this FSU section on 8/17/16 with an annotated graph under the headline, "Volume-Driven Gains for New Highs Signal Institutional Demand", after rallying above its "max buy" level for a new 52-week high (N criteria).
Recently it reported earnings +71% on +6% sales revenues for the Jun '16 quarter, continuing its strong earnings track record of increases greater than +25% versus the year-ago periods. The number of top-rated funds owing its shares rose from 87 in Sep '15 to 125 in Jun '16, a reassuring sign concerning the I criteria. Currently the high-ranked Leisure- Lodging firm has a B Timeliness rating and a D Sponsorship rating. Its small supply of 26.2 million shares (S criteria) in the public float may contribute to greater price volatility in the event of institutional buying or selling.
|
|
|
Color Codes Explained :
Y - Better candidates highlighted by our
staff of experts.
G - Previously featured
in past reports as yellow but may no longer be buyable under the
guidelines.
***Last / Change / Volume data in this table is the closing quote data***
Symbol/Exchange
Company Name
Industry Group |
PRICE |
CHANGE
(%Change) |
Day High |
Volume
(% DAV)
(% 50 day avg vol) |
52 Wk Hi
% From Hi |
Featured
Date |
Price
Featured |
Pivot Featured |
|
Max Buy |
TDG
-
NYSE
Transdigm Group Inc
AEROSPACE/DEFENSE - Aerospace/Defense Products and; Services
|
$279.71
|
-2.79
-0.99% |
$283.81
|
286,094
85.66% of 50 DAV
50 DAV is 334,000
|
$294.38
-4.98%
|
5/11/2016
|
$248.33
|
PP = $245.00
|
|
MB = $257.25
|
Most Recent Note - 9/16/2016 5:16:05 PM
G - Down today with twice average volume, slumping near its 50 DMA line ($280) defining important near-term support to watch.
>>> FEATURED STOCK ARTICLE : Light Volume Behind Gains Wedging for New Highs - 9/7/2016 |
View all notes |
Set NEW NOTE alert |
Company Profile |
SEC
News |
Chart |
Request a new note
C
A
S
I |
IESC
-
NASDAQ
I E S Holdings Inc
Bldg-Maintenance and Svc
|
$15.73
|
-0.38
-2.36% |
$16.24
|
44,216
52.64% of 50 DAV
50 DAV is 84,000
|
$18.16
-13.38%
|
7/26/2016
|
$15.79
|
PP = $15.74
|
|
MB = $16.53
|
 Most Recent Note - 9/20/2016 5:30:24 PM
G - Consolidating above support at its 50 DMA line ($15.42) following a "negative reversal" noted on 9/06/16. Below that important short-term average, the prior low (13.50 on 8/02/16) defines the next important near-term support to watch.
>>> FEATURED STOCK ARTICLE : Strength Returned With Heavier Volume Gains for Highs - 8/30/2016 |
View all notes |
Set NEW NOTE alert |
Company Profile |
SEC
News |
Chart |
Request a new note
C
A
S
I |
NTES
-
NASDAQ
Netease Inc Adr
INTERNET - Internet Information Providers
|
$244.14
|
-4.85
-1.95% |
$252.97
|
1,488,029
128.06% of 50 DAV
50 DAV is 1,162,000
|
$252.42
-3.28%
|
6/29/2016
|
$182.42
|
PP = $186.55
|
|
MB = $195.88
|
Most Recent Note - 9/20/2016 12:23:25 PM
G - Pulling back from new all-time highs today after getting very extended from any sound base. Its 50 DMA line ($210) defines near-term support.
>>> FEATURED STOCK ARTICLE : Pulled Back on Higher Volume Following Earnings Report - 8/18/2016 |
View all notes |
Set NEW NOTE alert |
Company Profile |
SEC
News |
Chart |
Request a new note
C
A
S
I |
HTHT
-
NASDAQ
China Lodging Group Ads
LEISURE - Lodging
|
$45.58
|
+0.43
0.95% |
$46.98
|
95,475
44.61% of 50 DAV
50 DAV is 214,000
|
$47.72
-4.48%
|
7/13/2016
|
$38.87
|
PP = $39.29
|
|
MB = $41.25
|
Most Recent Note - 9/20/2016 5:29:21 PM
G - Ended near session low with a gain today on light volume after challenging all-time highs. Prior highs and its 50 DMA line in the $41 area define near term support to watch on pullbacks. See latest FSU analysis for more details and a new annotated graph.
>>> FEATURED STOCK ARTICLE : Possibly Forming New Base While Holding Ground Near Highs - 9/20/2016 |
View all notes |
Set NEW NOTE alert |
Company Profile |
SEC
News |
Chart |
Request a new note
C
A
S
I |
PATK
-
NASDAQ
Patrick Industries Inc
WHOLESALE - Building Materials Wholesale
|
$59.36
|
-0.10
-0.17% |
$59.80
|
118,164
55.74% of 50 DAV
50 DAV is 212,000
|
$69.53
-14.63%
|
9/8/2016
|
$64.74
|
PP = $69.63
|
|
MB = $73.11
|
Most Recent Note - 9/19/2016 5:20:16 PM
G - Still sputtering below its 50 DMA line, and gains above that short-term average are needed for its outlook to improve. New pivot point was recently cited based on its 7/28/16 high plus 10 cents, however gains above the pivot point with heavy volume did not show up after members were reminded - "Volume-driven gains for new highs may trigger a new (or add-on) technical buy signal."
>>> FEATURED STOCK ARTICLE : Building a New Base Above 50-Day Moving Average Line - 8/31/2016 |
View all notes |
Set NEW NOTE alert |
Company Profile |
SEC
News |
Chart |
Request a new note
C
A
S
I |
Symbol/Exchange
Company Name
Industry Group |
PRICE |
CHANGE
(%Change) |
Day High |
Volume
(% DAV)
(% 50 day avg vol) |
52 Wk Hi
% From Hi |
Featured
Date |
Price
Featured |
Pivot Featured |
|
Max Buy |
LGIH
-
NASDAQ
L G I Homes Inc
Bldg-Resident/Comml
|
$35.39
|
-0.56
-1.56% |
$36.39
|
305,819
54.51% of 50 DAV
50 DAV is 561,000
|
$40.47
-12.55%
|
8/29/2016
|
$37.08
|
PP = $36.44
|
|
MB = $38.26
|
Most Recent Note - 9/16/2016 5:13:23 PM
Y - Ended near the session low with a loss on twice average volume undercutting prior highs in the $36 area. Testing near its 50 DMA line ($35.24), and more damaging losses leading to a violation would raise greater concerns and trigger a worrisome technical sell signal.
>>> FEATURED STOCK ARTICLE : Finished Strong While Rallying From Cup-With-Handle Base - 8/29/2016 |
View all notes |
Set NEW NOTE alert |
Company Profile |
SEC
News |
Chart |
Request a new note
C
A
S
I |
SFBS
-
NASDAQ
"ServisFirst Bancshares, Inc"
BANKING - Regional - Southeast Banks
|
$50.92
|
+0.10
0.20% |
$51.31
|
18,721
30.59% of 50 DAV
50 DAV is 61,200
|
$53.58
-4.96%
|
7/19/2016
|
$53.28
|
PP = $52.82
|
|
MB = $55.46
|
Most Recent Note - 9/15/2016 12:47:06 PM
G - Color code is changed to green while sputtering near its 50 DMA line ($51.18). Members were previously reminded - "A volume-driven gain and strong close above the pivot point are needed to clinch a convincing technical buy signal. It has been quietly consolidating since highlighted in yellow in the 7/19/16 mid-day report with pivot point cited based on the 6/01/16 high plus 10 cents."
>>> FEATURED STOCK ARTICLE : Still Consolidating Within Close Striking Distance of New Highs - 8/25/2016 |
View all notes |
Set NEW NOTE alert |
Company Profile |
SEC
News |
Chart |
Request a new note
C
A
S
I |
INGN
-
NASDAQ
Inogen Inc
HEALTH SERVICES - Medical Instruments and Supplies
|
$59.73
|
-0.01
-0.02% |
$60.27
|
109,688
56.83% of 50 DAV
50 DAV is 193,000
|
$60.95
-2.00%
|
8/5/2016
|
$51.72
|
PP = $56.08
|
|
MB = $58.88
|
Most Recent Note - 9/15/2016 12:39:23 PM
G - Consolidating above its "max buy" level, still perched near its 52-week high. Its 50 DMA line ($55.14) defines important near-term support coinciding with its Sep '15 highs. See the latest FSU analysis for additional details and an annotated graph.
>>> FEATURED STOCK ARTICLE : Stubbornly Holding Ground Near All-Time High - 9/12/2016 |
View all notes |
Set NEW NOTE alert |
Company Profile |
SEC
News |
Chart |
Request a new note
C
A
S
I |
|
|
|
THESE ARE NOT BUY RECOMMENDATIONS!
Comments contained in the body of this report are technical
opinions only. The material herein has been obtained
from sources believed to be reliable and accurate, however,
its accuracy and completeness cannot be guaranteed.
This site is not an investment advisor, hence it does
not endorse or recommend any securities or other investments.
Any recommendation contained in this report may not
be suitable for all investors and it is not to be deemed
an offer or solicitation on our part with respect to
the purchase or sale of any securities. All trademarks,
service marks and trade names appearing in this report
are the property of their respective owners, and are
likewise used for identification purposes only.
This report is a service available
only to active Paid Premium Members.
You may opt-out of receiving report notifications
at any time. Questions or comments may be submitted
by writing to Premium Membership Services 665 S.E. 10 Street, Suite 201 Deerfield Beach, FL 33441-5634 or by calling 1-800-965-8307
or 954-785-1121.
|
|
|