You are not logged in.
This means you
CAN ONLY VIEW reports that were published prior to Saturday, April 5, 2025.
You
MUST UPGRADE YOUR MEMBERSHIP if you want to see any current reports.
AFTER MARKET UPDATE - FRIDAY, SEPTEMBER 30TH, 2016
Previous After Market Report Next After Market Report >>>
|
|
|
|
DOW |
+164.70 |
18,308.15 |
+0.91% |
|
Volume |
1,155,079,180 |
+19% |
|
Volume |
1,874,856,670 |
+5% |
|
NASDAQ |
+42.85 |
5,312.00 |
+0.81% |
|
Advancers |
2,113 |
71% |
|
Advancers |
2,096 |
73% |
|
S&P 500 |
+17.14 |
2,168.27 |
+0.80% |
|
Decliners |
871 |
29% |
|
Decliners |
775 |
27% |
|
Russell 2000 |
+13.90 |
1,251.65 |
+1.12% |
|
52 Wk Highs |
119 |
|
|
52 Wk Highs |
110 |
|
|
S&P 600 |
+7.92 |
756.90 |
+1.06% |
|
52 Wk Lows |
22 |
|
|
52 Wk Lows |
37 |
|
|
 |
Major Indices Rose and Added to 3rd Quarter's Gains
Kenneth J. Gruneisen - Passed the CAN SLIM® Master's Exam
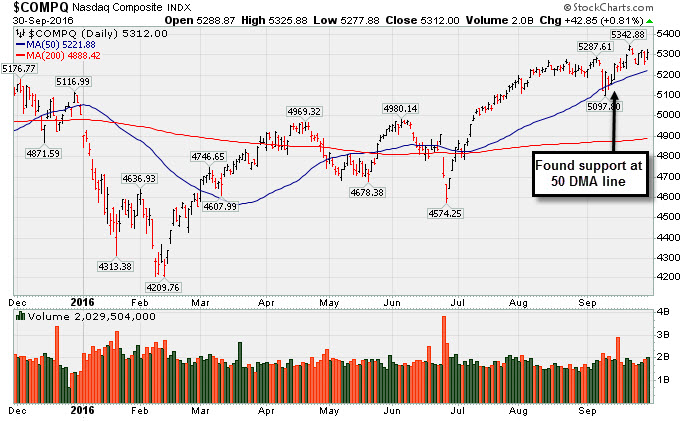
For the third-quarter, the Dow was up 2.1%, the S&P 500 gained 3.3% and the Nasdaq Composite advanced 9.7%. On Friday the Dow rose 165 points to 18308. The S&P 500 gained 17 points to 2168 and the Nasdaq Composite advanced 43 points to 5312. The volume totals were higher than the prior session on the NYSE and on the Nasdaq exchange. Breadth was positive as advancers led decliners by more than 2-1 on the NYSE and by nearly 3-1 on the Nasdaq exchange. There were 30 high-ranked companies from the Leaders List that made new 52-week highs and were listed on the BreakOuts Page, versus 35 on the prior session. New 52-week highs totals outnumbered new 52-week lows on both the NYSE and the Nasdaq exchange. PICTURED: The Nasdaq Composite Index found support at its 50-day moving average (DMA) line when recently consolidating near record highs.
The recent move into new high territory for the Nasdaq Composite Index was noted as a sign of technical strength in the market (M criteria) reassuring investors. The S&P 500 Index is near its 50-day moving average (DMA) line, meanwhile the Dow Jones Industrial Average has still been sputtering below its 50 DMA line. The Featured Stocks Page lists noteworthy high-ranked leaders.
The major averages finished firmly in positive territory led by Financials on easing contagion fears surrounding European lenders. Deutsche Bank (DB +14.02%) rebounded on reports it was close to reaching a lower-than-expected settlement with U.S. regulators. Bank of America (BAC +3.23%) and Citigroup (C +3.12%) also rose following the news.
On the economic front, personal income rose 0.2 % in August while spending was flat. A separate report showed Midwest manufacturing activity expanded faster than forecasted this month. The University of Michigan’s sentiment reading for September was revised up to 91.1 from 89.8. In earnings news, Costco (COST +3.40%) rose after posting positive quarterly results.
Along with Financials, Energy and Health Care outperformed on the session. Chevron (CVX +1.63%) and Pfizer (PFE +1.65%) rose. Utilities were the worst performing sector. Shares of Southern Company (SO -1.44%) contributed the most to the group’s decline.
Treasuries retreated with the 10-year note down 10/32 to yield 1.60%. In commodities, NYMEX WTI crude added 0.4% to $48.00/barrel. COMEX gold fell 0.6% to $1313.30/ounce. |
 Kenneth J. Gruneisen started out as a licensed stockbroker in August 1987, a couple of months prior to the historic stock market crash that took the Dow Jones Industrial Average down -22.6% in a single day. He has published daily fact-based fundamental and technical analysis on high-ranked stocks online for two decades. Through FACTBASEDINVESTING.COM, Kenneth provides educational articles, news, market commentary, and other information regarding proven investment systems that work in good times and bad.
Comments contained in the body of this report are technical opinions only and are not necessarily those of Gruneisen Growth Corp. The material herein has been obtained from sources believed to be reliable and accurate, however, its accuracy and completeness cannot be guaranteed. Our firm, employees, and customers may effect transactions, including transactions contrary to any recommendation herein, or have positions in the securities mentioned herein or options with respect thereto. Any recommendation contained in this report may not be suitable for all investors and it is not to be deemed an offer or solicitation on our part with respect to the purchase or sale of any securities. |
|
 |
Financial, Retail, Technology and Energy Groups Gained
Kenneth J. Gruneisen - Passed the CAN SLIM® Master's Exam
The Broker/Dealer Index ($XBD +2.17%) and the Bank Index ($BKX +1.63%) both posted solid gains and were a positive influence on the major averages. The Retail Index ($RLX +0.91%), Semiconductor Index ($SOX +1.58%), Biotechnology Index ($BTK +1.15%), and Networking Index ($NWX +0.64%) finished higher. The Oil Services Index ($OSX +1.64%) and Integrated Oil Index ($XOI +1.26%) rose while the Gold & Silver Index ($XAU -1.06%) was lower. Charts courtesy www.stockcharts.com
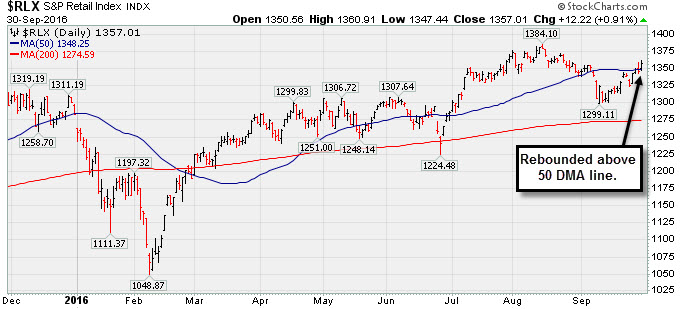
PICTURED: The Retail Index ($RLX +0.91%) rebounded above its 50-day moving average (DMA) line with Friday's gain.
| Oil Services |
$OSX |
163.61 |
+2.64 |
+1.64% |
+3.73% |
| Integrated Oil |
$XOI |
1,152.50 |
+14.36 |
+1.26% |
+7.44% |
| Semiconductor |
$SOX |
835.60 |
+12.96 |
+1.58% |
+25.94% |
| Networking |
$NWX |
404.29 |
+2.55 |
+0.64% |
+7.54% |
| Broker/Dealer |
$XBD |
173.70 |
+3.69 |
+2.17% |
-2.46% |
| Retail |
$RLX |
1,357.01 |
+12.22 |
+0.91% |
+5.73% |
| Gold & Silver |
$XAU |
94.00 |
-1.01 |
-1.06% |
+107.51% |
| Bank |
$BKX |
70.85 |
+1.14 |
+1.64% |
-3.05% |
| Biotech |
$BTK |
3,371.01 |
+38.36 |
+1.15% |
-11.61% |
|
|
|
 |
Seriously Applying the Fact-Based System Now
Kenneth J. Gruneisen - Passed the CAN SLIM® Master's Exam
Asset Management Services Using the Fact-Based Investment System You can have professional help in limiting your losses and maximizing your gains in all market environments. For help with how your portfolio is managed click here and indicate "Find a Broker". Account minimum $250,000. |
|
|
Color Codes Explained :
Y - Better candidates highlighted by our
staff of experts.
G - Previously featured
in past reports as yellow but may no longer be buyable under the
guidelines.
***Last / Change / Volume data in this table is the closing quote data***
Symbol/Exchange
Company Name
Industry Group |
PRICE |
CHANGE
(%Change) |
Day High |
Volume
(% DAV)
(% 50 day avg vol) |
52 Wk Hi
% From Hi |
Featured
Date |
Price
Featured |
Pivot Featured |
|
Max Buy |
TDG
-
NYSE
Transdigm Group Inc
AEROSPACE/DEFENSE - Aerospace/Defense Products and; Services
|
$289.12
|
+2.03
0.71% |
$290.27
|
262,910
81.40% of 50 DAV
50 DAV is 323,000
|
$294.38
-1.79%
|
5/11/2016
|
$248.33
|
PP = $245.00
|
|
MB = $257.25
|
 Most Recent Note - 9/30/2016 5:32:11 PM
G - Quietly consolidating above its 50 DMA line ($284), extended from any sound base. Subsequent losses undercutting the 50 DMA line or recent low ($278.52) would raise greater concerns
>>> FEATURED STOCK ARTICLE : Light Volume Behind Gains Wedging for New Highs - 9/7/2016 |
View all notes |
Set NEW NOTE alert |
Company Profile |
SEC
News |
Chart |
Request a new note
C
A
S
I |
IESC
-
NASDAQ
I E S Holdings Inc
Bldg-Maintenance and Svc
|
$17.79
|
+0.69
4.04% |
$17.98
|
121,758
146.70% of 50 DAV
50 DAV is 83,000
|
$18.16
-2.04%
|
7/26/2016
|
$15.79
|
PP = $15.74
|
|
MB = $16.53
|
Most Recent Note - 9/30/2016 5:23:45 PM
G - Matched its best-ever close with a big volume-driven gain today. Recently found support at its 50 DMA line ($15.76).
>>> FEATURED STOCK ARTICLE : Wedging Higher With Recent Gains Lacking Great Volume - 9/27/2016 |
View all notes |
Set NEW NOTE alert |
Company Profile |
SEC
News |
Chart |
Request a new note
C
A
S
I |
NTES
-
NASDAQ
Netease Inc Adr
INTERNET - Internet Information Providers
|
$240.78
|
-1.28
-0.53% |
$243.98
|
765,752
67.11% of 50 DAV
50 DAV is 1,141,000
|
$254.48
-5.38%
|
6/29/2016
|
$182.42
|
PP = $186.55
|
|
MB = $195.88
|
Most Recent Note - 9/30/2016 5:28:26 PM
G - Hovering near its all-time high, very extended from any sound base. Its 50 DMA line ($218) defines near-term support to watch.
>>> FEATURED STOCK ARTICLE : Extended From Prior Base After +37% Rally Since Featured 6/29/16 - 9/21/2016 |
View all notes |
Set NEW NOTE alert |
Company Profile |
SEC
News |
Chart |
Request a new note
C
A
S
I |
HTHT
-
NASDAQ
China Lodging Group Ads
LEISURE - Lodging
|
$45.09
|
-1.13
-2.44% |
$46.34
|
206,791
106.59% of 50 DAV
50 DAV is 194,000
|
$47.72
-5.51%
|
9/29/2016
|
$46.12
|
PP = $47.82
|
|
MB = $50.21
|
Most Recent Note - 9/29/2016 12:37:07 PM
Y - Color code is changed to yellow with a new pivot point cited based on its 8/29/16 high plus 10 cents. Subsequent volume-driven gains for new highs may trigger a new (or add-on) technical buy signal. Volume totals cooled while stubbornly holding its ground near all-time highs in recent weeks. Recent lows and its 50 DMA line ($42.65) define near term support to watch on pullbacks.
>>> FEATURED STOCK ARTICLE : Possibly Forming New Base While Holding Ground Near Highs - 9/20/2016 |
View all notes |
Set NEW NOTE alert |
Company Profile |
SEC
News |
Chart |
Request a new note
C
A
S
I |
PATK
-
NASDAQ
Patrick Industries Inc
WHOLESALE - Building Materials Wholesale
|
$61.92
|
-1.38
-2.18% |
$63.41
|
207,149
96.35% of 50 DAV
50 DAV is 215,000
|
$69.53
-10.94%
|
9/28/2016
|
$64.85
|
PP = $66.87
|
|
MB = $70.21
|
Most Recent Note - 9/30/2016 5:30:07 PM
G - Slumped below its 50 DMA line with today's loss on average volume and its color code is changed to green. Only a prompt rebound above the 50 DMA line would help its outlook improve. A new pivot point was cited based on its 9/06/16 high, however volume-driven gains are still needed to trigger a new (or add-on) technical buy signal. See the latest FSU analysis for more details and an annotated graph.
>>> FEATURED STOCK ARTICLE : Found Support While Building on a New "Double Bottom" Base Pattern - 9/28/2016 |
View all notes |
Set NEW NOTE alert |
Company Profile |
SEC
News |
Chart |
Request a new note
C
A
S
I |
Symbol/Exchange
Company Name
Industry Group |
PRICE |
CHANGE
(%Change) |
Day High |
Volume
(% DAV)
(% 50 day avg vol) |
52 Wk Hi
% From Hi |
Featured
Date |
Price
Featured |
Pivot Featured |
|
Max Buy |
LGIH
-
NASDAQ
L G I Homes Inc
Bldg-Resident/Comml
|
$36.84
|
-0.04
-0.11% |
$37.20
|
264,948
48.35% of 50 DAV
50 DAV is 548,000
|
$40.47
-8.97%
|
8/29/2016
|
$37.08
|
PP = $36.44
|
|
MB = $38.26
|
Most Recent Note - 9/29/2016 5:39:56 PM
Y - Still quietly consolidating above its 50 DMA line ($35.73). Violations of the 50 DMA line and recent lows ($34.18 on 9/09/16) would raise greater concerns and trigger worrisome technical sell signals. See the latest FSU analysis for more details and a new annotated graph.
>>> FEATURED STOCK ARTICLE : 50-Day Moving Average Line Recently Acted as Support - 9/29/2016 |
View all notes |
Set NEW NOTE alert |
Company Profile |
SEC
News |
Chart |
Request a new note
C
A
S
I |
SFBS
-
NASDAQ
"ServisFirst Bancshares, Inc"
BANKING - Regional - Southeast Banks
|
$51.91
|
+1.14
2.25% |
$52.16
|
56,155
111.86% of 50 DAV
50 DAV is 50,200
|
$53.58
-3.12%
|
7/19/2016
|
$53.28
|
PP = $52.82
|
|
MB = $55.46
|
Most Recent Note - 9/30/2016 5:26:20 PM
G - Finished the week above its 50 DMA line with a volume-driven gain. Subsequent volume-driven gains for new highs would be a very reassuring sign of institutional buying demand. Relative Strength Rating is currently 74, below the 80+ minimum guideline for buy candidates.
>>> FEATURED STOCK ARTICLE : Relative Strength Rating is Under Guidelines While Perched Near Highs - 9/22/2016 |
View all notes |
Set NEW NOTE alert |
Company Profile |
SEC
News |
Chart |
Request a new note
C
A
S
I |
INGN
-
NASDAQ
Inogen Inc
HEALTH SERVICES - Medical Instruments and Supplies
|
$59.90
|
+0.90
1.53% |
$60.10
|
239,522
130.18% of 50 DAV
50 DAV is 184,000
|
$61.87
-3.18%
|
8/5/2016
|
$51.72
|
PP = $56.08
|
|
MB = $58.88
|
Most Recent Note - 9/27/2016 5:43:56 PM
G - Quietly holding its ground, extended from any sound base. Its 50 DMA line ($56.51) defines important near-term support coinciding with its Sep '15 highs.
>>> FEATURED STOCK ARTICLE : Stubbornly Holding Ground Near All-Time High - 9/12/2016 |
View all notes |
Set NEW NOTE alert |
Company Profile |
SEC
News |
Chart |
Request a new note
C
A
S
I |
|
|
|
THESE ARE NOT BUY RECOMMENDATIONS!
Comments contained in the body of this report are technical
opinions only. The material herein has been obtained
from sources believed to be reliable and accurate, however,
its accuracy and completeness cannot be guaranteed.
This site is not an investment advisor, hence it does
not endorse or recommend any securities or other investments.
Any recommendation contained in this report may not
be suitable for all investors and it is not to be deemed
an offer or solicitation on our part with respect to
the purchase or sale of any securities. All trademarks,
service marks and trade names appearing in this report
are the property of their respective owners, and are
likewise used for identification purposes only.
This report is a service available
only to active Paid Premium Members.
You may opt-out of receiving report notifications
at any time. Questions or comments may be submitted
by writing to Premium Membership Services 665 S.E. 10 Street, Suite 201 Deerfield Beach, FL 33441-5634 or by calling 1-800-965-8307
or 954-785-1121.
|
|
|