You are not logged in.
This means you
CAN ONLY VIEW reports that were published prior to Tuesday, March 25, 2025.
You
MUST UPGRADE YOUR MEMBERSHIP if you want to see any current reports.
AFTER MARKET UPDATE - WEDNESDAY, SEPTEMBER 7TH, 2016
Previous After Market Report Next After Market Report >>>
|
|
|
|
DOW |
-11.98 |
18,526.14 |
-0.06% |
|
Volume |
802,988,040 |
-4% |
|
Volume |
1,719,326,150 |
+6% |
|
NASDAQ |
+8.02 |
5,283.93 |
+0.15% |
|
Advancers |
1,861 |
63% |
|
Advancers |
1,732 |
60% |
|
S&P 500 |
-0.33 |
2,186.15 |
-0.02% |
|
Decliners |
1,103 |
37% |
|
Decliners |
1,153 |
40% |
|
Russell 2000 |
+7.64 |
1,261.01 |
+0.61% |
|
52 Wk Highs |
229 |
|
|
52 Wk Highs |
211 |
|
|
S&P 600 |
+5.04 |
765.47 |
+0.66% |
|
52 Wk Lows |
6 |
|
|
52 Wk Lows |
23 |
|
|
 |
Grocery Stores Face Pressure; Major Indices Perched Near Records
Kenneth J. Gruneisen - Passed the CAN SLIM® Master's Exam
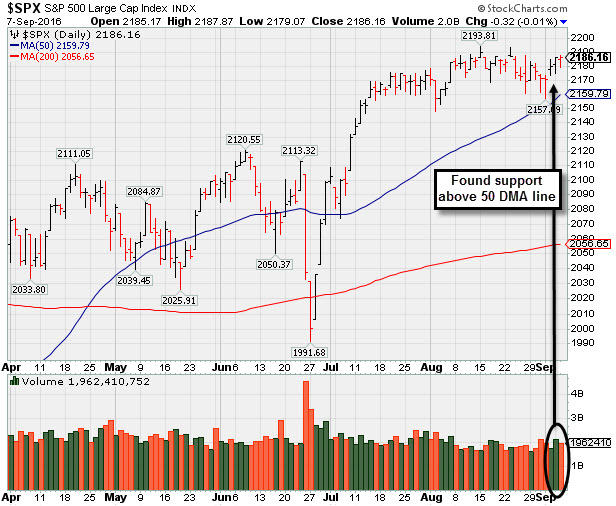
Stocks finished mixed on Wednesday. The Dow was down 11 points to 18526. The S&P 500 slipped less than a point to 2186 and the Nasdaq Composite gained 8 points to 5283. The volume totals were mixed, lighter than the prior session on the NYSE and higher on the Nasdaq exchange. Breadth was positive as advancers led decliners by more than a 3-2 margin on the NYSE and by a 3-2 margin on the Nasdaq exchange. There were 71 high-ranked companies from the Leaders List that made new 52-week highs and were listed on the BreakOuts Page, versus the total of 78 on the prior session. New 52-week highs totals contracted yet still solidly outnumbered new 52-week lows on both the NYSE and the Nasdaq exchange. PICTURED: The S&P 500 Index is consolidating near its record high and recently found support above its 50-day moving average (DMA) line.
The "confirmed uptrend" for the market (M criteria) endured some distributional pressure, however the Dow Jones Industrial Average found support above its 50-day moving average (DMA) line. A healthy crop of leading stocks remains hitting new 52-week highs. The Featured Stocks Page lists noteworthy candidates that have made headway. The major averages fluctuated in choppy trading on the session as investors digested updates on the economy. The Fed’s Beige Book release showed the economy expanded modestly in mid-July and August, but with little indication that inflation would pick up soon. In a separate report, a JOLTS update revealed job openings climbed 4% to 5.87 million in July, a new record high. In M&A news, GW Pharmaceuticals (GWPH +23.6%) rallied amid takeover speculation. Six of 11 sectors in the S&P 500 finished in positive territory. In Tech, Western Digital Corp (WDC +12.1%) rose as the hard disk drive maker raised its earnings outlook. Shares of Apple (AAPL +0.6%) inched higher after the company introduced its iPhone 7 model. In earnings, HD Supply Holdings (HDS -12.1%) as the industrial distributor’s revenue fell short of estimates. Sprouts Farmers Market (SFM -13.7%) fell after the company lowered its full-year guidance creating downward pressure on the grocery store sector. Whole Foods (WFM -5.3%) and Kroger (KR -4.1%) to lead Consumer Staples shares lower. Treasuries finished little changed with the benchmark 10-year note flat at 1.54%. In commodities, NYMEX WTI crude gained 1.4% to $45.44/barrel. COMEX gold was off 0.4% to $1345.30/ounce. |
 Kenneth J. Gruneisen started out as a licensed stockbroker in August 1987, a couple of months prior to the historic stock market crash that took the Dow Jones Industrial Average down -22.6% in a single day. He has published daily fact-based fundamental and technical analysis on high-ranked stocks online for two decades. Through FACTBASEDINVESTING.COM, Kenneth provides educational articles, news, market commentary, and other information regarding proven investment systems that work in good times and bad.
Comments contained in the body of this report are technical opinions only and are not necessarily those of Gruneisen Growth Corp. The material herein has been obtained from sources believed to be reliable and accurate, however, its accuracy and completeness cannot be guaranteed. Our firm, employees, and customers may effect transactions, including transactions contrary to any recommendation herein, or have positions in the securities mentioned herein or options with respect thereto. Any recommendation contained in this report may not be suitable for all investors and it is not to be deemed an offer or solicitation on our part with respect to the purchase or sale of any securities. |
|
 |
Financial and Biotech Indexes Led Group Gainers
Kenneth J. Gruneisen - Passed the CAN SLIM® Master's Exam
The Broker/Dealer Index ($XBD +0.83%) and Bank Index ($BKX +0.20%) both posted small gains on Wednesday. The Biotechnology Index ($BTK +1.56%) led the tech sector while the Networking Index ($NWX -0.24%) and the Semiconductor Index ($SOX -0.73%) both sputtered. The Gold & Silver Index ($XAU -0.47%) and the Oil Services Index ($OSX -0.64%) both edged lower while the Integrated Oil Index ($XOI +0.07%) finished flat. Charts courtesy www.stockcharts.com
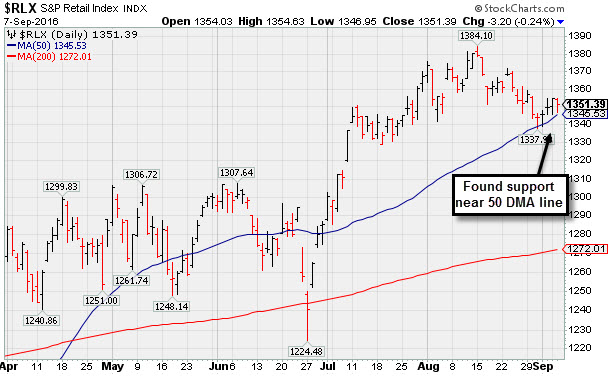
PICTURED: The Retail Index ($RLX -0.24%) edged lower, consolidating above its 50-day moving average (DMA) line following August weakness.
| Oil Services |
$OSX |
156.72 |
-1.01 |
-0.64% |
-0.64% |
| Integrated Oil |
$XOI |
1,151.44 |
+0.86 |
+0.07% |
+7.34% |
| Semiconductor |
$SOX |
799.20 |
-5.90 |
-0.73% |
+20.46% |
| Networking |
$NWX |
400.09 |
-0.98 |
-0.24% |
+6.43% |
| Broker/Dealer |
$XBD |
171.91 |
+1.42 |
+0.83% |
-3.47% |
| Retail |
$RLX |
1,351.39 |
-3.20 |
-0.24% |
+5.29% |
| Gold & Silver |
$XAU |
101.08 |
-0.47 |
-0.46% |
+123.13% |
| Bank |
$BKX |
71.92 |
+0.14 |
+0.20% |
-1.59% |
| Biotech |
$BTK |
3,396.29 |
+52.09 |
+1.56% |
-10.95% |
|
|
|
 |
Light Volume Behind Gains Wedging for New Highs
Kenneth J. Gruneisen - Passed the CAN SLIM® Master's Exam
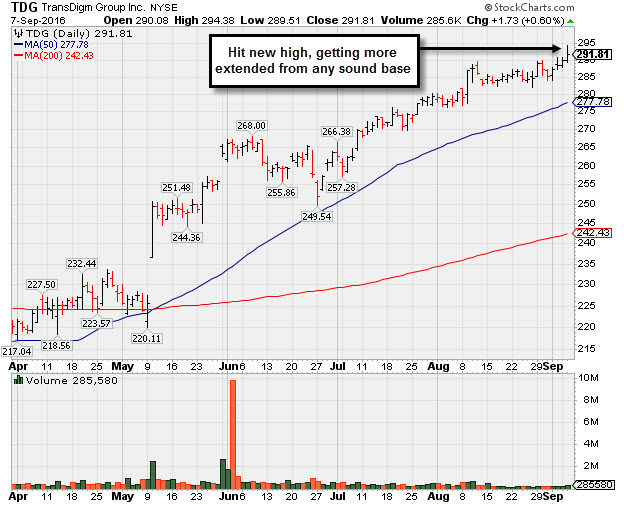
Transdigm Group Inc's (TDG +$1.73 or +0.60% to $291.81) posted a 4th consecutive light volume gain for a new all-time high. Volume recently dried up while hovering in a tight range near its high. It is extended from any sound base and well above its 50-day moving average (DMA) line ($277) and prior highs near $268 defining near-term support to watch on pullbacks.
TDG was last shown in this FSU section on 7/27/16 with an annotated graph under the headline, "Gains Lack Great Volume While Wedging to New Highs". It reported earnings +37% on +15% sales for the Jun '16 quarter, marking its 4th consecutive quarterly comparison with earnings above the +25% minimum earning guideline (C criteria). Annual earnings (A criteria) history has remained strong. The number of top-rated funds owning its share rose from 764 in Jun '15 to 1,002 in Jun '16, a reassuring trend concerning the I criteria. Its small supply of 47.9 million shares (S criteria) in the public float can contribute to greater price volatility in the event of institutional buying or selling.
The high-ranked Aerospace/Defense firm was highlighted in yellow with pivot point based on its 8/18/15 high plus 10 cents in the 5/11/16 mid-day report (read here). It had gapped up on the prior session and hit a new high (N criteria) with a considerable volume-driven gain triggering a technical buy signal. |
|
|
Color Codes Explained :
Y - Better candidates highlighted by our
staff of experts.
G - Previously featured
in past reports as yellow but may no longer be buyable under the
guidelines.
***Last / Change / Volume data in this table is the closing quote data***
Symbol/Exchange
Company Name
Industry Group |
PRICE |
CHANGE
(%Change) |
Day High |
Volume
(% DAV)
(% 50 day avg vol) |
52 Wk Hi
% From Hi |
Featured
Date |
Price
Featured |
Pivot Featured |
|
Max Buy |
TDG
-
NYSE
Transdigm Group Inc
AEROSPACE/DEFENSE - Aerospace/Defense Products and; Services
|
$291.81
|
+1.73
0.60% |
$294.38
|
285,562
80.44% of 50 DAV
50 DAV is 355,000
|
$290.85
0.33%
|
5/11/2016
|
$248.33
|
PP = $245.00
|
|
MB = $257.25
|
 Most Recent Note - 9/7/2016 6:05:15 PM
G - Wedged to new all-time highs with today's 4th consecutive gain backed by light volume. Its 50 DMA line and prior highs define important near-term support to watch on pullbacks. See the latest FSU analysis for more details and a new annotated graph.
>>> FEATURED STOCK ARTICLE : Light Volume Behind Gains Wedging for New Highs - 9/7/2016 |
View all notes |
Set NEW NOTE alert |
Company Profile |
SEC
News |
Chart |
Request a new note
C
A
S
I |
IESC
-
NASDAQ
I E S Holdings Inc
Bldg-Maintenance and Svc
|
$17.27
|
+0.42
2.49% |
$17.46
|
68,912
80.13% of 50 DAV
50 DAV is 86,000
|
$18.16
-4.90%
|
7/26/2016
|
$15.79
|
PP = $15.74
|
|
MB = $16.53
|
Most Recent Note - 9/6/2016 4:16:58 PM
G - There was a "negative reversal" for a loss on higher volume after touching a new high today. Its 50 DMA line and the recent low (13.50 on 8/02/16) define important near-term support to watch. See the latest FSU analysis for more details and an annotated graph.
>>> FEATURED STOCK ARTICLE : Strength Returned With Heavier Volume Gains for Highs - 8/30/2016 |
View all notes |
Set NEW NOTE alert |
Company Profile |
SEC
News |
Chart |
Request a new note
C
A
S
I |
NTES
-
NASDAQ
Netease Inc Adr
INTERNET - Internet Information Providers
|
$218.93
|
-3.07
-1.38% |
$222.62
|
1,140,220
98.38% of 50 DAV
50 DAV is 1,159,000
|
$224.18
-2.34%
|
6/29/2016
|
$182.42
|
PP = $186.55
|
|
MB = $195.88
|
Most Recent Note - 9/6/2016 1:01:02 PM
G - Rallying further into new all-time high territory with today's gain while volume is running at an above average pace. It is extended from any sound base. Its 50 DMA line ($201) defines near-term support above prior highs in the $186 area.
>>> FEATURED STOCK ARTICLE : Pulled Back on Higher Volume Following Earnings Report - 8/18/2016 |
View all notes |
Set NEW NOTE alert |
Company Profile |
SEC
News |
Chart |
Request a new note
C
A
S
I |
HTHT
-
NASDAQ
China Lodging Group Ads
LEISURE - Lodging
|
$45.31
|
-0.26
-0.57% |
$45.63
|
275,482
119.77% of 50 DAV
50 DAV is 230,000
|
$47.72
-5.05%
|
7/13/2016
|
$38.87
|
PP = $39.29
|
|
MB = $41.25
|
Most Recent Note - 9/6/2016 4:20:59 PM
G - Extended from any sound base after rallying well above its "max buy" level. Prior highs and its 50 DMA line define near term support to watch on pullbacks.
>>> FEATURED STOCK ARTICLE : Volume-Driven Gains for New Highs Signal Institutional Demand - 8/17/2016 |
View all notes |
Set NEW NOTE alert |
Company Profile |
SEC
News |
Chart |
Request a new note
C
A
S
I |
MXL
-
NYSE
Maxlinear Inc Cl A
Telecom-Infrastructure
|
$19.50
|
-0.31
-1.56% |
$19.81
|
924,331
65.98% of 50 DAV
50 DAV is 1,401,000
|
$22.50
-13.33%
|
5/16/2016
|
$19.24
|
PP = $19.20
|
|
MB = $20.16
|
Most Recent Note - 9/7/2016 6:10:55 PM
G - Fell back below its 50 DMA line ($19.65) today. Its 200 DMA line and prior lows in the $17 area define the next important support level where violations would raise serious concerns.
>>> FEATURED STOCK ARTICLE : Rebound to 50-Day Moving Average After Abrupt Drop to 200-Day Line - 9/1/2016 |
View all notes |
Set NEW NOTE alert |
Company Profile |
SEC
News |
Chart |
Request a new note
C
A
S
I |
Symbol/Exchange
Company Name
Industry Group |
PRICE |
CHANGE
(%Change) |
Day High |
Volume
(% DAV)
(% 50 day avg vol) |
52 Wk Hi
% From Hi |
Featured
Date |
Price
Featured |
Pivot Featured |
|
Max Buy |
PATK
-
NASDAQ
Patrick Industries Inc
WHOLESALE - Building Materials Wholesale
|
$65.59
|
-1.14
-1.71% |
$66.82
|
125,250
57.45% of 50 DAV
50 DAV is 218,000
|
$69.53
-5.67%
|
5/24/2016
|
$53.45
|
PP = $50.68
|
|
MB = $53.21
|
Most Recent Note - 9/2/2016 3:24:16 PM
G - Quietly consolidating above the 50 DMA line ($63.30) and latest low ($59.51 on 8/16/16). Subsequent violations may raise concerns and trigger technical sell signals, meanwhile it may be forming a new base. See the latest FSU analysis for additional details and an annotated graph.
>>> FEATURED STOCK ARTICLE : Building a New Base Above 50-Day Moving Average Line - 8/31/2016 |
View all notes |
Set NEW NOTE alert |
Company Profile |
SEC
News |
Chart |
Request a new note
C
A
S
I |
FBHS
-
NYSE
Fortune Brands Hme & Sec
Bldg-Constr Prds/Misc
|
$62.52
|
-0.48
-0.76% |
$63.08
|
960,388
79.31% of 50 DAV
50 DAV is 1,210,900
|
$64.47
-3.02%
|
6/22/2016
|
$57.71
|
PP = $60.08
|
|
MB = $63.08
|
Most Recent Note - 9/7/2016 6:09:31 PM
G - Quietly consolidating above its 50 DMA line ($61.98) and prior lows ($61.91 on 8/17/16) defining important near-term support. Subsequent violations may raise concerns and trigger technical sell signals, meanwhile it may be building a new base.
>>> FEATURED STOCK ARTICLE : Perched Above "Max Buy" Level Following Volume-Driven Gain - 8/1/2016 |
View all notes |
Set NEW NOTE alert |
Company Profile |
SEC
News |
Chart |
Request a new note
C
A
S
I |
LGIH
-
NASDAQ
L G I Homes Inc
Bldg-Resident/Comml
|
$39.46
|
+0.91
2.36% |
$40.47
|
600,747
113.78% of 50 DAV
50 DAV is 528,000
|
$39.23
0.59%
|
8/29/2016
|
$37.08
|
PP = $36.44
|
|
MB = $38.26
|
Most Recent Note - 9/2/2016 3:27:08 PM
Y - Stubbornly holding its ground near its "max buy" level following considerable volume-driven gains for new highs. Highlighted in yellow in the 8/29/16 mid-day report with pivot point cited based on its 7/26/16 high, clearing a long cup-with-handle base and triggering a technical buy signal. Fundamentals remain strong. Group Relative Strength Rating of 62 reveals mediocre leadership (L criteria) in the industry group. Reported +45% earnings on +40% sales revenues for the second quarter ended June 30, 2016 versus the year ago period. See the latest FSU analysis for more details and an annotated graph.
>>> FEATURED STOCK ARTICLE : Finished Strong While Rallying From Cup-With-Handle Base - 8/29/2016 |
View all notes |
Set NEW NOTE alert |
Company Profile |
SEC
News |
Chart |
Request a new note
C
A
S
I |
NVEE
-
NASDAQ
N V 5 Global Inc
Comml Svcs-Consulting
|
$31.27
|
-0.06
-0.19% |
$31.67
|
34,435
43.04% of 50 DAV
50 DAV is 80,000
|
$37.00
-15.49%
|
4/19/2016
|
$28.20
|
PP = $28.10
|
|
MB = $29.51
|
Most Recent Note - 9/7/2016 6:12:13 PM
G - Quietly consolidating near its 50 DMA line ($31.60). Prior highs in the $30 area define important near-term support. More damaging losses may trigger worrisome technical sell signals.
>>> FEATURED STOCK ARTICLE : Technically Strong Despite Fundamental Concerns - 8/22/2016 |
View all notes |
Set NEW NOTE alert |
Company Profile |
SEC
News |
Chart |
Request a new note
C
A
S
I |
SFBS
-
NASDAQ
"ServisFirst Bancshares, Inc"
BANKING - Regional - Southeast Banks
|
$52.75
|
+0.67
1.29% |
$52.85
|
35,011
47.96% of 50 DAV
50 DAV is 73,000
|
$53.58
-1.55%
|
7/19/2016
|
$53.28
|
PP = $52.82
|
|
MB = $55.46
|
Most Recent Note - 9/6/2016 4:18:47 PM
Y - Today's quiet loss broke a streak of 8 small gains challenging its 52-week high. Members were previously reminded - "A volume-driven gain and strong close above the pivot point are needed to clinch a convincing technical buy signal. It has been quietly consolidating since highlighted in yellow in the 7/19/16 mid-day report with pivot point cited based on the 6/01/16 high plus 10 cents."
>>> FEATURED STOCK ARTICLE : Still Consolidating Within Close Striking Distance of New Highs - 8/25/2016 |
View all notes |
Set NEW NOTE alert |
Company Profile |
SEC
News |
Chart |
Request a new note
C
A
S
I |
Symbol/Exchange
Company Name
Industry Group |
PRICE |
CHANGE
(%Change) |
Day High |
Volume
(% DAV)
(% 50 day avg vol) |
52 Wk Hi
% From Hi |
Featured
Date |
Price
Featured |
Pivot Featured |
|
Max Buy |
INGN
-
NASDAQ
Inogen Inc
HEALTH SERVICES - Medical Instruments and Supplies
|
$59.61
|
+0.86
1.46% |
$59.90
|
198,901
96.55% of 50 DAV
50 DAV is 206,000
|
$59.00
1.03%
|
8/5/2016
|
$51.72
|
PP = $56.08
|
|
MB = $58.88
|
Most Recent Note - 9/6/2016 4:23:50 PM
Y - Posted a gain with light volume today for a best-ever close. Remains at its 52-week high, stubbornly holding ts ground. Stalled after its 8/09/16 volume-driven gain triggered a technical buy signal.
>>> FEATURED STOCK ARTICLE : Perched Within Striking Distance of Highs Following Rebound - 8/5/2016 |
View all notes |
Set NEW NOTE alert |
Company Profile |
SEC
News |
Chart |
Request a new note
C
A
S
I |
OLLI
-
NASDAQ
Ollie's Bargain Outlet
Retail-DiscountandVariety
|
$26.34
|
-0.87
-3.20% |
$26.90
|
6,843,268
1,049.58% of 50 DAV
50 DAV is 652,000
|
$28.72
-8.29%
|
7/19/2016
|
$26.42
|
PP = $28.82
|
|
MB = $30.26
|
Most Recent Note - 9/7/2016 12:55:27 PM
Y - Slumping near its 50 DMA line with a considerable volume-driven loss today on news of a Secondary Offering. Reported earnings +50% on +16% sales revenues for the Jul '16 quarter. Members were repeatedly reminded in prior notes - "Volume-driven gains above the pivot point are still needed to trigger a convincing technical buy signal."
>>> FEATURED STOCK ARTICLE : Near High Awaiting Volume-Driven Gain to Trigger Technical Buy Signal - 8/24/2016 |
View all notes |
Set NEW NOTE alert |
Company Profile |
SEC
News |
Chart |
Request a new note
C
A
S
I |
|
|
|
THESE ARE NOT BUY RECOMMENDATIONS!
Comments contained in the body of this report are technical
opinions only. The material herein has been obtained
from sources believed to be reliable and accurate, however,
its accuracy and completeness cannot be guaranteed.
This site is not an investment advisor, hence it does
not endorse or recommend any securities or other investments.
Any recommendation contained in this report may not
be suitable for all investors and it is not to be deemed
an offer or solicitation on our part with respect to
the purchase or sale of any securities. All trademarks,
service marks and trade names appearing in this report
are the property of their respective owners, and are
likewise used for identification purposes only.
This report is a service available
only to active Paid Premium Members.
You may opt-out of receiving report notifications
at any time. Questions or comments may be submitted
by writing to Premium Membership Services 665 S.E. 10 Street, Suite 201 Deerfield Beach, FL 33441-5634 or by calling 1-800-965-8307
or 954-785-1121.
|
|
|