You are not logged in.
This means you
CAN ONLY VIEW reports that were published prior to Monday, April 7, 2025.
You
MUST UPGRADE YOUR MEMBERSHIP if you want to see any current reports.
AFTER MARKET UPDATE - MONDAY, AUGUST 29TH, 2016
Previous After Market Report Next After Market Report >>>
|
|
|
|
DOW |
+107.59 |
18,502.99 |
+0.58% |
|
Volume |
642,053,770 |
-19% |
|
Volume |
1,303,350,760 |
-11% |
|
NASDAQ |
+13.41 |
5,232.33 |
+0.26% |
|
Advancers |
2,145 |
72% |
|
Advancers |
1,796 |
63% |
|
S&P 500 |
+11.34 |
2,180.38 |
+0.52% |
|
Decliners |
827 |
28% |
|
Decliners |
1,069 |
37% |
|
Russell 2000 |
+6.91 |
1,244.94 |
+0.56% |
|
52 Wk Highs |
210 |
|
|
52 Wk Highs |
175 |
|
|
S&P 600 |
+4.27 |
756.18 |
+0.57% |
|
52 Wk Lows |
11 |
|
|
52 Wk Lows |
34 |
|
|
 |
Breadth Positive But Volume Lighter as Major Indices Rose
Kenneth J. Gruneisen - Passed the CAN SLIM® Master's Exam
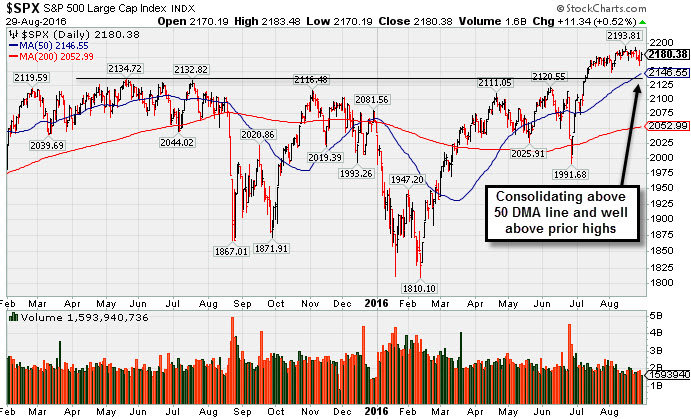
Stocks finished higher on Monday. The Dow was up 107 points to 18502. The S&P 500 added 11 points to 2180 and the Nasdaq Composite gained 13 points to 5232. Behind the gains the volume totals were lighter than the prior session on the NYSE and on the Nasdaq exchange. Advancers led decliners by 11-4 on the NYSE and by 9-5 on the Nasdaq exchange. There were 47 high-ranked companies from the Leaders List that made new 52-week highs and were listed on the BreakOuts Page, versus the total of 52 on the prior session. New 52-week highs totals solidly outnumbered new 52-week lows on both the NYSE and the Nasdaq exchange. PICTURED: The S&P 500 Index is consolidating near its record high, above the 50-day moving average (DMA) line and well above prior highs.
The "confirmed uptrend" for the market (M criteria) has recently encountered some distributional pressure. See the Featured Stocks Page which now lists a few noteworthy candidates that have made headway. The major averages advanced as investors digested optimistic data on consumer spending and hawkish comments from the Federal Reserve’s summit at Jackson Hole, Wyo, over the weekend. On the data front, personal spending increased 0.4% and income grew 0.3% in July, matching the consensus expectation. The PCE Deflator, which is the Fed’s preferred proxy for inflation, was flat in July. All 10 sectors in the S&P 500 finished in positive territory with Financials and Materials pacing the gains. Insurers led the charge in the financial space, with MetLife (MET +1.48%) and Aflac (AFL +1.31%) both up on the session. Shares of Herbalife (HLF +4.63%) rose after investor Carl Icahn disclosed he increased his stake in the nutritional supplement company. KLA-Tencor (KLAC +1.79%) and CF Industries (CF +4.17%) both were higher after each company was the subject of positive analyst commentary. Treasuries strengthened along the curve with the benchmark 10-year note up 18/32 to yield 1.57%. In commodities, NYMEX WTI crude fell 1.3% to $47.00/barrel while gold inched 0.1% higher on the COMEX to $1322.90/ounce. In FOREX, the dollar gave back early strength to finish unchanged. |
 Kenneth J. Gruneisen started out as a licensed stockbroker in August 1987, a couple of months prior to the historic stock market crash that took the Dow Jones Industrial Average down -22.6% in a single day. He has published daily fact-based fundamental and technical analysis on high-ranked stocks online for two decades. Through FACTBASEDINVESTING.COM, Kenneth provides educational articles, news, market commentary, and other information regarding proven investment systems that work in good times and bad.
Comments contained in the body of this report are technical opinions only and are not necessarily those of Gruneisen Growth Corp. The material herein has been obtained from sources believed to be reliable and accurate, however, its accuracy and completeness cannot be guaranteed. Our firm, employees, and customers may effect transactions, including transactions contrary to any recommendation herein, or have positions in the securities mentioned herein or options with respect thereto. Any recommendation contained in this report may not be suitable for all investors and it is not to be deemed an offer or solicitation on our part with respect to the purchase or sale of any securities. |
|
 |
Retail,Financial, and Commodity-Linked Groups Rose
Kenneth J. Gruneisen - Passed the CAN SLIM® Master's Exam
The Retail Index ($RLX +0.39%), Broker/Dealer Index ($XBD +0.55%), and Bank Index ($BKX +0.86%) unanimously contributed to Monday's gains for the major averages. The Gold & Silver Index ($XAU +1.19%) rose and energy-linked groups were slightly positive as the Oil Services Index ($OSX +0.15%) and the Integrated Oil Index ($XOI +0.55%) both edged higher. The Biotechnology Index ($BTK -0.30%) edged lower while the Semiconductor Index ($SOX +0.28%) and Networking Index ($NWX +0.52%) both edged higher. Charts courtesy www.stockcharts.com
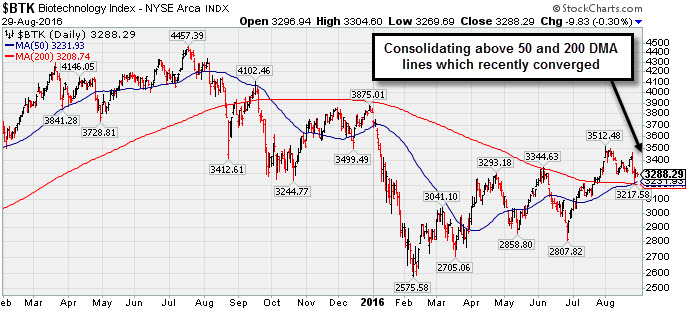
PICTURED: The Biotechnology Index ($BTK -0.30%) is consolidating above its 50-day and 200-day moving average (DMA) lines which recently converged.
| Oil Services |
$OSX |
160.85 |
+0.24 |
+0.15% |
+1.98% |
| Integrated Oil |
$XOI |
1,147.99 |
+6.23 |
+0.55% |
+7.02% |
| Semiconductor |
$SOX |
803.62 |
+2.22 |
+0.28% |
+21.12% |
| Networking |
$NWX |
395.71 |
+2.05 |
+0.52% |
+5.26% |
| Broker/Dealer |
$XBD |
169.88 |
+0.92 |
+0.55% |
-4.61% |
| Retail |
$RLX |
1,356.89 |
+5.24 |
+0.39% |
+5.72% |
| Gold & Silver |
$XAU |
96.93 |
+1.13 |
+1.18% |
+113.97% |
| Bank |
$BKX |
71.61 |
+0.61 |
+0.86% |
-2.01% |
| Biotech |
$BTK |
3,288.29 |
-9.83 |
-0.30% |
-13.78% |
|
|
|
 |
Finished Strong While Rallying From Cup-With-Handle Base
Kenneth J. Gruneisen - Passed the CAN SLIM® Master's Exam
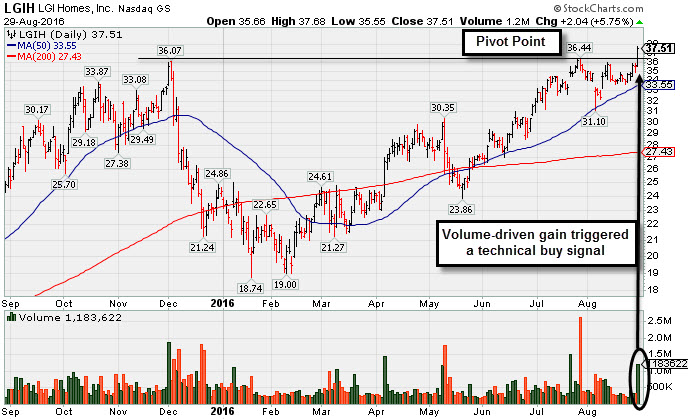
L G I Homes Inc (LGIH +$2.04 or +5.75% to $37.51) finished strong after highlighted in yellow with pivot point cited based on its 7/26/16 high in the earlier mid-day report (read here). It hit a new 52-week high today with +130% above average volume while rising from a 39-week long cup-with-handle base, triggering a technical buy signal. Recently it found support at its 50-day moving average (DMA) line. Fundamentals remain strong. However, the current Group Relative Strength Rating of 55 reveals mediocre leadership (L criteria) in the industry group. The Building - Residential / Commercial firm has a limited history since its IPO at $11 on 11/07/13. It reported +45% earnings on +40% sales revenues for the second quarter ended June 30, 2016 versus the year ago period, marking the 6th consecutive quarterly comparison above the +25% minimum earnings guideline (C criteria) and backed by solid sales revenues increases. The number of top-rated funds owning its shares rose from 126 in Dec '14 to 220 in Jun '16, a reassuring sign considering the I criteria. Its Up/Down Volume Ratio of 1.1 is an unbiased indication its shares have been under slight accumulation over the past 50 days. It has a Timeliness Rating of A and a Sponsorship Rating of D. LGIH was dropped from the Featured Stocks list on 12/09/15 and rebounded later from a very deep consolidation. It deteriorated quickly after last shown in this FSU section on 12/01/15 under the headline, "Volume Heavy Behind Breakout Gain". Stocks that get clobbered like that don't always come back. If and when they do, this example still serves as a reminder that it can take a long time and it can be very painful if losses are not limited whenever any stock falls more than -7% from your purchase price. Charts courtesy www.stockcharts.com
 |
|
|
Color Codes Explained :
Y - Better candidates highlighted by our
staff of experts.
G - Previously featured
in past reports as yellow but may no longer be buyable under the
guidelines.
***Last / Change / Volume data in this table is the closing quote data***
Symbol/Exchange
Company Name
Industry Group |
PRICE |
CHANGE
(%Change) |
Day High |
Volume
(% DAV)
(% 50 day avg vol) |
52 Wk Hi
% From Hi |
Featured
Date |
Price
Featured |
Pivot Featured |
|
Max Buy |
TDG
-
NYSE
Transdigm Group Inc
AEROSPACE/DEFENSE - Aerospace/Defense Products and; Services
|
$289.17
|
+4.45
1.56% |
$289.63
|
253,392
63.51% of 50 DAV
50 DAV is 399,000
|
$289.67
-0.17%
|
5/11/2016
|
$248.33
|
PP = $245.00
|
|
MB = $257.25
|
 Most Recent Note - 8/29/2016 4:02:29 PM
G - Volume has been drying up while hovering in a tight range, and today's light volume gain led to a best-ever close. Its 50 DMA line and prior highs near $268 define important near-term support to watch on pullbacks.
>>> FEATURED STOCK ARTICLE : Gains Lack Great Volume While Wedging to New Highs - 7/27/2016 |
View all notes |
Set NEW NOTE alert |
Company Profile |
SEC
News |
Chart |
Request a new note
C
A
S
I |
IESC
-
NASDAQ
I E S Holdings Inc
Bldg-Maintenance and Svc
|
$17.73
|
+1.57
9.72% |
$18.00
|
374,578
398.49% of 50 DAV
50 DAV is 94,000
|
$16.77
5.72%
|
7/26/2016
|
$15.79
|
PP = $15.74
|
|
MB = $16.53
|
Most Recent Note - 8/29/2016 3:57:56 PM
G - Color code is changed to green while hitting new highs above its "max buy" level with today's volume-driven gain. Under the fact-based system a stock which was previously sold can be bought back again if strength returns. IESC found support above its 50 DMA line ($14.27), and the recent low (13.50 on 8/02/16) helps define important near-term support.
>>> FEATURED STOCK ARTICLE : Volume-Driven Gain for New Highs Clinched Technical Buy Signal - 7/26/2016 |
View all notes |
Set NEW NOTE alert |
Company Profile |
SEC
News |
Chart |
Request a new note
C
A
S
I |
NTES
-
NASDAQ
Netease Inc Adr
INTERNET - Internet Information Providers
|
$213.57
|
-3.36
-1.55% |
$217.46
|
930,169
83.65% of 50 DAV
50 DAV is 1,112,000
|
$218.77
-2.38%
|
6/29/2016
|
$182.42
|
PP = $186.55
|
|
MB = $195.88
|
Most Recent Note - 8/26/2016 5:42:57 PM
G - Hit a new all-time high and finished strong with today's gain on near average volume, getting more extended from any sound base. Its 50 DMA line ($195) and prior highs near $186 define support to watch on pullbacks.
>>> FEATURED STOCK ARTICLE : Pulled Back on Higher Volume Following Earnings Report - 8/18/2016 |
View all notes |
Set NEW NOTE alert |
Company Profile |
SEC
News |
Chart |
Request a new note
C
A
S
I |
HTHT
-
NASDAQ
China Lodging Group Ads
LEISURE - Lodging
|
$46.90
|
+2.21
4.95% |
$47.72
|
598,931
265.01% of 50 DAV
50 DAV is 226,000
|
$46.57
0.71%
|
7/13/2016
|
$38.87
|
PP = $39.29
|
|
MB = $41.25
|
Most Recent Note - 8/29/2016 4:07:42 PM
G - Hit new highs and finished strong with today's gain backed by above average volume. Extended from any sound base after rallying well above its "max buy" level. Recently hitting new highs with considerable volume-driven gains indicative of fresh institutional buying demand.
>>> FEATURED STOCK ARTICLE : Volume-Driven Gains for New Highs Signal Institutional Demand - 8/17/2016 |
View all notes |
Set NEW NOTE alert |
Company Profile |
SEC
News |
Chart |
Request a new note
C
A
S
I |
MXL
-
NYSE
Maxlinear Inc Cl A
Telecom-Infrastructure
|
$19.19
|
+0.27
1.43% |
$19.24
|
1,458,193
105.13% of 50 DAV
50 DAV is 1,387,000
|
$22.50
-14.71%
|
5/16/2016
|
$19.24
|
PP = $19.20
|
|
MB = $20.16
|
Most Recent Note - 8/26/2016 5:49:32 PM
G - A rebound above the 50 DMA line ($19.55) is needed for its outlook to improve. Its 200 DMA line and prior lows in the $17 area define the next important support level where violations would raise serious concerns.
>>> FEATURED STOCK ARTICLE : Consolidating Near Highs Above its "Max Buy" Level - 7/29/2016 |
View all notes |
Set NEW NOTE alert |
Company Profile |
SEC
News |
Chart |
Request a new note
C
A
S
I |
Symbol/Exchange
Company Name
Industry Group |
PRICE |
CHANGE
(%Change) |
Day High |
Volume
(% DAV)
(% 50 day avg vol) |
52 Wk Hi
% From Hi |
Featured
Date |
Price
Featured |
Pivot Featured |
|
Max Buy |
PATK
-
NASDAQ
Patrick Industries Inc
WHOLESALE - Building Materials Wholesale
|
$64.45
|
+1.20
1.90% |
$64.64
|
195,323
89.19% of 50 DAV
50 DAV is 219,000
|
$69.53
-7.31%
|
5/24/2016
|
$53.45
|
PP = $50.68
|
|
MB = $53.21
|
Most Recent Note - 8/29/2016 5:56:59 PM
G - Posted a gain with higher (near average) volume while consolidating above the 50 DMA line ($62.64) and latest low ($59.51 on 8/16/16). Subsequent violations would raise concerns and trigger technical sell signals.
>>> FEATURED STOCK ARTICLE : Rallied +30% in 2 Months Since Breakout Was Featured - 7/28/2016 |
View all notes |
Set NEW NOTE alert |
Company Profile |
SEC
News |
Chart |
Request a new note
C
A
S
I |
FBHS
-
NYSE
Fortune Brands Hme & Sec
Bldg-Constr Prds/Misc
|
$63.83
|
+0.43
0.68% |
$64.06
|
489,496
24.65% of 50 DAV
50 DAV is 1,986,000
|
$64.47
-0.99%
|
6/22/2016
|
$57.71
|
PP = $60.08
|
|
MB = $63.08
|
Most Recent Note - 8/26/2016 5:45:46 PM
G - Volume totals have been cooling while stubbornly holding its ground in a tight range near its 52-week high. Prior highs and its 50 DMA line define near-term support in the $60-61 area.
>>> FEATURED STOCK ARTICLE : Perched Above "Max Buy" Level Following Volume-Driven Gain - 8/1/2016 |
View all notes |
Set NEW NOTE alert |
Company Profile |
SEC
News |
Chart |
Request a new note
C
A
S
I |
LGIH
-
NASDAQ
L G I Homes Inc
Bldg-Resident/Comml
|
$37.51
|
+2.04
5.75% |
$37.68
|
1,181,352
230.73% of 50 DAV
50 DAV is 512,000
|
$36.44
2.94%
|
8/29/2016
|
$37.08
|
PP = $36.44
|
|
MB = $38.26
|
Most Recent Note - 8/29/2016 5:51:19 PM
Y - Finished strong after highlighted in yellow with pivot point cited based on its 7/26/16 high. Hit a new 52-week high with +130% above average volume while rising from a 39-week long cup-with-handle base triggering a technical buy signal. Fundamentals remain strong. Group Relative Strength Rating of 55 reveals mediocre leadership (L criteria) in the industry group. It was dropped from the Featured Stocks list on 12/09/15 and rebounded from a deep consolidation. Reported +45% earnings on +40% sales revenues for the second quarter ended June 30, 2016 versus the year ago period. See the latest FSU analysis for more details and a new annotated graph.
>>> FEATURED STOCK ARTICLE : Volume Heavy Behind Breakout Gain - 12/1/2015 |
View all notes |
Set NEW NOTE alert |
Company Profile |
SEC
News |
Chart |
Request a new note
C
A
S
I |
NVEE
-
NASDAQ
N V 5 Global Inc
Comml Svcs-Consulting
|
$31.45
|
-0.35
-1.10% |
$31.99
|
54,525
61.96% of 50 DAV
50 DAV is 88,000
|
$37.00
-15.00%
|
4/19/2016
|
$28.20
|
PP = $28.10
|
|
MB = $29.51
|
Most Recent Note - 8/29/2016 4:09:29 PM
G - Sputtering near its 50 DMA line ($31.12) and prior highs in the $30 defining important near-term support. More damaging losses would raise concerns and trigger technical sell signals.
>>> FEATURED STOCK ARTICLE : Technically Strong Despite Fundamental Concerns - 8/22/2016 |
View all notes |
Set NEW NOTE alert |
Company Profile |
SEC
News |
Chart |
Request a new note
C
A
S
I |
SFBS
-
NASDAQ
Servisfirst Bancshares
BANKING - Regional - Southeast Banks
|
$52.29
|
+0.08
0.15% |
$52.96
|
35,150
37.80% of 50 DAV
50 DAV is 93,000
|
$53.58
-2.41%
|
7/19/2016
|
$53.28
|
PP = $52.82
|
|
MB = $55.46
|
Most Recent Note - 8/25/2016 5:04:41 PM
Y - Quietly consolidating within close striking distance of its 52-week high. Members were previously reminded - "A volume-driven gain and strong close above the pivot point are needed to clinch a convincing technical buy signal. It has been quietly consolidating since highlighted in yellow in the 7/19/16 mid-day report with pivot point cited based on the 6/01/16 high plus 10 cents." See the latest FSU analysis for more details and a new annotated graph.
>>> FEATURED STOCK ARTICLE : Still Consolidating Within Close Striking Distance of New Highs - 8/25/2016 |
View all notes |
Set NEW NOTE alert |
Company Profile |
SEC
News |
Chart |
Request a new note
C
A
S
I |
Symbol/Exchange
Company Name
Industry Group |
PRICE |
CHANGE
(%Change) |
Day High |
Volume
(% DAV)
(% 50 day avg vol) |
52 Wk Hi
% From Hi |
Featured
Date |
Price
Featured |
Pivot Featured |
|
Max Buy |
INGN
-
NASDAQ
Inogen Inc
HEALTH SERVICES - Medical Instruments and Supplies
|
$58.35
|
+0.84
1.46% |
$58.98
|
162,408
73.16% of 50 DAV
50 DAV is 222,000
|
$58.78
-0.73%
|
8/5/2016
|
$51.72
|
PP = $56.08
|
|
MB = $58.88
|
Most Recent Note - 8/29/2016 4:04:33 PM
Y - Posted a gain with light volume today and matched its best-ever close after touching a new 52-week high. Stalled after its 8/09/16 volume-driven gain triggered a technical buy signal.
>>> FEATURED STOCK ARTICLE : Perched Within Striking Distance of Highs Following Rebound - 8/5/2016 |
View all notes |
Set NEW NOTE alert |
Company Profile |
SEC
News |
Chart |
Request a new note
C
A
S
I |
OLLI
-
NASDAQ
Ollie's Bargain Outlet
Retail-DiscountandVariety
|
$26.08
|
-0.34
-1.29% |
$26.90
|
499,426
79.65% of 50 DAV
50 DAV is 627,000
|
$28.72
-9.19%
|
7/19/2016
|
$26.42
|
PP = $28.82
|
|
MB = $30.26
|
Most Recent Note - 8/29/2016 5:55:41 PM
Y - Slumped near its 50 DMA line ($25.78) with today's 4th consecutive loss. Members were repeatedly reminded in prior notes - "Volume-driven gains above the pivot point are still needed to trigger a convincing technical buy signal." See the latest FSU analysis for additional details and an annotated graph.
>>> FEATURED STOCK ARTICLE : Near High Awaiting Volume-Driven Gain to Trigger Technical Buy Signal - 8/24/2016 |
View all notes |
Set NEW NOTE alert |
Company Profile |
SEC
News |
Chart |
Request a new note
C
A
S
I |
|
|
|
THESE ARE NOT BUY RECOMMENDATIONS!
Comments contained in the body of this report are technical
opinions only. The material herein has been obtained
from sources believed to be reliable and accurate, however,
its accuracy and completeness cannot be guaranteed.
This site is not an investment advisor, hence it does
not endorse or recommend any securities or other investments.
Any recommendation contained in this report may not
be suitable for all investors and it is not to be deemed
an offer or solicitation on our part with respect to
the purchase or sale of any securities. All trademarks,
service marks and trade names appearing in this report
are the property of their respective owners, and are
likewise used for identification purposes only.
This report is a service available
only to active Paid Premium Members.
You may opt-out of receiving report notifications
at any time. Questions or comments may be submitted
by writing to Premium Membership Services 665 S.E. 10 Street, Suite 201 Deerfield Beach, FL 33441-5634 or by calling 1-800-965-8307
or 954-785-1121.
|
|
|