You are not logged in.
This means you
CAN ONLY VIEW reports that were published prior to Monday, April 7, 2025.
You
MUST UPGRADE YOUR MEMBERSHIP if you want to see any current reports.
AFTER MARKET UPDATE - WEDNESDAY, AUGUST 31ST, 2016
Previous After Market Report Next After Market Report >>>
|
|
|
|
DOW |
-53.42 |
18,400.88 |
-0.29% |
|
Volume |
1,080,988,560 |
+47% |
|
Volume |
1,587,774,380 |
+11% |
|
NASDAQ |
-9.77 |
5,213.22 |
-0.19% |
|
Advancers |
1,106 |
37% |
|
Advancers |
1,052 |
37% |
|
S&P 500 |
-5.17 |
2,170.95 |
-0.24% |
|
Decliners |
1,870 |
63% |
|
Decliners |
1,821 |
63% |
|
Russell 2000 |
-6.12 |
1,239.91 |
-0.49% |
|
52 Wk Highs |
169 |
|
|
52 Wk Highs |
143 |
|
|
S&P 600 |
-3.39 |
753.07 |
-0.45% |
|
52 Wk Lows |
6 |
|
|
52 Wk Lows |
20 |
|
|
 |
Major Indices Faced More Distributional Pressure
Kenneth J. Gruneisen - Passed the CAN SLIM® Master's Exam
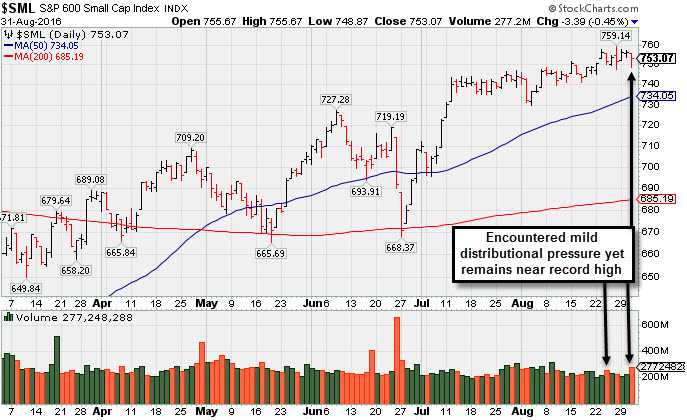
Stocks finished lower on Wednesday. The Dow was down 53 points to 18400. The S&P 500 lost 5 points to 2170 and the Nasdaq Composite fell 9 points to 5213. Behind the losses the volume totals were higher than the prior session on the NYSE and on the Nasdaq exchange, indicating even more distributional pressure. Decliners led advancers by 3-2 on the NYSE and 9-5 on the Nasdaq exchange. There were 26 high-ranked companies from the Leaders List that made new 52-week highs and were listed on the BreakOuts Page, versus the total of 46 on the prior session. New 52-week highs totals solidly outnumbered new 52-week lows on both the NYSE and the Nasdaq exchange. PICTURED: The S&P 600 Small Cap Index chart reveals recent distributional pressure with losses on higher volume yet it remains perched near its record high.
The "confirmed uptrend" for the market (M criteria) endured more distributional pressure as the S&P 500 Index broke a five-month winning streak and the Dow Jones Industrial Average slumped near its 50-day moving average (DMA) line. The Featured Stocks Page lists noteworthy candidates that have made headway. The S&P 500 snapped it’s five-month winning streak as oil prices retreated and investors looked ahead to Friday’s labor report. On the data front, an ADP report showed that 177,000 workers were added to private payrolls in August, above analyst estimates of 175,000. A separate release revealed pending home sales rose 1.3% in July, above expectations of a 0.7% increase. In international news, the Brazil Senate voted 61-20 to remove President Dilma Rousseff for breaking fiscal laws. Seven of 10 sectors in the S&P 500 finished negative on the session. Energy shares declined as NYMEX WTI crude retreated -3.4% to $44.76/barrel, after the weekly Energy Information Administration report showed crude inventories rose by 2.3 million barrels. In earnings, H&R Block (HRB -10.50%) fell as the tax services provider reported a wider-than-expected quarterly loss. Palo Alto Networks (PANW -7.17%) fell after being the subject of negative analyst commentary. In M&A news, Intersil Corp (ISIL +7.63%) rose amid speculation the company could announce sale to Renesas Electronics )as early as next week. Treasuries edged lower with the benchmark 10-year note down 3/32 to yield 1.57%. In commodities, COMEX gold fell 0.4% to $1307.90/ounce. In FOREX, the dollar strengthened against the yen. |
 Kenneth J. Gruneisen started out as a licensed stockbroker in August 1987, a couple of months prior to the historic stock market crash that took the Dow Jones Industrial Average down -22.6% in a single day. He has published daily fact-based fundamental and technical analysis on high-ranked stocks online for two decades. Through FACTBASEDINVESTING.COM, Kenneth provides educational articles, news, market commentary, and other information regarding proven investment systems that work in good times and bad.
Comments contained in the body of this report are technical opinions only and are not necessarily those of Gruneisen Growth Corp. The material herein has been obtained from sources believed to be reliable and accurate, however, its accuracy and completeness cannot be guaranteed. Our firm, employees, and customers may effect transactions, including transactions contrary to any recommendation herein, or have positions in the securities mentioned herein or options with respect thereto. Any recommendation contained in this report may not be suitable for all investors and it is not to be deemed an offer or solicitation on our part with respect to the purchase or sale of any securities. |
|
 |
Bank, Retail, and Semiconductor Indexes Held Up Best
Kenneth J. Gruneisen - Passed the CAN SLIM® Master's Exam
The Retail Index ($RLX -0.15%) and the Broker/Dealer Index ($XBD -0.26%) both edged lower while the Bank Index ($BKX +0.20%) eked out a small gain on Wednesday. Broader pressures weighed on the major averages as the Gold & Silver Index ($XAU -1.82%) and energy-linked groups were weak as the Oil Services Index ($OSX -1.60%) and the Integrated Oil Index ($XOI -1.70%) both ended solidly lower. The Networking Index ($NWX -0.26%) and the Biotechnology Index ($BTK -0.74%) both ended lower while the Semiconductor Index ($SOX -0.07%) finished flat. Charts courtesy www.stockcharts.com

PICTURED: The Semiconductor Index ($SOX -0.07%) bucked the broader market's pressure on Wednesday. It is consolidating near record highs after a choppy year.
| Oil Services |
$OSX |
156.60 |
-2.54 |
-1.60% |
-0.72% |
| Integrated Oil |
$XOI |
1,125.81 |
-19.50 |
-1.70% |
+4.95% |
| Semiconductor |
$SOX |
801.48 |
-0.59 |
-0.07% |
+20.80% |
| Networking |
$NWX |
393.14 |
-3.67 |
-0.93% |
+4.58% |
| Broker/Dealer |
$XBD |
172.20 |
-0.45 |
-0.26% |
-3.31% |
| Retail |
$RLX |
1,343.86 |
-1.96 |
-0.15% |
+4.71% |
| Gold & Silver |
$XAU |
90.17 |
-1.67 |
-1.82% |
+99.05% |
| Bank |
$BKX |
72.62 |
+0.15 |
+0.21% |
-0.63% |
| Biotech |
$BTK |
3,241.92 |
-24.08 |
-0.74% |
-15.00% |
|
|
|
 |
Building a New Base Above 50-Day Moving Average Line
Kenneth J. Gruneisen - Passed the CAN SLIM® Master's Exam
Patrick Industries Inc (PATK -$0.37 or -0.57% to $64.03) endured slight distributional pressure with a loss today on higher volume. Little resistance exists due to overhead supply, and it may be building a new base. It is consolidating above the 50-day moving average (DMA) line ($62.98) which defines important support along with its latest low ($59.51 on 8/16/16). Subsequent violations would raise concerns and trigger technical sell signals. It found prompt support after prior 50 DMA line violations raised concerns.
PATK hit its 52-week high when last shown in this FSU section on 7/28/16 with an annotated graph under the headline, "Rallied +30% in 2 Months Since Breakout Was Featured". It reported earnings +41% on +35% sales revenues for the Jun '16 quarter, continuing its streak of quarterly comparisons steadily above the +25% minimum earnings guideline (C criteria). A small downturn in FY '13 was a flaw previously noted in its annual earnings (A criteria) history. It was first highlighted in yellow with pivot point based on its 4/28/16 high plus 10 cents in the 5/24/16 mid-day report (read here). It finished strong with +132% above average volume as it hit new all-time highs confirming a technical buy signal.
Its current Up/Down Volume ratio of 2.0 is an unbiased indication that its shares were under accumulation over the past 50 days. The number of top-rated funds owning its share rose from 218 in Jun '15 to 268 in Jun '16, a reassuring trend concerning the I criteria. Its small supply of 14.3 million shares (S criteria) in the public float can contribute to greater price volatility in the event of institutional buying or selling. |
|
|
Color Codes Explained :
Y - Better candidates highlighted by our
staff of experts.
G - Previously featured
in past reports as yellow but may no longer be buyable under the
guidelines.
***Last / Change / Volume data in this table is the closing quote data***
Symbol/Exchange
Company Name
Industry Group |
PRICE |
CHANGE
(%Change) |
Day High |
Volume
(% DAV)
(% 50 day avg vol) |
52 Wk Hi
% From Hi |
Featured
Date |
Price
Featured |
Pivot Featured |
|
Max Buy |
TDG
-
NYSE
Transdigm Group Inc
AEROSPACE/DEFENSE - Aerospace/Defense Products and; Services
|
$285.19
|
-2.03
-0.71% |
$287.32
|
249,600
64.16% of 50 DAV
50 DAV is 389,000
|
$289.96
-1.65%
|
5/11/2016
|
$248.33
|
PP = $245.00
|
|
MB = $257.25
|
Most Recent Note - 8/29/2016 4:02:29 PM
G - Volume has been drying up while hovering in a tight range, and today's light volume gain led to a best-ever close. Its 50 DMA line and prior highs near $268 define important near-term support to watch on pullbacks.
>>> FEATURED STOCK ARTICLE : Gains Lack Great Volume While Wedging to New Highs - 7/27/2016 |
View all notes |
Set NEW NOTE alert |
Company Profile |
SEC
News |
Chart |
Request a new note
C
A
S
I |
IESC
-
NASDAQ
I E S Holdings Inc
Bldg-Maintenance and Svc
|
$16.57
|
-0.49
-2.87% |
$17.13
|
128,288
127.02% of 50 DAV
50 DAV is 101,000
|
$18.12
-8.55%
|
7/26/2016
|
$15.79
|
PP = $15.74
|
|
MB = $16.53
|
 Most Recent Note - 8/31/2016 2:41:33 PM
G - Pulling back for a 2nd session after spiking to new highs well above its "max buy" level. Under the fact-based system a stock which was previously sold can be bought back again if strength returns. Its 50 DMA line and the recent low (13.50 on 8/02/16) define important near-term support. See the latest FSU analysis for more details and an annotated graph.
>>> FEATURED STOCK ARTICLE : Strength Returned With Heavier Volume Gains for Highs - 8/30/2016 |
View all notes |
Set NEW NOTE alert |
Company Profile |
SEC
News |
Chart |
Request a new note
C
A
S
I |
NTES
-
NASDAQ
Netease Inc Adr
INTERNET - Internet Information Providers
|
$211.97
|
+0.97
0.46% |
$212.77
|
758,203
68.12% of 50 DAV
50 DAV is 1,113,000
|
$218.77
-3.11%
|
6/29/2016
|
$182.42
|
PP = $186.55
|
|
MB = $195.88
|
Most Recent Note - 8/26/2016 5:42:57 PM
G - Hit a new all-time high and finished strong with today's gain on near average volume, getting more extended from any sound base. Its 50 DMA line ($195) and prior highs near $186 define support to watch on pullbacks.
>>> FEATURED STOCK ARTICLE : Pulled Back on Higher Volume Following Earnings Report - 8/18/2016 |
View all notes |
Set NEW NOTE alert |
Company Profile |
SEC
News |
Chart |
Request a new note
C
A
S
I |
HTHT
-
NASDAQ
China Lodging Group Ads
LEISURE - Lodging
|
$44.63
|
-0.83
-1.83% |
$45.91
|
70,357
29.94% of 50 DAV
50 DAV is 235,000
|
$47.72
-6.48%
|
7/13/2016
|
$38.87
|
PP = $39.29
|
|
MB = $41.25
|
Most Recent Note - 8/30/2016 6:00:20 PM
G - Pulled back today with lighter (near average) volume. Extended from any sound base after rallying well above its "max buy" level. Prior highs and its 50 DMA line define near term support to watch on pullbacks.
>>> FEATURED STOCK ARTICLE : Volume-Driven Gains for New Highs Signal Institutional Demand - 8/17/2016 |
View all notes |
Set NEW NOTE alert |
Company Profile |
SEC
News |
Chart |
Request a new note
C
A
S
I |
MXL
-
NYSE
Maxlinear Inc Cl A
Telecom-Infrastructure
|
$19.17
|
+0.13
0.68% |
$19.26
|
995,415
71.20% of 50 DAV
50 DAV is 1,398,000
|
$22.50
-14.80%
|
5/16/2016
|
$19.24
|
PP = $19.20
|
|
MB = $20.16
|
Most Recent Note - 8/26/2016 5:49:32 PM
G - A rebound above the 50 DMA line ($19.55) is needed for its outlook to improve. Its 200 DMA line and prior lows in the $17 area define the next important support level where violations would raise serious concerns.
>>> FEATURED STOCK ARTICLE : Consolidating Near Highs Above its "Max Buy" Level - 7/29/2016 |
View all notes |
Set NEW NOTE alert |
Company Profile |
SEC
News |
Chart |
Request a new note
C
A
S
I |
Symbol/Exchange
Company Name
Industry Group |
PRICE |
CHANGE
(%Change) |
Day High |
Volume
(% DAV)
(% 50 day avg vol) |
52 Wk Hi
% From Hi |
Featured
Date |
Price
Featured |
Pivot Featured |
|
Max Buy |
PATK
-
NASDAQ
Patrick Industries Inc
WHOLESALE - Building Materials Wholesale
|
$64.03
|
-0.37
-0.57% |
$64.69
|
218,363
99.26% of 50 DAV
50 DAV is 220,000
|
$69.53
-7.91%
|
5/24/2016
|
$53.45
|
PP = $50.68
|
|
MB = $53.21
|
Most Recent Note - 8/31/2016 5:52:34 PM
G - Consolidating above the 50 DMA line ($62.98) and latest low ($59.51 on 8/16/16). Subsequent violations may raise concerns and trigger technical sell signals, meanwhile it may be forming a new base. See the latest FSU analysis for additional details and a new annotated graph.
>>> FEATURED STOCK ARTICLE : Building a New Base Above 50-Day Moving Average Line - 8/31/2016 |
View all notes |
Set NEW NOTE alert |
Company Profile |
SEC
News |
Chart |
Request a new note
C
A
S
I |
FBHS
-
NYSE
Fortune Brands Hme & Sec
Bldg-Constr Prds/Misc
|
$63.56
|
-0.10
-0.16% |
$63.82
|
706,754
36.24% of 50 DAV
50 DAV is 1,950,000
|
$64.47
-1.41%
|
6/22/2016
|
$57.71
|
PP = $60.08
|
|
MB = $63.08
|
Most Recent Note - 8/26/2016 5:45:46 PM
G - Volume totals have been cooling while stubbornly holding its ground in a tight range near its 52-week high. Prior highs and its 50 DMA line define near-term support in the $60-61 area.
>>> FEATURED STOCK ARTICLE : Perched Above "Max Buy" Level Following Volume-Driven Gain - 8/1/2016 |
View all notes |
Set NEW NOTE alert |
Company Profile |
SEC
News |
Chart |
Request a new note
C
A
S
I |
LGIH
-
NASDAQ
L G I Homes Inc
Bldg-Resident/Comml
|
$38.42
|
-0.47
-1.21% |
$39.10
|
536,058
102.69% of 50 DAV
50 DAV is 522,000
|
$39.23
-2.06%
|
8/29/2016
|
$37.08
|
PP = $36.44
|
|
MB = $38.26
|
Most Recent Note - 8/30/2016 12:23:44 PM
Y - Rallying further today near its "max buy" level after finishing strong on the prior session. Highlighted in yellow in the 8/29/16 mid-day report with pivot point cited based on its 7/26/16 high, it hit a new 52-week high with +130% above average volume while rising from a 39-week long cup-with-handle base triggering a technical buy signal. Fundamentals remain strong. Group Relative Strength Rating of 62 reveals mediocre leadership (L criteria) in the industry group. Reported +45% earnings on +40% sales revenues for the second quarter ended June 30, 2016 versus the year ago period. See the latest FSU analysis for more details and an annotated graph.
>>> FEATURED STOCK ARTICLE : Finished Strong While Rallying From Cup-With-Handle Base - 8/29/2016 |
View all notes |
Set NEW NOTE alert |
Company Profile |
SEC
News |
Chart |
Request a new note
C
A
S
I |
NVEE
-
NASDAQ
N V 5 Global Inc
Comml Svcs-Consulting
|
$30.57
|
-0.73
-2.33% |
$31.38
|
73,979
84.07% of 50 DAV
50 DAV is 88,000
|
$37.00
-17.38%
|
4/19/2016
|
$28.20
|
PP = $28.10
|
|
MB = $29.51
|
Most Recent Note - 8/31/2016 2:39:42 PM
G - Slumping below its 50 DMA line today and raising concerns. Prior highs in the $30 area also define important near-term support. More damaging losses may trigger worrisome technical sell signals.
>>> FEATURED STOCK ARTICLE : Technically Strong Despite Fundamental Concerns - 8/22/2016 |
View all notes |
Set NEW NOTE alert |
Company Profile |
SEC
News |
Chart |
Request a new note
C
A
S
I |
SFBS
-
NASDAQ
Servisfirst Bancshares
BANKING - Regional - Southeast Banks
|
$52.41
|
+0.01
0.02% |
$52.55
|
72,941
81.05% of 50 DAV
50 DAV is 90,000
|
$53.58
-2.18%
|
7/19/2016
|
$53.28
|
PP = $52.82
|
|
MB = $55.46
|
Most Recent Note - 8/31/2016 2:42:59 PM
Y - Still quietly consolidating within close striking distance of its 52-week high. Members were previously reminded - "A volume-driven gain and strong close above the pivot point are needed to clinch a convincing technical buy signal. It has been quietly consolidating since highlighted in yellow in the 7/19/16 mid-day report with pivot point cited based on the 6/01/16 high plus 10 cents."
>>> FEATURED STOCK ARTICLE : Still Consolidating Within Close Striking Distance of New Highs - 8/25/2016 |
View all notes |
Set NEW NOTE alert |
Company Profile |
SEC
News |
Chart |
Request a new note
C
A
S
I |
Symbol/Exchange
Company Name
Industry Group |
PRICE |
CHANGE
(%Change) |
Day High |
Volume
(% DAV)
(% 50 day avg vol) |
52 Wk Hi
% From Hi |
Featured
Date |
Price
Featured |
Pivot Featured |
|
Max Buy |
INGN
-
NASDAQ
Inogen Inc
HEALTH SERVICES - Medical Instruments and Supplies
|
$58.02
|
-0.44
-0.75% |
$58.40
|
146,279
67.10% of 50 DAV
50 DAV is 218,000
|
$59.00
-1.66%
|
8/5/2016
|
$51.72
|
PP = $56.08
|
|
MB = $58.88
|
Most Recent Note - 8/29/2016 4:04:33 PM
Y - Posted a gain with light volume today and matched its best-ever close after touching a new 52-week high. Stalled after its 8/09/16 volume-driven gain triggered a technical buy signal.
>>> FEATURED STOCK ARTICLE : Perched Within Striking Distance of Highs Following Rebound - 8/5/2016 |
View all notes |
Set NEW NOTE alert |
Company Profile |
SEC
News |
Chart |
Request a new note
C
A
S
I |
OLLI
-
NASDAQ
Ollie's Bargain Outlet
Retail-DiscountandVariety
|
$25.42
|
-0.30
-1.17% |
$26.26
|
1,150,750
188.03% of 50 DAV
50 DAV is 612,000
|
$28.72
-11.49%
|
7/19/2016
|
$26.42
|
PP = $28.82
|
|
MB = $30.26
|
Most Recent Note - 8/31/2016 5:55:01 PM
G - Slumped further below its 50 DMA line ($25.85) with above average volume behind today's 6th consecutive loss. Only a prompt rebound above the 50 DMA line would help its outlook improve. Members were repeatedly reminded in prior notes - "Volume-driven gains above the pivot point are still needed to trigger a convincing technical buy signal."
>>> FEATURED STOCK ARTICLE : Near High Awaiting Volume-Driven Gain to Trigger Technical Buy Signal - 8/24/2016 |
View all notes |
Set NEW NOTE alert |
Company Profile |
SEC
News |
Chart |
Request a new note
C
A
S
I |
|
|
|
THESE ARE NOT BUY RECOMMENDATIONS!
Comments contained in the body of this report are technical
opinions only. The material herein has been obtained
from sources believed to be reliable and accurate, however,
its accuracy and completeness cannot be guaranteed.
This site is not an investment advisor, hence it does
not endorse or recommend any securities or other investments.
Any recommendation contained in this report may not
be suitable for all investors and it is not to be deemed
an offer or solicitation on our part with respect to
the purchase or sale of any securities. All trademarks,
service marks and trade names appearing in this report
are the property of their respective owners, and are
likewise used for identification purposes only.
This report is a service available
only to active Paid Premium Members.
You may opt-out of receiving report notifications
at any time. Questions or comments may be submitted
by writing to Premium Membership Services 665 S.E. 10 Street, Suite 201 Deerfield Beach, FL 33441-5634 or by calling 1-800-965-8307
or 954-785-1121.
|
|
|