You are not logged in.
This means you
CAN ONLY VIEW reports that were published prior to Monday, April 7, 2025.
You
MUST UPGRADE YOUR MEMBERSHIP if you want to see any current reports.
AFTER MARKET UPDATE - MONDAY, AUGUST 22ND, 2016
Previous After Market Report Next After Market Report >>>
|
|
|
|
DOW |
-23.15 |
18,529.42 |
-0.12% |
|
Volume |
684,230,560 |
-17% |
|
Volume |
1,445,145,780 |
-4% |
|
NASDAQ |
+6.22 |
5,244.60 |
+0.12% |
|
Advancers |
1,488 |
50% |
|
Advancers |
1,554 |
54% |
|
S&P 500 |
-1.23 |
2,182.64 |
-0.06% |
|
Decliners |
1,461 |
50% |
|
Decliners |
1,338 |
46% |
|
Russell 2000 |
+2.97 |
1,239.74 |
+0.24% |
|
52 Wk Highs |
130 |
|
|
52 Wk Highs |
150 |
|
|
S&P 600 |
+1.92 |
750.77 |
+0.26% |
|
52 Wk Lows |
11 |
|
|
52 Wk Lows |
28 |
|
|
 |
Major Averages Ended Slightly Lower With Less Volume
Kenneth J. Gruneisen - Passed the CAN SLIM® Master's Exam
Stocks finished mostly lower on Monday. The Dow was down 23 points to 18529. The S&P 500 lost 1 point to 2182 and the Nasdaq Composite gained 6 points to 5244. The volume totals were lighter than the prior session on the NYSE and on the Nasdaq exchange. Advancers narrowly outnumbered decliners on the NYSE and led by only a 7-6 margin on the Nasdaq exchange. There were 29 high-ranked companies from the Leaders List that made new 52-week highs and were listed on the BreakOuts Page, versus the total of 40 on the prior session. New 52-week highs outnumbered new 52-week lows on both the NYSE and the Nasdaq exchange. PICTURED: The Dow Jones Industrial Average is consolidating near its record high after rallying above its 2015 peak.
Big gains for the major indices were noted in prior commentaries and that bullish action signaled a new "confirmed uptrend" for the market (M criteria). See the Featured Stocks Pagewhich now lists a few noteworthy candidates that have made headway. The major averages fluctuated on the session as a decline in Energy shares offset a rally in Biotech stocks. In economic news, Fed Vice-Chairman Stanley Fischer said that the U.S. central bank is close to hitting its targets for 2% inflation and full employment. Investors will now look ahead to Fed Chair Janet Yellen’s speech on Friday for possible hints regarding the timing of the next interest rate increase. Six of 10 sectors in the S&P 500 finished in negative territory. Energy shares declined as NYMEX WTI crude retreated 3% to $47.09/barrel. Marathon Oil (MRO -6.90%) fell as the company announced the departure of its chief financial officer. Biotech stocks outperformed with Medivation (MDVN +19.74%) after agreeing to a $14 billion takeover bid from Pfizer (PFE -0.40%). Elsewhere on the M&A front, Intersil Corp (ISIL +19.82%) with news the chipmaker is close to being acquired by Japan’s Renesas Electronics (RNECY +6.12%) for $3 billion. Syngenta (SYT +10.44%) as its merger with ChemChina received national-security clearance. Treasuries advanced along the curve with the benchmark 10-year note up 11/32 to yield 1.54%. In commodities, COMEX gold lost 0.2% to $1337.70/ounce. |
 Kenneth J. Gruneisen started out as a licensed stockbroker in August 1987, a couple of months prior to the historic stock market crash that took the Dow Jones Industrial Average down -22.6% in a single day. He has published daily fact-based fundamental and technical analysis on high-ranked stocks online for two decades. Through FACTBASEDINVESTING.COM, Kenneth provides educational articles, news, market commentary, and other information regarding proven investment systems that work in good times and bad.
Comments contained in the body of this report are technical opinions only and are not necessarily those of Gruneisen Growth Corp. The material herein has been obtained from sources believed to be reliable and accurate, however, its accuracy and completeness cannot be guaranteed. Our firm, employees, and customers may effect transactions, including transactions contrary to any recommendation herein, or have positions in the securities mentioned herein or options with respect thereto. Any recommendation contained in this report may not be suitable for all investors and it is not to be deemed an offer or solicitation on our part with respect to the purchase or sale of any securities. |
|
 |
Commodity-Linked Groups Fell; Biotech Index Rose
Kenneth J. Gruneisen - Passed the CAN SLIM® Master's Exam
Commodity-linked groups fell as the Oil Services Index ($OSX -2.34%), Integrated Oil Index ($XOI -1.15%) and the Gold & Silver Index ($XAU -1.84%) ended unanimously lower. The Broker/Dealer Index ($XBD +0.05%), Bank Index ($BKX +0.01%) and the Retail Index ($RLX -0.19%) each finished little changed on Monday. The Biotechnology Index ($BTK +2.73%) led the tech sector while the Networking Index ($NWX +0.18%) and the Semiconductor Index ($SOX +0.03%) were both little changed. Charts courtesy www.stockcharts.com
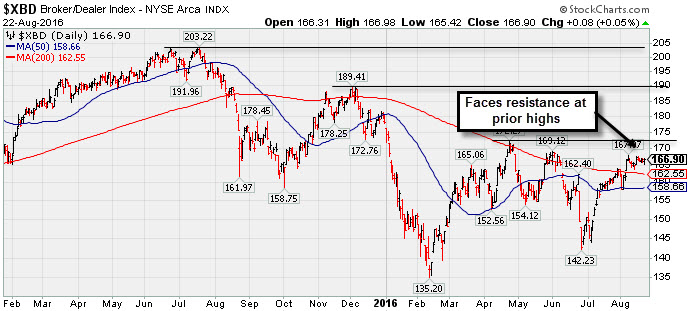
PICTURED: The Broker/Dealer Index ($XBD +0.05%) is consolidating above its 50-day and 200-day moving average (DMA) lines, and it faces resistance at prior highs.
| Oil Services |
$OSX |
162.41 |
-3.89 |
-2.34% |
+2.97% |
| Integrated Oil |
$XOI |
1,138.49 |
-13.29 |
-1.15% |
+6.13% |
| Semiconductor |
$SOX |
797.29 |
+0.23 |
+0.03% |
+20.17% |
| Networking |
$NWX |
394.97 |
+0.72 |
+0.18% |
+5.06% |
| Broker/Dealer |
$XBD |
166.90 |
+0.08 |
+0.05% |
-6.28% |
| Retail |
$RLX |
1,361.12 |
-2.56 |
-0.19% |
+6.05% |
| Gold & Silver |
$XAU |
105.71 |
-1.98 |
-1.84% |
+133.36% |
| Bank |
$BKX |
70.23 |
+0.00 |
+0.00% |
-3.90% |
| Biotech |
$BTK |
3,408.25 |
+90.61 |
+2.73% |
-10.64% |
|
|
|
 |
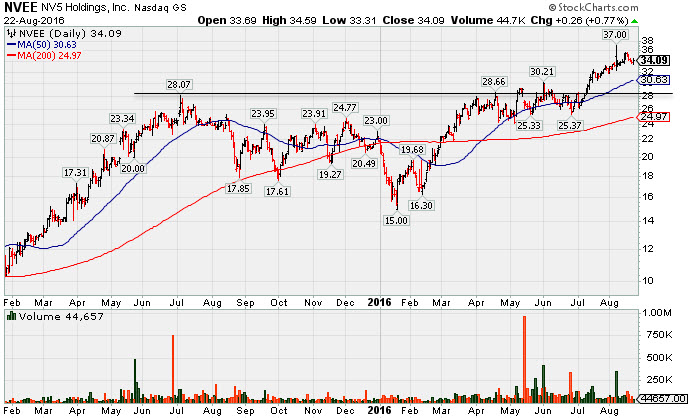
Technically Strong Despite Fundamental Concerns
Kenneth J. Gruneisen - Passed the CAN SLIM® Master's Exam
N V 5 Global Inc (NVEE +$0.26 or +0.77% to $34.09) remains perched near all-time highs after recently wedging higher. Its 50-day moving average (DMA) line and prior highs define important near-term support where violations would raise concerns and trigger technical sell signals. Recently it reported earnings +23% on +62% sales revenues, below the +25% minimum earnings guideline (C criteria), raising concerns. Prior quarterly earnings comparisons had been mostly above the +25% minimum guideline (C criteria) of the fact-based investment system. Its strong annual earnings (A criteria) history was noted.
NVEE was last shown in this FSU section on 7/18/16 with an annotated graph under the headline, "Winning Streak Leaves Leader Extended From Prior Base Pattern". No resistance due to overhead supply, but it is extended more than +5% above its prior high or pivot point. Disciplined investors avoid chasing extended stocks. It completed a new Public Offering on 5/13/16. Members were cautioned - "Such offerings often hinder near-term price progress yet help companies to attract more institutional owners (I criteria). Remember that any stock that was previously sold can be bought again when strength returns."
The number of top-rated funds owning its shares rose from 13 in Mar '15 to to 140 in Jun '16, a reassuring sign concerning the I criteria. It completed a new Public Offering on 5/22/15. NVEE was first highlighted with a pivot point based on its 12/02/15 high in the 3/14/16 mid-day report (read here) and then finished strong and triggered a technical buy signal while rising from an 8-month double bottom base with +142% above average volume. |
|
|
Color Codes Explained :
Y - Better candidates highlighted by our
staff of experts.
G - Previously featured
in past reports as yellow but may no longer be buyable under the
guidelines.
***Last / Change / Volume data in this table is the closing quote data***
Symbol/Exchange
Company Name
Industry Group |
PRICE |
CHANGE
(%Change) |
Day High |
Volume
(% DAV)
(% 50 day avg vol) |
52 Wk Hi
% From Hi |
Featured
Date |
Price
Featured |
Pivot Featured |
|
Max Buy |
TDG
-
NYSE
Transdigm Group Inc
AEROSPACE/DEFENSE - Aerospace/Defense Products and; Services
|
$285.87
|
+0.46
0.16% |
$287.45
|
175,485
40.72% of 50 DAV
50 DAV is 431,000
|
$289.67
-1.31%
|
5/11/2016
|
$248.33
|
PP = $245.00
|
|
MB = $257.25
|
 Most Recent Note - 8/22/2016 5:34:02 PM
G - Volume has been drying up while hovering in a tight range near all-time highs. Its 50 DMA line and prior highs near $268 define important near-term support to watch on pullbacks.
>>> FEATURED STOCK ARTICLE : Gains Lack Great Volume While Wedging to New Highs - 7/27/2016 |
View all notes |
Set NEW NOTE alert |
Company Profile |
SEC
News |
Chart |
Request a new note
C
A
S
I |
IESC
-
NASDAQ
I E S Holdings Inc
Bldg-Maintenance and Svc
|
$14.77
|
-0.14
-0.94% |
$14.88
|
39,757
41.85% of 50 DAV
50 DAV is 95,000
|
$16.77
-11.93%
|
7/26/2016
|
$15.79
|
PP = $15.74
|
|
MB = $16.53
|
Most Recent Note - 8/19/2016 5:29:30 PM
Y - Found support above its 50 DMA line ($13.99), however its slump back into the prior base raised concerns. Recent low (13.50 on 8/02/16) defines near-term support below its 50 DMA line.
>>> FEATURED STOCK ARTICLE : Volume-Driven Gain for New Highs Clinched Technical Buy Signal - 7/26/2016 |
View all notes |
Set NEW NOTE alert |
Company Profile |
SEC
News |
Chart |
Request a new note
C
A
S
I |
NTES
-
NASDAQ
Netease Inc Adr
INTERNET - Internet Information Providers
|
$212.57
|
+2.83
1.35% |
$214.48
|
907,330
79.31% of 50 DAV
50 DAV is 1,144,000
|
$217.37
-2.21%
|
6/29/2016
|
$182.42
|
PP = $186.55
|
|
MB = $195.88
|
Most Recent Note - 8/18/2016 5:25:38 PM
G - Pulled back with above average volume today. Prior highs near $186 and its 50 DMA line define important support to watch. Reported earnings +89% on +83% sales revenues for the Jun '16 quarter, continuing its strong earnings track record. Volume and volatility often increase near earnings news. See the latest FSU analysis for more details and a new annotated graph.
>>> FEATURED STOCK ARTICLE : Pulled Back on Higher Volume Following Earnings Report - 8/18/2016 |
View all notes |
Set NEW NOTE alert |
Company Profile |
SEC
News |
Chart |
Request a new note
C
A
S
I |
HTHT
-
NASDAQ
China Lodging Group Ads
LEISURE - Lodging
|
$43.47
|
-0.08
-0.18% |
$43.50
|
213,150
97.78% of 50 DAV
50 DAV is 218,000
|
$46.57
-6.66%
|
7/13/2016
|
$38.87
|
PP = $39.29
|
|
MB = $41.25
|
Most Recent Note - 8/18/2016 12:22:03 PM
G - Recently hitting new highs with considerable volume-driven gains indicative of fresh institutional buying demand. Color code was changed to green after again rallying above its "max buy" level. See the latest FSU analysis for more details and annotated graph.
>>> FEATURED STOCK ARTICLE : Volume-Driven Gains for New Highs Signal Institutional Demand - 8/17/2016 |
View all notes |
Set NEW NOTE alert |
Company Profile |
SEC
News |
Chart |
Request a new note
C
A
S
I |
MXL
-
NYSE
Maxlinear Inc Cl A
Telecom-Infrastructure
|
$18.37
|
+0.23
1.27% |
$18.48
|
1,104,557
82.00% of 50 DAV
50 DAV is 1,347,000
|
$22.50
-18.36%
|
5/16/2016
|
$19.24
|
PP = $19.20
|
|
MB = $20.16
|
Most Recent Note - 8/19/2016 5:33:31 PM
G - Found support at its 200 DMA line following a gap down and big volume-driven loss on 8/09/16. More damaging losses would raise greater concerns, meanwhile, a rebound above the 50 DMA line ($19.69) is needed for its outlook to improve.
>>> FEATURED STOCK ARTICLE : Consolidating Near Highs Above its "Max Buy" Level - 7/29/2016 |
View all notes |
Set NEW NOTE alert |
Company Profile |
SEC
News |
Chart |
Request a new note
C
A
S
I |
Symbol/Exchange
Company Name
Industry Group |
PRICE |
CHANGE
(%Change) |
Day High |
Volume
(% DAV)
(% 50 day avg vol) |
52 Wk Hi
% From Hi |
Featured
Date |
Price
Featured |
Pivot Featured |
|
Max Buy |
PATK
-
NASDAQ
Patrick Industries Inc
WHOLESALE - Building Materials Wholesale
|
$64.82
|
-0.31
-0.48% |
$65.43
|
265,305
124.56% of 50 DAV
50 DAV is 213,000
|
$69.53
-6.77%
|
5/24/2016
|
$53.45
|
PP = $50.68
|
|
MB = $53.21
|
Most Recent Note - 8/19/2016 12:54:47 PM
G - Found prompt support near its 50 DMA line, rallying this week with above average volume toward prior highs. Subsequent deterioration below the 50 DMA line and latest low ($59.51 on 8/16/16) would raise greater concerns and trigger a technical sell signal.
>>> FEATURED STOCK ARTICLE : Rallied +30% in 2 Months Since Breakout Was Featured - 7/28/2016 |
View all notes |
Set NEW NOTE alert |
Company Profile |
SEC
News |
Chart |
Request a new note
C
A
S
I |
FBHS
-
NYSE
Fortune Brands Hme & Sec
Bldg-Constr Prds/Misc
|
$62.83
|
+0.13
0.21% |
$62.91
|
1,222,682
61.60% of 50 DAV
50 DAV is 1,984,900
|
$64.47
-2.54%
|
6/22/2016
|
$57.71
|
PP = $60.08
|
|
MB = $63.08
|
Most Recent Note - 8/19/2016 5:27:18 PM
G - It stalled since hitting new highs on 7/28/16 with +66% above average volume following strong earnings news. Prior highs and its 50 DMA line coincide defining near-term support in the $60 area.
>>> FEATURED STOCK ARTICLE : Perched Above "Max Buy" Level Following Volume-Driven Gain - 8/1/2016 |
View all notes |
Set NEW NOTE alert |
Company Profile |
SEC
News |
Chart |
Request a new note
C
A
S
I |
NVEE
-
NASDAQ
N V 5 Global Inc
Comml Svcs-Consulting
|
$34.09
|
+0.26
0.77% |
$34.59
|
44,573
51.83% of 50 DAV
50 DAV is 86,000
|
$37.00
-7.86%
|
4/19/2016
|
$28.20
|
PP = $28.10
|
|
MB = $29.51
|
Most Recent Note - 8/22/2016 5:32:51 PM
G - Its 50 DMA line and prior highs in the $30 coincide defining important near-term support. See the latest FSU analysis for more details and a new annotated graph.
>>> FEATURED STOCK ARTICLE : Technically Strong Despite Fundamental Concerns - 8/22/2016 |
View all notes |
Set NEW NOTE alert |
Company Profile |
SEC
News |
Chart |
Request a new note
C
A
S
I |
SFBS
-
NASDAQ
"ServisFirst Bancshares, Inc"
BANKING - Regional - Southeast Banks
|
$51.76
|
+0.50
0.98% |
$51.86
|
49,752
51.77% of 50 DAV
50 DAV is 96,100
|
$53.58
-3.40%
|
7/19/2016
|
$53.28
|
PP = $52.82
|
|
MB = $55.46
|
Most Recent Note - 8/22/2016 5:35:09 PM
Y - Still quietly consolidating above its 50 DMA line ($50.12). Members were previously reminded - "A volume-driven gain and strong close above the pivot point are needed to clinch a convincing technical buy signal. It has been quietly consolidating since highlighted in yellow in the 7/19/16 mid-day report with pivot point cited based on the 6/01/16 high plus 10 cents."
>>> FEATURED STOCK ARTICLE : Meeting Resistance Near Prior Highs - 7/20/2016 |
View all notes |
Set NEW NOTE alert |
Company Profile |
SEC
News |
Chart |
Request a new note
C
A
S
I |
INGN
-
NASDAQ
Inogen Inc
HEALTH SERVICES - Medical Instruments and Supplies
|
$56.67
|
-0.35
-0.61% |
$57.44
|
119,660
53.90% of 50 DAV
50 DAV is 222,000
|
$58.78
-3.59%
|
8/5/2016
|
$51.72
|
PP = $56.08
|
|
MB = $58.88
|
Most Recent Note - 8/19/2016 5:31:27 PM
Y - Endured distributional pressure yet remains perched above its pivot point and near its 52-week high. Stalled after its 8/09/16 volume-driven gain triggered a technical buy signal.
>>> FEATURED STOCK ARTICLE : Perched Within Striking Distance of Highs Following Rebound - 8/5/2016 |
View all notes |
Set NEW NOTE alert |
Company Profile |
SEC
News |
Chart |
Request a new note
C
A
S
I |
Symbol/Exchange
Company Name
Industry Group |
PRICE |
CHANGE
(%Change) |
Day High |
Volume
(% DAV)
(% 50 day avg vol) |
52 Wk Hi
% From Hi |
Featured
Date |
Price
Featured |
Pivot Featured |
|
Max Buy |
OLLI
-
NASDAQ
Ollie's Bargain Outlet
Retail-DiscountandVariety
|
$27.40
|
-0.32
-1.15% |
$28.00
|
305,829
43.14% of 50 DAV
50 DAV is 709,000
|
$28.72
-4.60%
|
7/19/2016
|
$26.42
|
PP = $28.82
|
|
MB = $30.26
|
Most Recent Note - 8/18/2016 5:27:24 PM
Y - Managed a best-ever close with today's gain backed by below average volume while rising within close striking distance of all-time highs. Members were repeatedly reminded in prior notes - "Volume-driven gains above the pivot point are still needed to trigger a convincing technical buy signal."
>>> FEATURED STOCK ARTICLE : Retail Firm Approaching Pivot Point - 7/19/2016 |
View all notes |
Set NEW NOTE alert |
Company Profile |
SEC
News |
Chart |
Request a new note
C
A
S
I |
|
|
|
THESE ARE NOT BUY RECOMMENDATIONS!
Comments contained in the body of this report are technical
opinions only. The material herein has been obtained
from sources believed to be reliable and accurate, however,
its accuracy and completeness cannot be guaranteed.
This site is not an investment advisor, hence it does
not endorse or recommend any securities or other investments.
Any recommendation contained in this report may not
be suitable for all investors and it is not to be deemed
an offer or solicitation on our part with respect to
the purchase or sale of any securities. All trademarks,
service marks and trade names appearing in this report
are the property of their respective owners, and are
likewise used for identification purposes only.
This report is a service available
only to active Paid Premium Members.
You may opt-out of receiving report notifications
at any time. Questions or comments may be submitted
by writing to Premium Membership Services 665 S.E. 10 Street, Suite 201 Deerfield Beach, FL 33441-5634 or by calling 1-800-965-8307
or 954-785-1121.
|
|
|