You are not logged in.
This means you
CAN ONLY VIEW reports that were published prior to Monday, April 7, 2025.
You
MUST UPGRADE YOUR MEMBERSHIP if you want to see any current reports.
AFTER MARKET UPDATE - TUESDAY, SEPTEMBER 13TH, 2016
Previous After Market Report Next After Market Report >>>
|
|
|
|
DOW |
-258.32 |
18,066.75 |
-1.41% |
|
Volume |
1,006,163,180 |
+1% |
|
Volume |
1,897,542,060 |
+4% |
|
NASDAQ |
-56.64 |
5,155.25 |
-1.09% |
|
Advancers |
338 |
11% |
|
Advancers |
539 |
18% |
|
S&P 500 |
-32.02 |
2,127.02 |
-1.48% |
|
Decliners |
2,734 |
89% |
|
Decliners |
2,392 |
82% |
|
Russell 2000 |
-23.55 |
1,212.32 |
-1.91% |
|
52 Wk Highs |
18 |
|
|
52 Wk Highs |
36 |
|
|
S&P 600 |
-13.36 |
734.82 |
-1.79% |
|
52 Wk Lows |
34 |
|
|
52 Wk Lows |
51 |
|
|
 |
Major Indices Suffer More Distributional Damage
Kenneth J. Gruneisen - Passed the CAN SLIM® Master's Exam
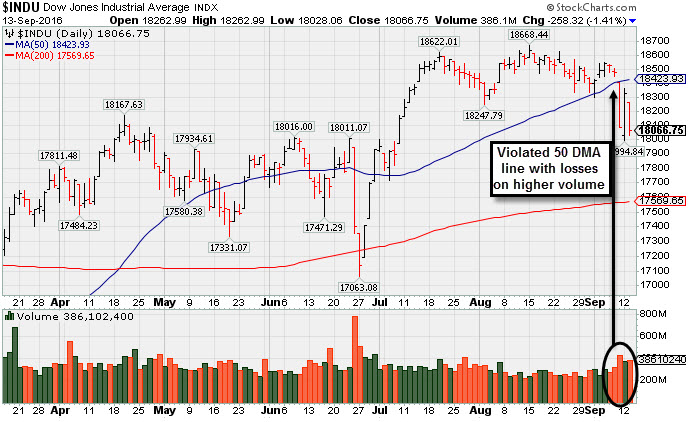
Stocks retreated on Tuesday. The Dow was down 258 points to 18066. The S&P 500 lost 32 points to 2127 and the Nasdaq Composite fell 56 points to 5155. Behind the losses the volume totals were higher than the prior session on both the NYSE and the Nasdaq exchange, a sign of more distributional selling pressure from the institutional crowd. Breadth was solidly negative as decliners led advancers by an 8-1 margin on the NYSE and more than 4-1 on the Nasdaq exchange. Leadership remained thin as only 11 high-ranked companies from the Leaders List made new 52-week highs and were listed on the BreakOuts Page, down abruptly from 71 last Wednesday. New 52-week lows totals outnumbered shrinking lists of new 52-week highs on the NYSE and the Nasdaq exchange, raising more concerns regarding the recently deteriorating market environment. PICTURED: The Dow Jones Industrial Average chart shows heavier volume behind damaging losses while slumping below its 50-day moving average (DMA) line.
The major indices' charts have shown the worrisome look of a "correction", and the recently noted "healthy crop" of leading stocks abruptly dried up. Few stocks have reached new 52-week highs over the past 3 sessions, meanwhile new 52-week lows totals have expanded. In periods of market weakness the fact-based investment system suggests reducing exposure to stocks as they weaken and on a case-by-case basis. The Featured Stocks Page lists noteworthy candidates that have made headway. Technical damage for the market (M criteria) still remains after Monday's bounce, as both the Dow Jones Industrial Average and the S&P 500 Index remain below their respective 50-day moving average (DMA) lines.
The major averages finished firmly lower on the session as Energy shares declined and investors weighed growing uncertainty on the timing of a rate hike. In commodities, NYMEX WTI crude retreated 3% to $44.90/barrel, after an IEA report warned that global oil demand is slowing at a faster pace than initially expected. On the M&A front, Intersil Corp climbed 9.8% to $21.70 after agreeing to a $3.2 billion takeover bid from Japanese chipmaker Renesas Electronics.
All 11 sectors in the S&P 500 finished in negative territory with Energy shares falling more than 2%. Anadarko Petroleum (APC -0.35%) agreed to acquire Gulf of Mexico oil assets from Freeport-McMoRan (FCX -8.39%) for $2 billion. Anthem (ANTM -3.12%) fell after being the subject of negative analyst commentary. In Tech, shares of Apple (AAPL +2.38) rose with news T-Mobile (TMUS -1.28%) announced the iPhone 7 pre-orders has shattered all previous iPhone records at the carrier. JetBlue (JBLU +2.44%) was higher after the airline reported August traffic increased 6.2%.
Treasuries declined along the curve with the benchmark 10-year note down 17/32 to yield 1.72%. COMEX gold was off 0.3% to $1317.50/ounce. In FOREX, the Dollar Index gained 0.5% with particular strength against the British pound. |
 Kenneth J. Gruneisen started out as a licensed stockbroker in August 1987, a couple of months prior to the historic stock market crash that took the Dow Jones Industrial Average down -22.6% in a single day. He has published daily fact-based fundamental and technical analysis on high-ranked stocks online for two decades. Through FACTBASEDINVESTING.COM, Kenneth provides educational articles, news, market commentary, and other information regarding proven investment systems that work in good times and bad.
Comments contained in the body of this report are technical opinions only and are not necessarily those of Gruneisen Growth Corp. The material herein has been obtained from sources believed to be reliable and accurate, however, its accuracy and completeness cannot be guaranteed. Our firm, employees, and customers may effect transactions, including transactions contrary to any recommendation herein, or have positions in the securities mentioned herein or options with respect thereto. Any recommendation contained in this report may not be suitable for all investors and it is not to be deemed an offer or solicitation on our part with respect to the purchase or sale of any securities. |
|
 |
Commodity-Linked Groups Led Widespread Losses
Kenneth J. Gruneisen - Passed the CAN SLIM® Master's Exam
The Broker/Dealer Index ($XBD -2.03%) and Bank Index ($BKX -1.06%) both fell on Tuesday while the Retail Index ($RLX -1.52%) also created a drag on the major indices. The Biotechnology Index ($BTK -1.58%), Networking Index ($NWX -1.58%) and the Semiconductor Index ($SOX -0.92%) suffered unanimous losses. Commodity-linked groups also suffered big setbacks again as the Gold & Silver Index ($XAU -4.67%), Oil Services Index ($OSX -3.18%) and the Integrated Oil Index ($XOI -2.87%) each finished decisively lower. Charts courtesy www.stockcharts.com

PICTURED: The Networking Index ($NWX -1.58%) has slumped near its 50-day moving average (DMA) line.
| Oil Services |
$OSX |
150.83 |
-4.95 |
-3.18% |
-4.37% |
| Integrated Oil |
$XOI |
1,110.55 |
-32.86 |
-2.87% |
+3.53% |
| Semiconductor |
$SOX |
776.73 |
-7.22 |
-0.92% |
+17.07% |
| Networking |
$NWX |
387.66 |
-6.24 |
-1.58% |
+3.12% |
| Broker/Dealer |
$XBD |
170.04 |
-3.52 |
-2.03% |
-4.52% |
| Retail |
$RLX |
1,303.22 |
-20.12 |
-1.52% |
+1.54% |
| Gold & Silver |
$XAU |
92.24 |
-4.51 |
-4.66% |
+103.62% |
| Bank |
$BKX |
71.08 |
-1.17 |
-1.62% |
-2.74% |
| Biotech |
$BTK |
3,359.57 |
-53.93 |
-1.58% |
-11.91% |
|
|
|
 |
Seriously Applying the Fact-Based System Now
Kenneth J. Gruneisen - Passed the CAN SLIM® Master's Exam
Asset Management Services Using the Fact-Based Investment System You can have professional help in limiting your losses and maximizing your gains in all market environments. For help with how your portfolio is managed click here and indicate "Find a Broker". Account minimum $250,000. |
|
|
Color Codes Explained :
Y - Better candidates highlighted by our
staff of experts.
G - Previously featured
in past reports as yellow but may no longer be buyable under the
guidelines.
***Last / Change / Volume data in this table is the closing quote data***
Symbol/Exchange
Company Name
Industry Group |
PRICE |
CHANGE
(%Change) |
Day High |
Volume
(% DAV)
(% 50 day avg vol) |
52 Wk Hi
% From Hi |
Featured
Date |
Price
Featured |
Pivot Featured |
|
Max Buy |
TDG
-
NYSE
Transdigm Group Inc
AEROSPACE/DEFENSE - Aerospace/Defense Products and; Services
|
$281.74
|
-4.72
-1.65% |
$285.30
|
264,420
76.20% of 50 DAV
50 DAV is 347,000
|
$294.38
-4.29%
|
5/11/2016
|
$248.33
|
PP = $245.00
|
|
MB = $257.25
|
 Most Recent Note - 9/13/2016 5:50:29 PM
G - Fell today with light volume, slumping near its 50 DMA line ($279) defining important near-term support to watch.
>>> FEATURED STOCK ARTICLE : Light Volume Behind Gains Wedging for New Highs - 9/7/2016 |
View all notes |
Set NEW NOTE alert |
Company Profile |
SEC
News |
Chart |
Request a new note
C
A
S
I |
IESC
-
NASDAQ
I E S Holdings Inc
Bldg-Maintenance and Svc
|
$15.15
|
-0.61
-3.87% |
$15.74
|
64,373
75.73% of 50 DAV
50 DAV is 85,000
|
$18.16
-16.57%
|
7/26/2016
|
$15.79
|
PP = $15.74
|
|
MB = $16.53
|
Most Recent Note - 9/13/2016 5:46:18 PM
G - Following a "negative reversal" noted on 9/06/16 it is testing its 50 DMA line ($15.13). Below that important short-term average, the prior low (13.50 on 8/02/16) defines the next important near-term support to watch.
>>> FEATURED STOCK ARTICLE : Strength Returned With Heavier Volume Gains for Highs - 8/30/2016 |
View all notes |
Set NEW NOTE alert |
Company Profile |
SEC
News |
Chart |
Request a new note
C
A
S
I |
NTES
-
NASDAQ
Netease Inc Adr
INTERNET - Internet Information Providers
|
$231.27
|
+1.20
0.52% |
$240.47
|
2,811,736
248.83% of 50 DAV
50 DAV is 1,130,000
|
$230.55
0.31%
|
6/29/2016
|
$182.42
|
PP = $186.55
|
|
MB = $195.88
|
Most Recent Note - 9/13/2016 12:19:25 PM
G - Tallying considerable gains with above average volume and rallying further into new all-time high territory. It is extended from any sound base. Its 50 DMA line ($204) defines near-term support.
>>> FEATURED STOCK ARTICLE : Pulled Back on Higher Volume Following Earnings Report - 8/18/2016 |
View all notes |
Set NEW NOTE alert |
Company Profile |
SEC
News |
Chart |
Request a new note
C
A
S
I |
HTHT
-
NASDAQ
China Lodging Group Ads
LEISURE - Lodging
|
$45.03
|
-0.97
-2.11% |
$46.00
|
109,216
48.33% of 50 DAV
50 DAV is 226,000
|
$47.72
-5.64%
|
7/13/2016
|
$38.87
|
PP = $39.29
|
|
MB = $41.25
|
Most Recent Note - 9/12/2016 6:11:53 PM
G - Posted a gain with above average volume and finished near the session high today for its second-best close ever. Extended from any sound base after rallying well above its "max buy" level. Prior highs and its 50 DMA line define near term support to watch on pullbacks.
>>> FEATURED STOCK ARTICLE : Volume-Driven Gains for New Highs Signal Institutional Demand - 8/17/2016 |
View all notes |
Set NEW NOTE alert |
Company Profile |
SEC
News |
Chart |
Request a new note
C
A
S
I |
MXL
-
NYSE
Maxlinear Inc Cl A
Telecom-Infrastructure
|
$18.18
|
-0.35
-1.89% |
$18.66
|
932,239
67.12% of 50 DAV
50 DAV is 1,389,000
|
$22.50
-19.20%
|
5/16/2016
|
$19.24
|
PP = $19.20
|
|
MB = $20.16
|
Most Recent Note - 9/13/2016 5:37:32 PM
Needs a rebound above its 50 DMA line ($19.72) for its outlook to improve. Slumping near its 200 DMA line and prior lows in the $17 area. It will be dropped from the Featured Stocks list tonight.
>>> FEATURED STOCK ARTICLE : Rebound to 50-Day Moving Average After Abrupt Drop to 200-Day Line - 9/1/2016 |
View all notes |
Set NEW NOTE alert |
Company Profile |
SEC
News |
Chart |
Request a new note
C
A
S
I |
Symbol/Exchange
Company Name
Industry Group |
PRICE |
CHANGE
(%Change) |
Day High |
Volume
(% DAV)
(% 50 day avg vol) |
52 Wk Hi
% From Hi |
Featured
Date |
Price
Featured |
Pivot Featured |
|
Max Buy |
PATK
-
NASDAQ
Patrick Industries Inc
WHOLESALE - Building Materials Wholesale
|
$60.07
|
-2.51
-4.01% |
$62.13
|
195,878
90.27% of 50 DAV
50 DAV is 217,000
|
$69.53
-13.61%
|
9/8/2016
|
$64.74
|
PP = $69.63
|
|
MB = $73.11
|
Most Recent Note - 9/13/2016 5:43:16 PM
G - Color code is changed to green after slumping below its 50 DMA line near prior lows. New pivot point was recently cited based on its 7/28/16 high plus 10 cents, however gains above the pivot point with heavy volume did not show up after members were reminded - "Volume-driven gains for new highs may trigger a new (or add-on) technical buy signal."
>>> FEATURED STOCK ARTICLE : Building a New Base Above 50-Day Moving Average Line - 8/31/2016 |
View all notes |
Set NEW NOTE alert |
Company Profile |
SEC
News |
Chart |
Request a new note
C
A
S
I |
FBHS
-
NYSE
Fortune Brands Hme & Sec
Bldg-Constr Prds/Misc
|
$58.20
|
-0.80
-1.36% |
$58.90
|
1,237,732
104.00% of 50 DAV
50 DAV is 1,190,100
|
$64.47
-9.73%
|
6/22/2016
|
$57.71
|
PP = $60.08
|
|
MB = $63.08
|
Most Recent Note - 9/12/2016 6:14:35 PM
G - Halted its slide with a gain today backed by above average volume. A rebound above its 50 DMA line is needed for its outlook to improve after damaging losses last week triggered technical sell signals.
>>> FEATURED STOCK ARTICLE : Pullback Testing Important Near-Term Support Level - 9/8/2016 |
View all notes |
Set NEW NOTE alert |
Company Profile |
SEC
News |
Chart |
Request a new note
C
A
S
I |
LGIH
-
NASDAQ
L G I Homes Inc
Bldg-Resident/Comml
|
$36.27
|
-0.99
-2.66% |
$37.41
|
458,928
82.10% of 50 DAV
50 DAV is 559,000
|
$40.47
-10.38%
|
8/29/2016
|
$37.08
|
PP = $36.44
|
|
MB = $38.26
|
Most Recent Note - 9/12/2016 12:51:50 PM
Y - Color code is changed to yellow after pulling back below its "max buy" level. Finding prompt support today after a big loss on the prior session with heavy volume tested prior highs in the $36 area and its 50 DMA line defining initial support to watch.
>>> FEATURED STOCK ARTICLE : Finished Strong While Rallying From Cup-With-Handle Base - 8/29/2016 |
View all notes |
Set NEW NOTE alert |
Company Profile |
SEC
News |
Chart |
Request a new note
C
A
S
I |
NVEE
-
NASDAQ
N V 5 Global Inc
Comml Svcs-Consulting
|
$28.80
|
-1.17
-3.90% |
$29.92
|
53,479
70.37% of 50 DAV
50 DAV is 76,000
|
$37.00
-22.16%
|
4/19/2016
|
$28.20
|
PP = $28.10
|
|
MB = $29.51
|
Most Recent Note - 9/13/2016 5:34:37 PM
Quietly sank further below its 50 DMA line and below prior highs in the $30 area today raising more serious concerns. Only a prompt rebound above the 50 DMA ($31.83) line would help its outlook improve. Faces resistance due to overhead supply up through the $36 level. It will be dropped from the Featured Stocks list tonight.
>>> FEATURED STOCK ARTICLE : Technically Strong Despite Fundamental Concerns - 8/22/2016 |
View all notes |
Set NEW NOTE alert |
Company Profile |
SEC
News |
Chart |
Request a new note
C
A
S
I |
SFBS
-
NASDAQ
"ServisFirst Bancshares, Inc"
BANKING - Regional - Southeast Banks
|
$51.11
|
-0.92
-1.77% |
$51.93
|
39,930
62.88% of 50 DAV
50 DAV is 63,500
|
$53.58
-4.61%
|
7/19/2016
|
$53.28
|
PP = $52.82
|
|
MB = $55.46
|
Most Recent Note - 9/13/2016 5:48:43 PM
Y - Testing support at its 50 DMA line ($51.05) with today's quiet loss. Members were previously reminded - "A volume-driven gain and strong close above the pivot point are needed to clinch a convincing technical buy signal. It has been quietly consolidating since highlighted in yellow in the 7/19/16 mid-day report with pivot point cited based on the 6/01/16 high plus 10 cents."
>>> FEATURED STOCK ARTICLE : Still Consolidating Within Close Striking Distance of New Highs - 8/25/2016 |
View all notes |
Set NEW NOTE alert |
Company Profile |
SEC
News |
Chart |
Request a new note
C
A
S
I |
Symbol/Exchange
Company Name
Industry Group |
PRICE |
CHANGE
(%Change) |
Day High |
Volume
(% DAV)
(% 50 day avg vol) |
52 Wk Hi
% From Hi |
Featured
Date |
Price
Featured |
Pivot Featured |
|
Max Buy |
INGN
-
NASDAQ
Inogen Inc
HEALTH SERVICES - Medical Instruments and Supplies
|
$57.03
|
-1.96
-3.32% |
$59.17
|
234,470
117.24% of 50 DAV
50 DAV is 200,000
|
$60.71
-6.06%
|
8/5/2016
|
$51.72
|
PP = $56.08
|
|
MB = $58.88
|
Most Recent Note - 9/12/2016 6:06:55 PM
G - Posted a gain above its "max buy" level with light volume and its color code is changed to green. Remains at its 52-week high, stubbornly holding its ground since 8/09/16 when a volume-driven gain triggered a technical buy signal. See the latest FSU analysis for additional details and a new annotated graph.
>>> FEATURED STOCK ARTICLE : Stubbornly Holding Ground Near All-Time High - 9/12/2016 |
View all notes |
Set NEW NOTE alert |
Company Profile |
SEC
News |
Chart |
Request a new note
C
A
S
I |
OLLI
-
NASDAQ
Ollie's Bargain Outlet
Retail-DiscountandVariety
|
$25.23
|
-0.46
-1.79% |
$25.73
|
1,353,520
164.46% of 50 DAV
50 DAV is 823,000
|
$28.72
-12.15%
|
7/19/2016
|
$26.42
|
PP = $28.82
|
|
MB = $30.26
|
Most Recent Note - 9/13/2016 5:39:27 PM
G - Sputtering below its 50 DMA line ($26.20) after a spurt of damaging volume-driven losses. A rebound above that important short-term average is needed for its outlook to improve. Recent weakness followed news of a Secondary Offering. Reported earnings +50% on +16% sales revenues for the Jul '16 quarter. Members were repeatedly reminded in prior notes - "Volume-driven gains above the pivot point are still needed to trigger a convincing technical buy signal."
>>> FEATURED STOCK ARTICLE : Near High Awaiting Volume-Driven Gain to Trigger Technical Buy Signal - 8/24/2016 |
View all notes |
Set NEW NOTE alert |
Company Profile |
SEC
News |
Chart |
Request a new note
C
A
S
I |
|
|
|
THESE ARE NOT BUY RECOMMENDATIONS!
Comments contained in the body of this report are technical
opinions only. The material herein has been obtained
from sources believed to be reliable and accurate, however,
its accuracy and completeness cannot be guaranteed.
This site is not an investment advisor, hence it does
not endorse or recommend any securities or other investments.
Any recommendation contained in this report may not
be suitable for all investors and it is not to be deemed
an offer or solicitation on our part with respect to
the purchase or sale of any securities. All trademarks,
service marks and trade names appearing in this report
are the property of their respective owners, and are
likewise used for identification purposes only.
This report is a service available
only to active Paid Premium Members.
You may opt-out of receiving report notifications
at any time. Questions or comments may be submitted
by writing to Premium Membership Services 665 S.E. 10 Street, Suite 201 Deerfield Beach, FL 33441-5634 or by calling 1-800-965-8307
or 954-785-1121.
|
|
|