You are not logged in.
This means you
CAN ONLY VIEW reports that were published prior to Monday, April 7, 2025.
You
MUST UPGRADE YOUR MEMBERSHIP if you want to see any current reports.
AFTER MARKET UPDATE - WEDNESDAY, AUGUST 24TH, 2016
Previous After Market Report Next After Market Report >>>
|
|
|
|
DOW |
-65.82 |
18,481.48 |
-0.35% |
|
Volume |
736,225,980 |
+3% |
|
Volume |
1,570,401,990 |
+10% |
|
NASDAQ |
-42.39 |
5,217.69 |
-0.81% |
|
Advancers |
870 |
29% |
|
Advancers |
969 |
34% |
|
S&P 500 |
-11.46 |
2,175.44 |
-0.52% |
|
Decliners |
2,091 |
71% |
|
Decliners |
1,921 |
66% |
|
Russell 2000 |
-11.33 |
1,237.25 |
-0.91% |
|
52 Wk Highs |
112 |
|
|
52 Wk Highs |
113 |
|
|
S&P 600 |
-4.59 |
751.55 |
-0.61% |
|
52 Wk Lows |
10 |
|
|
52 Wk Lows |
23 |
|
|
 |
Distributional Pressure Weighed Major Indices Down
Kenneth J. Gruneisen - Passed the CAN SLIM® Master's Exam
Stocks finished lower on Wednesday. The Dow was down 65 points to 18481. The S&P 500 lost 11 points to 2175 and the Nasdaq Composite fell 42 points to 5217. The volume totals were higher than the prior session on the NYSE and on the Nasdaq exchange, hinting at heavier selling coming from the institutional crowd. Decliners led advancers by more than 2-1 on the NYSE and on the Nasdaq exchange. Leadership improved as there were 24 high-ranked companies from the Leaders List that made new 52-week highs and were listed on the BreakOuts Page, versus the total of 61 on the prior session. New 52-week highs totals contracted yet still outnumbered new 52-week lows on both the NYSE and the Nasdaq exchange. PICTURED: The S&P 500 Index is consolidating near its record high after rallying above its 2015 peak.
Big gains for the major indices were noted in prior commentaries and that bullish action signaled a new "confirmed uptrend" for the market (M criteria). See the Featured Stocks Pagewhich now lists a few noteworthy candidates that have made headway. The major averages declined as oil retreated and investors digested a weaker-than-expected update on the housing market. NYMEX WTI crude slid 3.1% to $46.56/barrel after the weekly EIA report showed crude inventories rose by 2.5 million barrels. On the data front, existing home sales fell 3.2% in July, the first decline since February amid a shortage of available properties. Nine of 10 sectors in the S&P 500 finished negative on the session as Health Care shares led the losses. Mylan (MYL -5.41%) fell with news the company faces congressional pressure to explain its EpiPen price increase. In earnings, Intuit (INTU -3.50%) fell as the application software company lowered its revenue outlook. Dycom (DY -7.49%) fell as the company reduced its revenue projections for recently acquired Goodman network operations. Shares of La-Z-Boy (LZB -12.69%) fell after reporting a 1.9% drop in same-store sales for the quarter. Lannett Company (LCI +13.71%) was a notable gainer as the pharmaceutical product manufacturer reported better-than-expected quarterly profit. Treasuries declined with the benchmark 10-year note down 3/32 to yield 1.55%. In commodities, COMEX gold lost 1.2% to $1324.40/ounce. In FOREX, the Dollar Index gained 0.2%
|
 Kenneth J. Gruneisen started out as a licensed stockbroker in August 1987, a couple of months prior to the historic stock market crash that took the Dow Jones Industrial Average down -22.6% in a single day. He has published daily fact-based fundamental and technical analysis on high-ranked stocks online for two decades. Through FACTBASEDINVESTING.COM, Kenneth provides educational articles, news, market commentary, and other information regarding proven investment systems that work in good times and bad.
Comments contained in the body of this report are technical opinions only and are not necessarily those of Gruneisen Growth Corp. The material herein has been obtained from sources believed to be reliable and accurate, however, its accuracy and completeness cannot be guaranteed. Our firm, employees, and customers may effect transactions, including transactions contrary to any recommendation herein, or have positions in the securities mentioned herein or options with respect thereto. Any recommendation contained in this report may not be suitable for all investors and it is not to be deemed an offer or solicitation on our part with respect to the purchase or sale of any securities. |
|
 |
Gold & Silver and Biotech Indexes Led Decliners
Kenneth J. Gruneisen - Passed the CAN SLIM® Master's Exam
The Gold & Silver Index ($XAU -8.23%) was a standout decliner and energy-linked groups were weak as the Oil Services Index ($OSX -1.34%) and the Integrated Oil Index ($XOI -0.27%) both edged lower. The Retail Index ($RLX -0.55%) posted a small loss on Wednesday and the Broker/Dealer Index ($XBD -0.31%) and Bank Index ($BKX -0.10%) both inched lower. The Biotechnology Index ($BTK -3.39%) led the tech sector lower while the Semiconductor Index ($SOX -0.87%) and Networking Index ($NWX -0.23%) each posted a modest loss. Charts courtesy www.stockcharts.com

PICTURED: The Retail Index ($RLX -0.55%) is consolidating near its record high.
| Oil Services |
$OSX |
161.88 |
-2.19 |
-1.33% |
+2.63% |
| Integrated Oil |
$XOI |
1,143.68 |
-3.04 |
-0.27% |
+6.62% |
| Semiconductor |
$SOX |
794.34 |
-6.97 |
-0.87% |
+19.72% |
| Networking |
$NWX |
396.35 |
-0.92 |
-0.23% |
+5.43% |
| Broker/Dealer |
$XBD |
166.66 |
-0.52 |
-0.31% |
-6.42% |
| Retail |
$RLX |
1,361.06 |
-7.54 |
-0.55% |
+6.05% |
| Gold & Silver |
$XAU |
95.34 |
-8.55 |
-8.23% |
+110.46% |
| Bank |
$BKX |
70.21 |
-0.07 |
-0.10% |
-3.93% |
| Biotech |
$BTK |
3,306.61 |
-116.19 |
-3.39% |
-13.30% |
|
|
|
 |
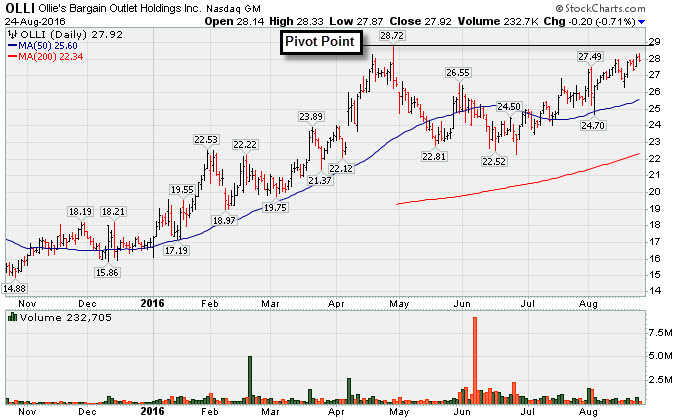
Near High Awaiting Volume-Driven Gain to Trigger Technical Buy Signal
Kenneth J. Gruneisen - Passed the CAN SLIM® Master's Exam
Ollie's Bargain Outlet (OLLI +$0.20 or -0.71% to $27.92) pulled back today with very light volume. It managed its best-ever close with the prior gain backed by near average volume while rising within close striking distance of all-time highs. It was last shown in this FSU section on 7/19/16 with an annotated graph under the headline, "Retail Firm Approaching Pivot Point".It was highlighted in yellow with pivot point cited based on its 4/28/16 high plus 10 cents in the 7/19/16 mid-day report (read here) and members have been repeatedly reminded - "Volume-driven gains for new highs (N criteria) are still needed to trigger a technical buy signal."
It reported earnings +82% on +19% sales revenues for the Apr '16 quarter, continuing its strong earnings track record with results above the +25% minimum earnings guideline (C criteria) for a 5th consecutive quarter. Its annual earnings (A criteria) history has been good.
The Retail-Discount and Variety firm's shares have been consolidating in a tight trading range since it completed another Secondary Offering on 6/06/16. Such offerings often hinder upward price progress for the short term, yet they also help to attract more institutional sponsorship. It completed a Secondary Offering on 2/18/16, and it completed its $16 IPO on 7/16/15. The number of top-rated funds owning its shares rose from 98 in Sep '15 to 206 in Jun '16, a reassuring sign concerning the I criteria. Its small supply of only 60 million shares outstanding (S criteria) can contribute to greater price volatility in the event of institutional buying or selling. |
|
|
Color Codes Explained :
Y - Better candidates highlighted by our
staff of experts.
G - Previously featured
in past reports as yellow but may no longer be buyable under the
guidelines.
***Last / Change / Volume data in this table is the closing quote data***
Symbol/Exchange
Company Name
Industry Group |
PRICE |
CHANGE
(%Change) |
Day High |
Volume
(% DAV)
(% 50 day avg vol) |
52 Wk Hi
% From Hi |
Featured
Date |
Price
Featured |
Pivot Featured |
|
Max Buy |
TDG
-
NYSE
Transdigm Group Inc
AEROSPACE/DEFENSE - Aerospace/Defense Products and; Services
|
$284.29
|
-2.47
-0.86% |
$286.90
|
193,182
46.22% of 50 DAV
50 DAV is 418,000
|
$289.67
-1.86%
|
5/11/2016
|
$248.33
|
PP = $245.00
|
|
MB = $257.25
|
Most Recent Note - 8/22/2016 5:34:02 PM
G - Volume has been drying up while hovering in a tight range near all-time highs. Its 50 DMA line and prior highs near $268 define important near-term support to watch on pullbacks.
>>> FEATURED STOCK ARTICLE : Gains Lack Great Volume While Wedging to New Highs - 7/27/2016 |
View all notes |
Set NEW NOTE alert |
Company Profile |
SEC
News |
Chart |
Request a new note
C
A
S
I |
IESC
-
NASDAQ
I E S Holdings Inc
Bldg-Maintenance and Svc
|
$16.03
|
+0.44
2.82% |
$16.43
|
105,931
112.69% of 50 DAV
50 DAV is 94,000
|
$16.77
-4.41%
|
7/26/2016
|
$15.79
|
PP = $15.74
|
|
MB = $16.53
|
Most Recent Note - 8/23/2016 5:10:16 PM
Y - Finished near the session high with today's gain backed by below average volume. Found support above its 50 DMA line ($14.05), and the recent low (13.50 on 8/02/16) defines important near-term support.
>>> FEATURED STOCK ARTICLE : Volume-Driven Gain for New Highs Clinched Technical Buy Signal - 7/26/2016 |
View all notes |
Set NEW NOTE alert |
Company Profile |
SEC
News |
Chart |
Request a new note
C
A
S
I |
NTES
-
NASDAQ
Netease Inc Adr
INTERNET - Internet Information Providers
|
$211.11
|
-2.06
-0.97% |
$214.38
|
969,191
87.47% of 50 DAV
50 DAV is 1,108,000
|
$217.37
-2.88%
|
6/29/2016
|
$182.42
|
PP = $186.55
|
|
MB = $195.88
|
 Most Recent Note - 8/24/2016 6:04:51 PM
G - Perched near its all-time high, extended from any sound base. Its 50 DMA line ($193) and prior highs near $186 define support to watch on pullbacks. Reported earnings +89% on +83% sales revenues for the Jun '16 quarter, continuing its strong earnings track record.
>>> FEATURED STOCK ARTICLE : Pulled Back on Higher Volume Following Earnings Report - 8/18/2016 |
View all notes |
Set NEW NOTE alert |
Company Profile |
SEC
News |
Chart |
Request a new note
C
A
S
I |
HTHT
-
NASDAQ
China Lodging Group Ads
LEISURE - Lodging
|
$43.85
|
+0.43
0.99% |
$44.36
|
458,333
212.19% of 50 DAV
50 DAV is 216,000
|
$46.57
-5.84%
|
7/13/2016
|
$38.87
|
PP = $39.29
|
|
MB = $41.25
|
Most Recent Note - 8/24/2016 12:24:02 PM
G - Poised for a best ever close with today's gain backed by above average volume. Extended from any sound base after rallying well above its "max buy" level. Recently hitting new highs with considerable volume-driven gains indicative of fresh institutional buying demand.
>>> FEATURED STOCK ARTICLE : Volume-Driven Gains for New Highs Signal Institutional Demand - 8/17/2016 |
View all notes |
Set NEW NOTE alert |
Company Profile |
SEC
News |
Chart |
Request a new note
C
A
S
I |
MXL
-
NYSE
Maxlinear Inc Cl A
Telecom-Infrastructure
|
$18.17
|
-0.39
-2.10% |
$18.59
|
1,648,179
121.73% of 50 DAV
50 DAV is 1,354,000
|
$22.50
-19.24%
|
5/16/2016
|
$19.24
|
PP = $19.20
|
|
MB = $20.16
|
Most Recent Note - 8/19/2016 5:33:31 PM
G - Found support at its 200 DMA line following a gap down and big volume-driven loss on 8/09/16. More damaging losses would raise greater concerns, meanwhile, a rebound above the 50 DMA line ($19.69) is needed for its outlook to improve.
>>> FEATURED STOCK ARTICLE : Consolidating Near Highs Above its "Max Buy" Level - 7/29/2016 |
View all notes |
Set NEW NOTE alert |
Company Profile |
SEC
News |
Chart |
Request a new note
C
A
S
I |
Symbol/Exchange
Company Name
Industry Group |
PRICE |
CHANGE
(%Change) |
Day High |
Volume
(% DAV)
(% 50 day avg vol) |
52 Wk Hi
% From Hi |
Featured
Date |
Price
Featured |
Pivot Featured |
|
Max Buy |
PATK
-
NASDAQ
Patrick Industries Inc
WHOLESALE - Building Materials Wholesale
|
$64.46
|
-0.50
-0.77% |
$64.71
|
231,329
106.11% of 50 DAV
50 DAV is 218,000
|
$69.53
-7.29%
|
5/24/2016
|
$53.45
|
PP = $50.68
|
|
MB = $53.21
|
Most Recent Note - 8/19/2016 12:54:47 PM
G - Found prompt support near its 50 DMA line, rallying this week with above average volume toward prior highs. Subsequent deterioration below the 50 DMA line and latest low ($59.51 on 8/16/16) would raise greater concerns and trigger a technical sell signal.
>>> FEATURED STOCK ARTICLE : Rallied +30% in 2 Months Since Breakout Was Featured - 7/28/2016 |
View all notes |
Set NEW NOTE alert |
Company Profile |
SEC
News |
Chart |
Request a new note
C
A
S
I |
FBHS
-
NYSE
Fortune Brands Hme & Sec
Bldg-Constr Prds/Misc
|
$63.10
|
-0.47
-0.74% |
$63.61
|
684,625
34.18% of 50 DAV
50 DAV is 2,003,100
|
$64.47
-2.13%
|
6/22/2016
|
$57.71
|
PP = $60.08
|
|
MB = $63.08
|
Most Recent Note - 8/19/2016 5:27:18 PM
G - It stalled since hitting new highs on 7/28/16 with +66% above average volume following strong earnings news. Prior highs and its 50 DMA line coincide defining near-term support in the $60 area.
>>> FEATURED STOCK ARTICLE : Perched Above "Max Buy" Level Following Volume-Driven Gain - 8/1/2016 |
View all notes |
Set NEW NOTE alert |
Company Profile |
SEC
News |
Chart |
Request a new note
C
A
S
I |
NVEE
-
NASDAQ
N V 5 Global Inc
Comml Svcs-Consulting
|
$32.18
|
+0.04
0.12% |
$32.36
|
139,551
158.58% of 50 DAV
50 DAV is 88,000
|
$37.00
-13.03%
|
4/19/2016
|
$28.20
|
PP = $28.10
|
|
MB = $29.51
|
Most Recent Note - 8/24/2016 12:33:40 PM
G - Rebounded from the session's early lows after testing its 50 DMA line ($30.83). The 50 DMA line and prior highs in the $30 define important near-term support. More damaging losses would raise concerns and trigger technical sell signals.
>>> FEATURED STOCK ARTICLE : Technically Strong Despite Fundamental Concerns - 8/22/2016 |
View all notes |
Set NEW NOTE alert |
Company Profile |
SEC
News |
Chart |
Request a new note
C
A
S
I |
SFBS
-
NASDAQ
"ServisFirst Bancshares, Inc"
BANKING - Regional - Southeast Banks
|
$51.84
|
+0.37
0.72% |
$51.91
|
32,435
34.14% of 50 DAV
50 DAV is 95,000
|
$53.58
-3.25%
|
7/19/2016
|
$53.28
|
PP = $52.82
|
|
MB = $55.46
|
Most Recent Note - 8/22/2016 5:35:09 PM
Y - Still quietly consolidating above its 50 DMA line ($50.12). Members were previously reminded - "A volume-driven gain and strong close above the pivot point are needed to clinch a convincing technical buy signal. It has been quietly consolidating since highlighted in yellow in the 7/19/16 mid-day report with pivot point cited based on the 6/01/16 high plus 10 cents."
>>> FEATURED STOCK ARTICLE : Meeting Resistance Near Prior Highs - 7/20/2016 |
View all notes |
Set NEW NOTE alert |
Company Profile |
SEC
News |
Chart |
Request a new note
C
A
S
I |
INGN
-
NASDAQ
Inogen Inc
HEALTH SERVICES - Medical Instruments and Supplies
|
$57.54
|
-0.56
-0.96% |
$58.28
|
209,393
93.48% of 50 DAV
50 DAV is 224,000
|
$58.78
-2.11%
|
8/5/2016
|
$51.72
|
PP = $56.08
|
|
MB = $58.88
|
Most Recent Note - 8/23/2016 5:11:33 PM
Y - Posted a gain with higher volume today and challenged its 52-week high. Stalled after its 8/09/16 volume-driven gain triggered a technical buy signal.
>>> FEATURED STOCK ARTICLE : Perched Within Striking Distance of Highs Following Rebound - 8/5/2016 |
View all notes |
Set NEW NOTE alert |
Company Profile |
SEC
News |
Chart |
Request a new note
C
A
S
I |
Symbol/Exchange
Company Name
Industry Group |
PRICE |
CHANGE
(%Change) |
Day High |
Volume
(% DAV)
(% 50 day avg vol) |
52 Wk Hi
% From Hi |
Featured
Date |
Price
Featured |
Pivot Featured |
|
Max Buy |
OLLI
-
NASDAQ
Ollie's Bargain Outlet
Retail-DiscountandVariety
|
$27.92
|
-0.20
-0.71% |
$28.33
|
232,471
34.09% of 50 DAV
50 DAV is 682,000
|
$28.72
-2.79%
|
7/19/2016
|
$26.42
|
PP = $28.82
|
|
MB = $30.26
|
Most Recent Note - 8/24/2016 6:02:11 PM
Y - Pulled back today with light volume, remaining within close striking distance of all-time highs. Members were repeatedly reminded in prior notes - "Volume-driven gains above the pivot point are still needed to trigger a convincing technical buy signal." See the latest FSU analysis for additional details and a new annotated graph.
>>> FEATURED STOCK ARTICLE : Near High Awaiting Volume-Driven Gain to Trigger Technical Buy Signal - 8/24/2016 |
View all notes |
Set NEW NOTE alert |
Company Profile |
SEC
News |
Chart |
Request a new note
C
A
S
I |
|
|
|
THESE ARE NOT BUY RECOMMENDATIONS!
Comments contained in the body of this report are technical
opinions only. The material herein has been obtained
from sources believed to be reliable and accurate, however,
its accuracy and completeness cannot be guaranteed.
This site is not an investment advisor, hence it does
not endorse or recommend any securities or other investments.
Any recommendation contained in this report may not
be suitable for all investors and it is not to be deemed
an offer or solicitation on our part with respect to
the purchase or sale of any securities. All trademarks,
service marks and trade names appearing in this report
are the property of their respective owners, and are
likewise used for identification purposes only.
This report is a service available
only to active Paid Premium Members.
You may opt-out of receiving report notifications
at any time. Questions or comments may be submitted
by writing to Premium Membership Services 665 S.E. 10 Street, Suite 201 Deerfield Beach, FL 33441-5634 or by calling 1-800-965-8307
or 954-785-1121.
|
|
|