You are not logged in.
This means you
CAN ONLY VIEW reports that were published prior to Friday, February 28, 2025.
You
MUST UPGRADE YOUR MEMBERSHIP if you want to see any current reports.
AFTER MARKET UPDATE - THURSDAY, AUGUST 18TH, 2016
Previous After Market Report Next After Market Report >>>
|
|
|
|
DOW |
+23.76 |
18,597.70 |
+0.13% |
|
Volume |
736,129,110 |
-4% |
|
Volume |
1,485,662,940 |
-7% |
|
NASDAQ |
+11.49 |
5,240.15 |
+0.22% |
|
Advancers |
2,095 |
70% |
|
Advancers |
1,980 |
69% |
|
S&P 500 |
+4.80 |
2,187.02 |
+0.22% |
|
Decliners |
882 |
30% |
|
Decliners |
905 |
31% |
|
Russell 2000 |
+9.17 |
1,236.85 |
+0.75% |
|
52 Wk Highs |
166 |
|
|
52 Wk Highs |
112 |
|
|
S&P 600 |
+4.93 |
748.81 |
+0.66% |
|
52 Wk Lows |
9 |
|
|
52 Wk Lows |
27 |
|
|
 |
Breadth Positive as Major Averages Rose and Leadership Improved
Kenneth J. Gruneisen - Passed the CAN SLIM® Master's Exam
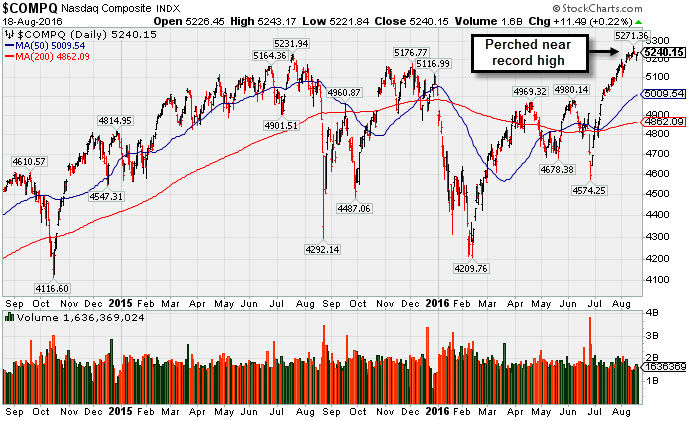
Stocks finished higher on Thursday. The Dow was up 23 points to 18597. The S&P 500 added 4 points to 2187 and the Nasdaq Composite gained 11 points to 5240. The volume totals were lighter than the prior session on the NYSE and on the Nasdaq exchange. Advancers led decliners by more than 2-1 on the NYSE and on the Nasdaq exchange. There were 41 high-ranked companies from the Leaders List that made new 52-week highs and were listed on the BreakOuts Page, versus the total of 23 on the prior session. New 52-week highs outnumbered new 52-week lows on both the NYSE and the Nasdaq exchange.PICTURED: The 2-year graph of the Nasdaq Composite Index shows it consolidating near its record high after rallying above its 2015 peak.
Big gains for the major indices were noted in prior commentaries and that bullish action signaled a new "confirmed uptrend" for the market (M criteria). See the Featured Stocks Pagewhich now lists a few noteworthy candidates that have made headway. The major averages advanced modestly on Thursday as oil prices rallied and investors digested updates on the economy. In Fed news, New York Fed President Dudley gave a speech this morning on the improving labor market while highlighting job growth. On the data front, initial jobless claims came in at 262,000, below the projected 265,000. In a separate release, the Philadelphia Fed reported activity increased in the Mid-Atlantic region in August. Seven of 10 sectors in the S&P 500 finished in positive territory. In the consumer space, Wal-Mart (WMT +1.9%) rose as the retail giant reported a 1.6% increase in U.S. comparable sales. L Brands (LB +5.1%) was higher after the apparel seller raised its full-year outlook. Over in Tech, NetApp (NTAP +17.4%) rallied as the company’s earnings beat expectations. Prison REITs were notable decliners after the Justice Department reported it will end the use of private prisons. Corrections Corp of America (CXW -35.5%) while GEO Group (GEO -39.6%) both plunged. Treasuries finished mostly higher with the benchmark 10-year note up 4/32 to yield 1.53%. In commodities, NYMEX WTI crude climbed 3.1% to $48.23/barrel. COMEX gold gained 0.6% to $1351.20/ounce. In FOREX, the Dollar Index fell 0.6%.
|
 Kenneth J. Gruneisen started out as a licensed stockbroker in August 1987, a couple of months prior to the historic stock market crash that took the Dow Jones Industrial Average down -22.6% in a single day. He has published daily fact-based fundamental and technical analysis on high-ranked stocks online for two decades. Through FACTBASEDINVESTING.COM, Kenneth provides educational articles, news, market commentary, and other information regarding proven investment systems that work in good times and bad.
Comments contained in the body of this report are technical opinions only and are not necessarily those of Gruneisen Growth Corp. The material herein has been obtained from sources believed to be reliable and accurate, however, its accuracy and completeness cannot be guaranteed. Our firm, employees, and customers may effect transactions, including transactions contrary to any recommendation herein, or have positions in the securities mentioned herein or options with respect thereto. Any recommendation contained in this report may not be suitable for all investors and it is not to be deemed an offer or solicitation on our part with respect to the purchase or sale of any securities. |
|
 |
Commodity-Linked Groups Led Gainers
Kenneth J. Gruneisen - Passed the CAN SLIM® Master's Exam
Commodity-linked groups led as the Oil Services Index ($OSX +2.53%), Integrated Oil Index ($XOI +1.14%), and the Gold & Silver Index ($XAU +1.36%) each posted a solid gain. The Broker/Dealer Index ($XBD +0.26%), Bank Index ($BKX +0.08%) and the Retail Index ($RLX +0.09%) each finished slightly higher on Thursday. The tech sector also was mostly higher as the Networking Index ($NWX +0.38%), Biotechnology Index ($BTK +0.20%) and the Semiconductor Index ($SOX +0.71%) posted unanimous gains. Charts courtesy www.stockcharts.com
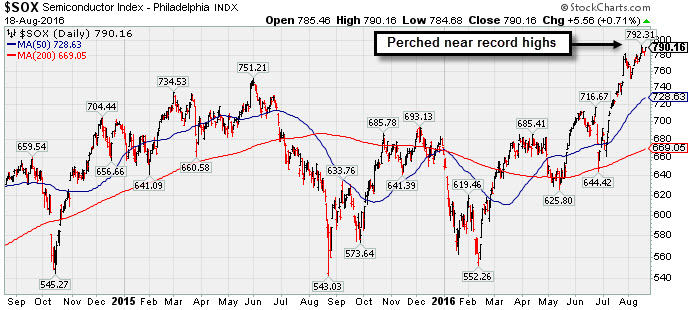
PICTURED: The 2-year chart of the Semiconductor Index ($SOX +0.71%) shows it perched near its record highs.
| Oil Services |
$OSX |
167.81 |
+4.15 |
+2.54% |
+6.39% |
| Integrated Oil |
$XOI |
1,161.21 |
+13.11 |
+1.14% |
+8.25% |
| Semiconductor |
$SOX |
790.16 |
+5.55 |
+0.71% |
+19.09% |
| Networking |
$NWX |
392.36 |
+1.49 |
+0.38% |
+4.37% |
| Broker/Dealer |
$XBD |
166.89 |
+0.44 |
+0.26% |
-6.29% |
| Retail |
$RLX |
1,361.58 |
+1.24 |
+0.09% |
+6.09% |
| Gold & Silver |
$XAU |
110.72 |
+1.48 |
+1.35% |
+144.42% |
| Bank |
$BKX |
70.11 |
+0.06 |
+0.09% |
-4.06% |
| Biotech |
$BTK |
3,338.95 |
+6.53 |
+0.20% |
-12.45% |
|
|
|
 |
Pulled Back on Higher Volume Following Earnings Report
Kenneth J. Gruneisen - Passed the CAN SLIM® Master's Exam
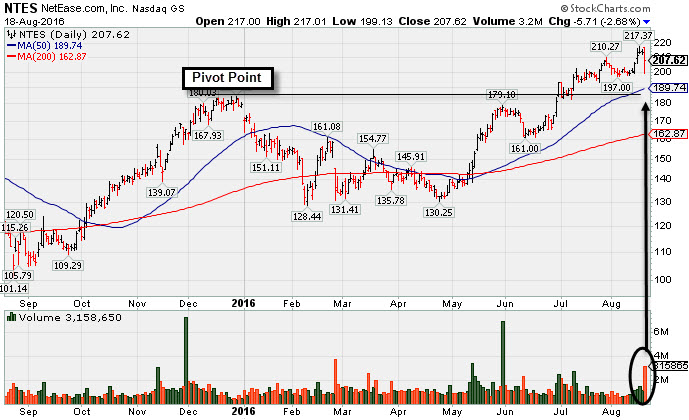
Netease Inc (NTES -2.68% or -$5.71 to $207.62) pulled back with above average volume today. Prior highs near $186 and its 50-day moving average (DMA) line define important support to watch. It reported earnings +89% on +83% sales revenues for the Jun '16 quarter, continuing its strong earnings track record. Volume and volatility often increase near earnings news. Disciplined investors avoid chasing stocks that are extended more than +5% above the prior high or pivot point.
NTES was last shown in this FSU section on 7/15/16 with an annotated graph under the headline, "Perched +5% Above Prior Highs Following Volume-Driven Gains". Since shown in this FSU section on 6/29/16 the Computer Software - gaming group has seen its Group Relative Strength Rating of rise to 76 from 37, a reassuring improvement regarding the L criteria.
NTES was highlighted in yellow with pivot point cited based on its 12/29/15 high plus 10 cents in the 5/11/16 mid-day report (read here). Earnings rose +79% on +108% sales revenues for the Mar '16 quarter, marking its 3rd consecutive quarter with earnings above the +25% minimum guideline (C criteria). Annual earnings (A criteria) growth has been strong while it made choppy progress since dropped from the Featured Stocks list on 7/17/12.
The number of top-rated funds owning its shares rose from 467 in Jun '15 to 765 in Jun '16, a reassuring sign concerning the I criteria. Its current Up/Down Volume Ratio of 1.4 is also an unbiased indication its shares have been under accumulation over the past 50 days. |
|
|
Color Codes Explained :
Y - Better candidates highlighted by our
staff of experts.
G - Previously featured
in past reports as yellow but may no longer be buyable under the
guidelines.
***Last / Change / Volume data in this table is the closing quote data***
Symbol/Exchange
Company Name
Industry Group |
PRICE |
CHANGE
(%Change) |
Day High |
Volume
(% DAV)
(% 50 day avg vol) |
52 Wk Hi
% From Hi |
Featured
Date |
Price
Featured |
Pivot Featured |
|
Max Buy |
TDG
-
NYSE
Transdigm Group Inc
AEROSPACE/DEFENSE - Aerospace/Defense Products and; Services
|
$285.16
|
+1.23
0.43% |
$286.21
|
235,484
52.80% of 50 DAV
50 DAV is 446,000
|
$289.67
-1.56%
|
5/11/2016
|
$248.33
|
PP = $245.00
|
|
MB = $257.25
|
Most Recent Note - 8/16/2016 7:40:00 PM
G - Volume has remained below average while recently hovering near all-time highs. Its 50 DMA line and prior highs near $268 define important near-term support to watch on pullbacks.
>>> FEATURED STOCK ARTICLE : Gains Lack Great Volume While Wedging to New Highs - 7/27/2016 |
View all notes |
Set NEW NOTE alert |
Company Profile |
SEC
News |
Chart |
Request a new note
C
A
S
I |
IESC
-
NASDAQ
I E S Holdings Inc
Bldg-Maintenance and Svc
|
$14.58
|
+0.12
0.83% |
$14.74
|
38,431
40.03% of 50 DAV
50 DAV is 96,000
|
$16.77
-13.06%
|
7/26/2016
|
$15.79
|
PP = $15.74
|
|
MB = $16.53
|
Most Recent Note - 8/16/2016 7:43:29 PM
Y - Found support above its 50 DMA line ($13.98). It negated the recent breakout by slumping back into the prior base raising concerns. Prior lows (13.50) define near-term support.
>>> FEATURED STOCK ARTICLE : Volume-Driven Gain for New Highs Clinched Technical Buy Signal - 7/26/2016 |
View all notes |
Set NEW NOTE alert |
Company Profile |
SEC
News |
Chart |
Request a new note
C
A
S
I |
NTES
-
NASDAQ
Netease Inc Adr
INTERNET - Internet Information Providers
|
$207.62
|
-5.71
-2.68% |
$217.01
|
3,158,650
285.85% of 50 DAV
50 DAV is 1,105,000
|
$217.37
-4.49%
|
6/29/2016
|
$182.42
|
PP = $186.55
|
|
MB = $195.88
|
 Most Recent Note - 8/18/2016 5:25:38 PM
G - Pulled back with above average volume today. Prior highs near $186 and its 50 DMA line define important support to watch. Reported earnings +89% on +83% sales revenues for the Jun '16 quarter, continuing its strong earnings track record. Volume and volatility often increase near earnings news. See the latest FSU analysis for more details and a new annotated graph.
>>> FEATURED STOCK ARTICLE : Pulled Back on Higher Volume Following Earnings Report - 8/18/2016 |
View all notes |
Set NEW NOTE alert |
Company Profile |
SEC
News |
Chart |
Request a new note
C
A
S
I |
HTHT
-
NASDAQ
China Lodging Group Ads
LEISURE - Lodging
|
$42.89
|
-0.77
-1.76% |
$46.57
|
596,148
283.88% of 50 DAV
50 DAV is 210,000
|
$45.70
-6.15%
|
7/13/2016
|
$38.87
|
PP = $39.29
|
|
MB = $41.25
|
Most Recent Note - 8/18/2016 12:22:03 PM
G - Recently hitting new highs with considerable volume-driven gains indicative of fresh institutional buying demand. Color code was changed to green after again rallying above its "max buy" level. See the latest FSU analysis for more details and annotated graph.
>>> FEATURED STOCK ARTICLE : Volume-Driven Gains for New Highs Signal Institutional Demand - 8/17/2016 |
View all notes |
Set NEW NOTE alert |
Company Profile |
SEC
News |
Chart |
Request a new note
C
A
S
I |
MXL
-
NYSE
Maxlinear Inc Cl A
Telecom-Infrastructure
|
$18.18
|
+0.03
0.17% |
$18.32
|
1,238,871
93.15% of 50 DAV
50 DAV is 1,330,000
|
$22.50
-19.20%
|
5/16/2016
|
$19.24
|
PP = $19.20
|
|
MB = $20.16
|
Most Recent Note - 8/15/2016 10:18:58 PM
G - Posted a 4th consecutive gain today since finding support at its 200 DMA line ($17.43). More damaging losses would raise greater concerns.
>>> FEATURED STOCK ARTICLE : Consolidating Near Highs Above its "Max Buy" Level - 7/29/2016 |
View all notes |
Set NEW NOTE alert |
Company Profile |
SEC
News |
Chart |
Request a new note
C
A
S
I |
Symbol/Exchange
Company Name
Industry Group |
PRICE |
CHANGE
(%Change) |
Day High |
Volume
(% DAV)
(% 50 day avg vol) |
52 Wk Hi
% From Hi |
Featured
Date |
Price
Featured |
Pivot Featured |
|
Max Buy |
PATK
-
NASDAQ
Patrick Industries Inc
WHOLESALE - Building Materials Wholesale
|
$65.08
|
+1.99
3.15% |
$65.16
|
1,991,036
1,178.13% of 50 DAV
50 DAV is 169,000
|
$69.53
-6.40%
|
5/24/2016
|
$53.45
|
PP = $50.68
|
|
MB = $53.21
|
Most Recent Note - 8/18/2016 12:37:30 PM
G - Found prompt support near its 50 DMA line, rallying with above average volume toward prior highs. Subsequent deterioration below the 50 DMA line and latest low ($59.51 on 8/16/16) would raise greater concerns and trigger a technical sell signal.
>>> FEATURED STOCK ARTICLE : Rallied +30% in 2 Months Since Breakout Was Featured - 7/28/2016 |
View all notes |
Set NEW NOTE alert |
Company Profile |
SEC
News |
Chart |
Request a new note
C
A
S
I |
FBHS
-
NYSE
Fortune Brands Hme & Sec
Bldg-Constr Prds/Misc
|
$62.57
|
+0.12
0.19% |
$62.72
|
806,123
40.75% of 50 DAV
50 DAV is 1,978,100
|
$64.47
-2.95%
|
6/22/2016
|
$57.71
|
PP = $60.08
|
|
MB = $63.08
|
Most Recent Note - 8/15/2016 10:20:56 PM
G - Volume totals have been cooling while stubbornly holding its ground in a tight range above its "max buy" level and near all-time highs. Rallied for new highs on 7/28/16 with +66% above average volume following strong earnings news.
>>> FEATURED STOCK ARTICLE : Perched Above "Max Buy" Level Following Volume-Driven Gain - 8/1/2016 |
View all notes |
Set NEW NOTE alert |
Company Profile |
SEC
News |
Chart |
Request a new note
C
A
S
I |
NVEE
-
NASDAQ
N V 5 Global Inc
Comml Svcs-Consulting
|
$34.22
|
-0.12
-0.35% |
$34.44
|
40,704
46.25% of 50 DAV
50 DAV is 88,000
|
$37.00
-7.51%
|
4/19/2016
|
$28.20
|
PP = $28.10
|
|
MB = $29.51
|
Most Recent Note - 8/17/2016 12:38:03 PM
G - Perched near all-time highs after recently wedging higher. Its 50 DMA line and prior highs in the $30 coincide defining important near-term support. Reported earnings +23% on +62% sales revenues, below the +25% minimum earnings guideline (C criteria), raising concerns.
>>> FEATURED STOCK ARTICLE : Winning Streak Leaves Leader Extended From Prior Base Pattern - 7/18/2016 |
View all notes |
Set NEW NOTE alert |
Company Profile |
SEC
News |
Chart |
Request a new note
C
A
S
I |
SFBS
-
NASDAQ
"ServisFirst Bancshares, Inc"
BANKING - Regional - Southeast Banks
|
$51.51
|
+0.39
0.76% |
$51.64
|
60,649
62.72% of 50 DAV
50 DAV is 96,700
|
$53.58
-3.86%
|
7/19/2016
|
$53.28
|
PP = $52.82
|
|
MB = $55.46
|
Most Recent Note - 8/17/2016 5:27:33 PM
Y - Still quietly sputtering above its 50 DMA line ($50.11). members were previously reminded - "A volume-driven gain and strong close above the pivot point are needed to clinch a convincing technical buy signal. It has been quietly consolidating since highlighted in yellow in the 7/19/16 mid-day report with pivot point cited based on the 6/01/16 high plus 10 cents."
>>> FEATURED STOCK ARTICLE : Meeting Resistance Near Prior Highs - 7/20/2016 |
View all notes |
Set NEW NOTE alert |
Company Profile |
SEC
News |
Chart |
Request a new note
C
A
S
I |
INGN
-
NASDAQ
Inogen Inc
HEALTH SERVICES - Medical Instruments and Supplies
|
$56.74
|
+0.62
1.10% |
$57.25
|
131,964
57.63% of 50 DAV
50 DAV is 229,000
|
$58.78
-3.47%
|
8/5/2016
|
$51.72
|
PP = $56.08
|
|
MB = $58.88
|
Most Recent Note - 8/16/2016 7:42:07 PM
Y - Fell today and finished near the session low with above average volume indicative of distributional pressure. Stalled after its 8/09/16 volume-driven gain triggered a technical buy signal.
>>> FEATURED STOCK ARTICLE : Perched Within Striking Distance of Highs Following Rebound - 8/5/2016 |
View all notes |
Set NEW NOTE alert |
Company Profile |
SEC
News |
Chart |
Request a new note
C
A
S
I |
Symbol/Exchange
Company Name
Industry Group |
PRICE |
CHANGE
(%Change) |
Day High |
Volume
(% DAV)
(% 50 day avg vol) |
52 Wk Hi
% From Hi |
Featured
Date |
Price
Featured |
Pivot Featured |
|
Max Buy |
OLLI
-
NASDAQ
Ollie's Bargain Outlet
Retail-DiscountandVariety
|
$27.80
|
+0.82
3.04% |
$27.84
|
542,651
72.45% of 50 DAV
50 DAV is 749,000
|
$28.72
-3.20%
|
7/19/2016
|
$26.42
|
PP = $28.82
|
|
MB = $30.26
|
Most Recent Note - 8/18/2016 5:27:24 PM
Y - Managed a best-ever close with today's gain backed by below average volume while rising within close striking distance of all-time highs. Members were repeatedly reminded in prior notes - "Volume-driven gains above the pivot point are still needed to trigger a convincing technical buy signal."
>>> FEATURED STOCK ARTICLE : Retail Firm Approaching Pivot Point - 7/19/2016 |
View all notes |
Set NEW NOTE alert |
Company Profile |
SEC
News |
Chart |
Request a new note
C
A
S
I |
|
|
|
THESE ARE NOT BUY RECOMMENDATIONS!
Comments contained in the body of this report are technical
opinions only. The material herein has been obtained
from sources believed to be reliable and accurate, however,
its accuracy and completeness cannot be guaranteed.
This site is not an investment advisor, hence it does
not endorse or recommend any securities or other investments.
Any recommendation contained in this report may not
be suitable for all investors and it is not to be deemed
an offer or solicitation on our part with respect to
the purchase or sale of any securities. All trademarks,
service marks and trade names appearing in this report
are the property of their respective owners, and are
likewise used for identification purposes only.
This report is a service available
only to active Paid Premium Members.
You may opt-out of receiving report notifications
at any time. Questions or comments may be submitted
by writing to Premium Membership Services 665 S.E. 10 Street, Suite 201 Deerfield Beach, FL 33441-5634 or by calling 1-800-965-8307
or 954-785-1121.
|
|
|