You are not logged in.
This means you
CAN ONLY VIEW reports that were published prior to Monday, April 7, 2025.
You
MUST UPGRADE YOUR MEMBERSHIP if you want to see any current reports.
AFTER MARKET UPDATE - THURSDAY, AUGUST 25TH, 2016
Previous After Market Report Next After Market Report >>>
|
|
|
|
DOW |
-33.07 |
18,448.41 |
-0.18% |
|
Volume |
696,374,560 |
-5% |
|
Volume |
1,380,759,140 |
-12% |
|
NASDAQ |
-5.49 |
5,212.20 |
-0.11% |
|
Advancers |
1,651 |
56% |
|
Advancers |
1,489 |
53% |
|
S&P 500 |
-2.97 |
2,172.47 |
-0.14% |
|
Decliners |
1,305 |
44% |
|
Decliners |
1,322 |
47% |
|
Russell 2000 |
+2.75 |
1,240.00 |
+0.22% |
|
52 Wk Highs |
115 |
|
|
52 Wk Highs |
79 |
|
|
S&P 600 |
+2.46 |
754.01 |
+0.33% |
|
52 Wk Lows |
16 |
|
|
52 Wk Lows |
25 |
|
|
 |
Major Averages Ended Lower Again After Recent Pressure
Kenneth J. Gruneisen - Passed the CAN SLIM® Master's Exam
Stocks finished lower on Thursday. The Dow was down 33 points to 18448. The S&P 500 lost 2 points to 2172 and the Nasdaq Composite fell 5 points to 5212. The volume totals were lighter than the prior session on the NYSE and on the Nasdaq exchange. Advancers narrowly led decliners by 8-7 on the NYSE and on the Nasdaq exchange. Leadership improved slightly as there were 29 high-ranked companies from the Leaders List that made new 52-week highs and were listed on the BreakOuts Page, versus the total of 24 on the prior session. New 52-week highs totals contracted yet still outnumbered new 52-week lows on both the NYSE and the Nasdaq exchange. PICTURED: The Dow Jones Industrial Average is consolidating near its record high after rallying above its 2015 peak.
The "confirmed uptrend" for the market (M criteria) has recently encountered some distributional pressure. See the Featured Stocks Page which now lists a few noteworthy candidates that have made headway. The major averages declined for a second session as Health Care shares retreated and investors await Fed Chair Janet Yellen’s speech on Friday. On the data front, durable goods orders rose 4.4% in July, advancing the most since January. In a separate release, initial jobless claims came in at 261,000, below the projected 265,000. Finally, Markit’s survey of U.S. business activity fell to 50.9 in August. Five of 10 sectors in the S&P 500 finished in negative territory. Mylan (MYL -0.70%) edged lower despite news the company will reduce costs for EpiPen. Express Scripts (ESRX -6.03%) fell amid its potential industry link to EpiPen’s price increase. In the consumer space, Dollar General (DG -17.63%) fell after same-store sales came in well below expectations. Signet Jewelers (SIG -12.63%) fell as its quarterly earnings fell short of forecasts. Guess? (GES +22.15%) was a notable gainer after the retailer raised its yearly guidance. Shares of Tiffany & Co (TIF +6.40%) ended higher as the luxury jeweler’s profit easily beat estimates. Treasuries declined with the benchmark 10-year note down 4/32 to yield 1.57%. In commodities, NYMEX WTI crude added 0.4% to $46.58/barrel. COMEX gold was off .4% to $1318.80/ounce. |
 Kenneth J. Gruneisen started out as a licensed stockbroker in August 1987, a couple of months prior to the historic stock market crash that took the Dow Jones Industrial Average down -22.6% in a single day. He has published daily fact-based fundamental and technical analysis on high-ranked stocks online for two decades. Through FACTBASEDINVESTING.COM, Kenneth provides educational articles, news, market commentary, and other information regarding proven investment systems that work in good times and bad.
Comments contained in the body of this report are technical opinions only and are not necessarily those of Gruneisen Growth Corp. The material herein has been obtained from sources believed to be reliable and accurate, however, its accuracy and completeness cannot be guaranteed. Our firm, employees, and customers may effect transactions, including transactions contrary to any recommendation herein, or have positions in the securities mentioned herein or options with respect thereto. Any recommendation contained in this report may not be suitable for all investors and it is not to be deemed an offer or solicitation on our part with respect to the purchase or sale of any securities. |
|
 |
Financial, Semiconductor, and Networking Indexes Each Rose Modestly
Kenneth J. Gruneisen - Passed the CAN SLIM® Master's Exam
The Gold & Silver Index ($XAU +1.23%) posted a gain while energy-linked groups were little changed as the Oil Services Index ($OSX +0.08%) and the Integrated Oil Index ($XOI +0.04%) both finished flat. The Retail Index ($RLX -0.54%) posted a small loss on Thursday while the Broker/Dealer Index ($XBD +0.64%) and Bank Index ($BKX +0.39%) both posted modest gains. The Biotechnology Index ($BTK -1.16%) dragged the tech sector lower while the Semiconductor Index ($SOX +0.39%) and Networking Index ($NWX +0.40%) each posted a modest gain. Charts courtesy www.stockcharts.com

PICTURED: The Integrated Oil Index ($XOI +0.04%) is consolidating above its 50-day and 200-day moving average (DMA) lines.
| Oil Services |
$OSX |
162.01 |
+0.13 |
+0.08% |
+2.71% |
| Integrated Oil |
$XOI |
1,144.19 |
+0.51 |
+0.04% |
+6.66% |
| Semiconductor |
$SOX |
797.47 |
+3.13 |
+0.39% |
+20.20% |
| Networking |
$NWX |
397.93 |
+1.58 |
+0.40% |
+5.85% |
| Broker/Dealer |
$XBD |
167.72 |
+1.06 |
+0.64% |
-5.82% |
| Retail |
$RLX |
1,353.71 |
-7.35 |
-0.54% |
+5.47% |
| Gold & Silver |
$XAU |
96.51 |
+1.17 |
+1.23% |
+113.05% |
| Bank |
$BKX |
70.48 |
+0.28 |
+0.40% |
-3.56% |
| Biotech |
$BTK |
3,268.36 |
-38.25 |
-1.16% |
-14.31% |
|
|
|
 |
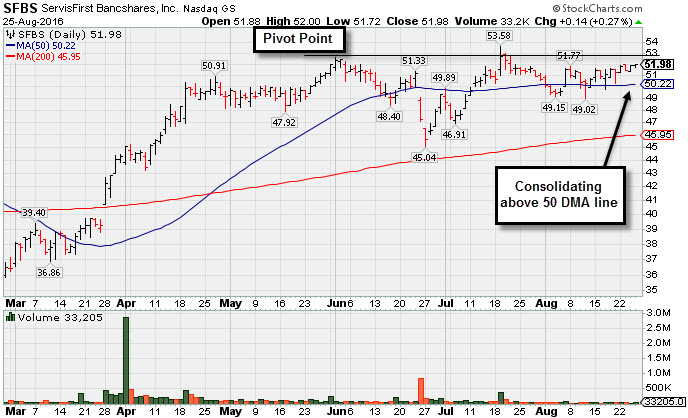
Still Consolidating Within Close Striking Distance of New Highs
Kenneth J. Gruneisen - Passed the CAN SLIM® Master's Exam
SFBS +$0.14 or +0.27% to $51.98) is still quietly consolidating above its 50-day moving average (DMA) line ($50.24). Without proof of fresh institutional buying demand there is little reason to believe a sustained and meaningful advance in price is likely. Members were previously reminded - "A volume-driven gain and strong close above the pivot point are needed to clinch a convincing technical buy signal. It has been quietly consolidating since highlighted in yellow in the 7/19/16 mid-day report with pivot point cited based on the 6/01/16 high plus 10 cents. "
It was last shown in this FSU section on 7/20/16 with an annotated graph under the headline, "Meeting Resistance Near Prior Highs". It was highlighted in yellow with pivot point cited based on the 6/01/16 high plus 10 cents. SFBS reported earnings +31% on +17% sales revenues for the Jun '16 quarter, its 3rd consecutive quarterly comparison above the +25% minimum earnings guideline (C criteria), helping it better match the fact-based investment system's guidelines. Earnings rose +28% and +34% in the Dec '15 and Mar '16 quarters, respectively, and underlying sales revenues growth has been in the +17-26% range. Its annual earnings (A criteria) history has been strong.
The number of top-rated funds owning its shares rose from 159 in Sep '15 to 228 in Jun '16, a reassuring sign concerning the I criteria. Its current Up/Down Volume Ratio of 1.1 is an unbiased indication its shares have been only under slight accumulation over the past 50 days. Its small supply of only 23.1 million shares (S criteria) in the public float can contribute to greater price volatility in the event of institutional buying or selling. |
|
|
Color Codes Explained :
Y - Better candidates highlighted by our
staff of experts.
G - Previously featured
in past reports as yellow but may no longer be buyable under the
guidelines.
***Last / Change / Volume data in this table is the closing quote data***
Symbol/Exchange
Company Name
Industry Group |
PRICE |
CHANGE
(%Change) |
Day High |
Volume
(% DAV)
(% 50 day avg vol) |
52 Wk Hi
% From Hi |
Featured
Date |
Price
Featured |
Pivot Featured |
|
Max Buy |
TDG
-
NYSE
Transdigm Group Inc
AEROSPACE/DEFENSE - Aerospace/Defense Products and; Services
|
$284.42
|
+0.13
0.05% |
$286.35
|
180,572
43.93% of 50 DAV
50 DAV is 411,000
|
$289.67
-1.81%
|
5/11/2016
|
$248.33
|
PP = $245.00
|
|
MB = $257.25
|
Most Recent Note - 8/22/2016 5:34:02 PM
G - Volume has been drying up while hovering in a tight range near all-time highs. Its 50 DMA line and prior highs near $268 define important near-term support to watch on pullbacks.
>>> FEATURED STOCK ARTICLE : Gains Lack Great Volume While Wedging to New Highs - 7/27/2016 |
View all notes |
Set NEW NOTE alert |
Company Profile |
SEC
News |
Chart |
Request a new note
C
A
S
I |
IESC
-
NASDAQ
I E S Holdings Inc
Bldg-Maintenance and Svc
|
$15.95
|
-0.08
-0.50% |
$16.13
|
38,891
40.94% of 50 DAV
50 DAV is 95,000
|
$16.77
-4.89%
|
7/26/2016
|
$15.79
|
PP = $15.74
|
|
MB = $16.53
|
Most Recent Note - 8/23/2016 5:10:16 PM
Y - Finished near the session high with today's gain backed by below average volume. Found support above its 50 DMA line ($14.05), and the recent low (13.50 on 8/02/16) defines important near-term support.
>>> FEATURED STOCK ARTICLE : Volume-Driven Gain for New Highs Clinched Technical Buy Signal - 7/26/2016 |
View all notes |
Set NEW NOTE alert |
Company Profile |
SEC
News |
Chart |
Request a new note
C
A
S
I |
NTES
-
NASDAQ
Netease Inc Adr
INTERNET - Internet Information Providers
|
$208.49
|
-2.62
-1.24% |
$210.30
|
775,188
69.71% of 50 DAV
50 DAV is 1,112,000
|
$217.37
-4.09%
|
6/29/2016
|
$182.42
|
PP = $186.55
|
|
MB = $195.88
|
Most Recent Note - 8/24/2016 6:04:51 PM
G - Perched near its all-time high, extended from any sound base. Its 50 DMA line ($193) and prior highs near $186 define support to watch on pullbacks. Reported earnings +89% on +83% sales revenues for the Jun '16 quarter, continuing its strong earnings track record.
>>> FEATURED STOCK ARTICLE : Pulled Back on Higher Volume Following Earnings Report - 8/18/2016 |
View all notes |
Set NEW NOTE alert |
Company Profile |
SEC
News |
Chart |
Request a new note
C
A
S
I |
HTHT
-
NASDAQ
China Lodging Group Ads
LEISURE - Lodging
|
$45.02
|
+1.17
2.67% |
$45.20
|
221,909
99.07% of 50 DAV
50 DAV is 224,000
|
$46.57
-3.33%
|
7/13/2016
|
$38.87
|
PP = $39.29
|
|
MB = $41.25
|
Most Recent Note - 8/24/2016 12:24:02 PM
G - Poised for a best ever close with today's gain backed by above average volume. Extended from any sound base after rallying well above its "max buy" level. Recently hitting new highs with considerable volume-driven gains indicative of fresh institutional buying demand.
>>> FEATURED STOCK ARTICLE : Volume-Driven Gains for New Highs Signal Institutional Demand - 8/17/2016 |
View all notes |
Set NEW NOTE alert |
Company Profile |
SEC
News |
Chart |
Request a new note
C
A
S
I |
MXL
-
NYSE
Maxlinear Inc Cl A
Telecom-Infrastructure
|
$18.51
|
+0.34
1.87% |
$18.69
|
1,073,763
78.07% of 50 DAV
50 DAV is 1,375,300
|
$22.50
-17.73%
|
5/16/2016
|
$19.24
|
PP = $19.20
|
|
MB = $20.16
|
Most Recent Note - 8/19/2016 5:33:31 PM
G - Found support at its 200 DMA line following a gap down and big volume-driven loss on 8/09/16. More damaging losses would raise greater concerns, meanwhile, a rebound above the 50 DMA line ($19.69) is needed for its outlook to improve.
>>> FEATURED STOCK ARTICLE : Consolidating Near Highs Above its "Max Buy" Level - 7/29/2016 |
View all notes |
Set NEW NOTE alert |
Company Profile |
SEC
News |
Chart |
Request a new note
C
A
S
I |
Symbol/Exchange
Company Name
Industry Group |
PRICE |
CHANGE
(%Change) |
Day High |
Volume
(% DAV)
(% 50 day avg vol) |
52 Wk Hi
% From Hi |
Featured
Date |
Price
Featured |
Pivot Featured |
|
Max Buy |
PATK
-
NASDAQ
Patrick Industries Inc
WHOLESALE - Building Materials Wholesale
|
$64.36
|
-0.10
-0.16% |
$64.44
|
160,355
72.56% of 50 DAV
50 DAV is 221,000
|
$69.53
-7.44%
|
5/24/2016
|
$53.45
|
PP = $50.68
|
|
MB = $53.21
|
Most Recent Note - 8/19/2016 12:54:47 PM
G - Found prompt support near its 50 DMA line, rallying this week with above average volume toward prior highs. Subsequent deterioration below the 50 DMA line and latest low ($59.51 on 8/16/16) would raise greater concerns and trigger a technical sell signal.
>>> FEATURED STOCK ARTICLE : Rallied +30% in 2 Months Since Breakout Was Featured - 7/28/2016 |
View all notes |
Set NEW NOTE alert |
Company Profile |
SEC
News |
Chart |
Request a new note
C
A
S
I |
FBHS
-
NYSE
Fortune Brands Hme & Sec
Bldg-Constr Prds/Misc
|
$63.52
|
+0.42
0.67% |
$63.59
|
847,415
42.44% of 50 DAV
50 DAV is 1,996,800
|
$64.47
-1.47%
|
6/22/2016
|
$57.71
|
PP = $60.08
|
|
MB = $63.08
|
Most Recent Note - 8/19/2016 5:27:18 PM
G - It stalled since hitting new highs on 7/28/16 with +66% above average volume following strong earnings news. Prior highs and its 50 DMA line coincide defining near-term support in the $60 area.
>>> FEATURED STOCK ARTICLE : Perched Above "Max Buy" Level Following Volume-Driven Gain - 8/1/2016 |
View all notes |
Set NEW NOTE alert |
Company Profile |
SEC
News |
Chart |
Request a new note
C
A
S
I |
NVEE
-
NASDAQ
N V 5 Global Inc
Comml Svcs-Consulting
|
$32.07
|
-0.11
-0.34% |
$32.25
|
41,003
45.56% of 50 DAV
50 DAV is 90,000
|
$37.00
-13.32%
|
4/19/2016
|
$28.20
|
PP = $28.10
|
|
MB = $29.51
|
Most Recent Note - 8/24/2016 12:33:40 PM
G - Rebounded from the session's early lows after testing its 50 DMA line ($30.83). The 50 DMA line and prior highs in the $30 define important near-term support. More damaging losses would raise concerns and trigger technical sell signals.
>>> FEATURED STOCK ARTICLE : Technically Strong Despite Fundamental Concerns - 8/22/2016 |
View all notes |
Set NEW NOTE alert |
Company Profile |
SEC
News |
Chart |
Request a new note
C
A
S
I |
SFBS
-
NASDAQ
Servisfirst Bancshares
BANKING - Regional - Southeast Banks
|
$51.98
|
+0.14
0.27% |
$52.00
|
33,305
35.43% of 50 DAV
50 DAV is 94,000
|
$53.58
-2.99%
|
7/19/2016
|
$53.28
|
PP = $52.82
|
|
MB = $55.46
|
 Most Recent Note - 8/25/2016 5:04:41 PM
Y - Quietly consolidating within close striking distance of its 52-week high. Members were previously reminded - "A volume-driven gain and strong close above the pivot point are needed to clinch a convincing technical buy signal. It has been quietly consolidating since highlighted in yellow in the 7/19/16 mid-day report with pivot point cited based on the 6/01/16 high plus 10 cents." See the latest FSU analysis for more details and a new annotated graph.
>>> FEATURED STOCK ARTICLE : Still Consolidating Within Close Striking Distance of New Highs - 8/25/2016 |
View all notes |
Set NEW NOTE alert |
Company Profile |
SEC
News |
Chart |
Request a new note
C
A
S
I |
INGN
-
NASDAQ
Inogen Inc
HEALTH SERVICES - Medical Instruments and Supplies
|
$57.67
|
+0.13
0.23% |
$58.40
|
219,646
98.06% of 50 DAV
50 DAV is 224,000
|
$58.78
-1.89%
|
8/5/2016
|
$51.72
|
PP = $56.08
|
|
MB = $58.88
|
Most Recent Note - 8/23/2016 5:11:33 PM
Y - Posted a gain with higher volume today and challenged its 52-week high. Stalled after its 8/09/16 volume-driven gain triggered a technical buy signal.
>>> FEATURED STOCK ARTICLE : Perched Within Striking Distance of Highs Following Rebound - 8/5/2016 |
View all notes |
Set NEW NOTE alert |
Company Profile |
SEC
News |
Chart |
Request a new note
C
A
S
I |
Symbol/Exchange
Company Name
Industry Group |
PRICE |
CHANGE
(%Change) |
Day High |
Volume
(% DAV)
(% 50 day avg vol) |
52 Wk Hi
% From Hi |
Featured
Date |
Price
Featured |
Pivot Featured |
|
Max Buy |
OLLI
-
NASDAQ
Ollie's Bargain Outlet
Retail-DiscountandVariety
|
$26.70
|
-1.22
-4.37% |
$27.74
|
714,025
109.35% of 50 DAV
50 DAV is 653,000
|
$28.72
-7.03%
|
7/19/2016
|
$26.42
|
PP = $28.82
|
|
MB = $30.26
|
Most Recent Note - 8/25/2016 5:06:35 PM
Y - Gapped down and finished near the session low today with a large loss on higher volume indicative of distributional pressure. Members were repeatedly reminded in prior notes - "Volume-driven gains above the pivot point are still needed to trigger a convincing technical buy signal." See the latest FSU analysis for additional details and an annotated graph.
>>> FEATURED STOCK ARTICLE : Near High Awaiting Volume-Driven Gain to Trigger Technical Buy Signal - 8/24/2016 |
View all notes |
Set NEW NOTE alert |
Company Profile |
SEC
News |
Chart |
Request a new note
C
A
S
I |
|
|
|
THESE ARE NOT BUY RECOMMENDATIONS!
Comments contained in the body of this report are technical
opinions only. The material herein has been obtained
from sources believed to be reliable and accurate, however,
its accuracy and completeness cannot be guaranteed.
This site is not an investment advisor, hence it does
not endorse or recommend any securities or other investments.
Any recommendation contained in this report may not
be suitable for all investors and it is not to be deemed
an offer or solicitation on our part with respect to
the purchase or sale of any securities. All trademarks,
service marks and trade names appearing in this report
are the property of their respective owners, and are
likewise used for identification purposes only.
This report is a service available
only to active Paid Premium Members.
You may opt-out of receiving report notifications
at any time. Questions or comments may be submitted
by writing to Premium Membership Services 665 S.E. 10 Street, Suite 201 Deerfield Beach, FL 33441-5634 or by calling 1-800-965-8307
or 954-785-1121.
|
|
|